A Spitzer Space Telescope Atlas of Centauri: The Stellar Population, Mass Loss, and the Intracluster Medium
Abstract
We present a Spitzer Space Telescope imaging survey of the most massive Galactic globular cluster, Centauri, and investigate stellar mass loss at low metallicity and the intracluster medium (ICM). The survey covers approximately 3.2 the cluster half-mass radius at 3.6, 4.5, 5.8, 8, and 24 µm, resulting in a catalog of over 40,000 point-sources in the cluster. Approximately 140 cluster members ranging 1.5 dex in metallicity show a red excess at 24 µm, indicative of circumstellar dust. If all of the dusty sources are experiencing mass loss, the cumulative rate of loss is estimated at 2.9 – 4.2 10 yr-1, 63% – 66% of which is supplied by three asymptotic giant branch stars at the tip of the Red Giant Branch (RGB). There is little evidence for strong mass loss lower on the RGB. If this material had remained in the cluster center, its dust component ( 1 10) would be detectable in our 24 and 70 µm images. While no dust cloud located at the center of Cen is apparent, we do see four regions of very faint, diffuse emission beyond two half-mass radii at 24 µm. It is unclear whether these dust clouds are foreground emission or are associated with Cen. In the latter case, these clouds may be the ICM in the process of escaping from the cluster.
1 Introduction
Despite their old age and low metal content, Galactic globular clusters (GCs) are now known to be dust factories (Ramdani & Jorissen, 2001; Origlia et al., 2002; Evans et al., 2003; Boyer et al., 2006; van Loon et al., 2006a; Lebzelter et al., 2006; Ita et al., 2007). This has important implications for our understanding of mass loss from low-mass and metal-poor stars and for the replenishment of the interstellar medium (ISM) within old, metal-poor stellar systems, such as GCs, dwarf spheroidal (dSph) galaxies, and galactic halos.
All stars more massive than lose a significant fraction of their mass before they deflagrate or leave a compact remnant (see reviews by Iben & Renzini, 1983; Chiosi & Maeder, 1986). In the final stages of evolution, most stars enter higher stages of nuclear burning, and the products of this nucleosynthesis are transported to the stellar surface through convection or rotation. The chemically enriched mass that is recycled (with some delay) into the ISM has a significant impact on any further star formation, and drives the chemical evolution within galaxies. In particular, the enrichment of the ISM by dust is of great importance, as grains play important roles in many ISM processes, including the formation of molecular hydrogen (Gould & Salpeter, 1963) and planet formation. The winds of low and intermediate-mass stars on the upper red giant and asymptotic giant branches (RGB and AGB) and massive red supergiants are prolific dust producers (Gehrz, 1989). The dust is an integral part of the driving mechanism of the most massive winds (e.g., Gehrz & Woolf, 1971; Jura & Morris, 1985; Gail & Sedlmayr, 1987), and our understanding of red giant mass loss relies heavily on the details of the dust condensation process (e.g., Salpeter, 1974; Gauger et al., 1990; Höfner & Dorfi, 1997) — which is poorly understood in particular at low metallicity (for a review, see van Loon, 2006).
GCs are exquisite laboratories in which to study stellar winds because they represent the closest match to a single stellar population at metallicities that span over two orders of magnitude down to 1% solar (cf. Gratton et al., 2004). Mass loss remains important throughout the history of a GC (van Loon & McDonald, 2008); even in old GCs, stars lose 30% of their mass, most or all of which is removed from the cluster via a host of mechanisms including ram-pressure stripping during Galactic plane crossings. RGB mass loss may be responsible for the blue horizontal branches observed in metal-poor GCs (Rood, 1973), and evidence for mass loss is seen in the line profiles of chromospherically active or pulsating red giants in GCs (Dupree et al., 1984; Cacciari et al., 2004; McDonald & van Loon, 2007; Meszaros et al., 2008).
There is mounting evidence for mass loss from GC red giants in the form of dusty winds (Ramdani & Jorissen, 2001; Origlia et al., 2002). The first spectroscopic identifications of silicate dust are in the tip-AGB star V1 in the massive GC 47 Tucanae (van Loon et al., 2006a) and subsequent identification of minerals in other AGB stars in 47 Tuc with Spitzer IRS observations (Lebzelter et al., 2006). With [Fe/H] , 47 Tuc is a metal-rich GC, providing an environment similar to that found, for instance, in the Small Magellanic Cloud. To probe uncharted terrain, it is important to study dust in GCs at lower metallicity. The surprising detection of both interstellar and circumstellar dust and gas in the metal-poor GC M 15 (Evans et al., 2003; Boyer et al., 2006; van Loon et al., 2006b) demonstrates that dust forms even in extremely metal-deficient environments.
1.1 Centauri
The most massive Galactic GC, Centauri, contains enough stars in the dusty wind phase for an empirical reconstruction of the evolution of mass loss. Its gravitational well ( km s-1; Gnedin et al., 2002) could retain interstellar matter if winds are slow. Cen is located approximately 15° out of the Galactic plane at a distance of 5 kpc (Lub, 2002; van de Ven et al., 2006; Del Principe et al., 2006), so it is possible to probe the stellar population to the cluster core.
The bulk of the stars in Cen have [Fe/H] (Norris, 1996; Smith et al., 2000), a metallicity much lower than the environments in which circumstellar dust has traditionally been studied. Complications arise because Cen also harbors a small fraction of stars up to an order of magnitude more metal-rich (Lee et al., 1999; Pancino et al., 2000, 2002) and an intermediate population of stars with an abnormally high helium content (Norris, 1996, 2004). Red giants in Cen display a range in surface abundances, from oxygen-rich, M-type stars with titanium oxides, stars enhanced in CH or in cyanide (CN), to genuine carbon stars with molecular carbon (C2; van Loon et al., 2007). These disparate populations cause difficulties in stellar evolution studies of Cen, but since stars from the metal-rich and metal-poor populations can be distinguished by means of optical spectroscopy, Cen presents us with a unique opportunity to study the dust and mass loss within a single environment as a function of atmospheric chemistry.
Consensus has yet to be reached regarding the formation history of the different subpopulations (Sollima et al., 2005; Stanford et al., 2006; Villanova et al., 2007). The spread and peculiarities in elemental abundances in Cen have been interpreted as evidence that this GC may be the remnant nucleus of a tidally disrupted dSph (Zinnecker et al., 1988; Freeman, 1993). If so, Cen may offer us insight into the mass loss and chemical enrichment in the much more distant nucleated dSphs, and perhaps dSphs in general.
Here, we present NASA Spitzer Space Telescope (Werner et al., 2004; Gehrz et al., 2007) images of Cen and a catalog including the magnitudes of over 40,000 point-sources from 3.6 to 70 µm. The 24 µm mosaic, which enables reliable detection of individual circumstellar dust shells near the peak wavelength of their spectral energy distributions (SEDs), provides the most dramatic improvement over previous data. We make use of proper motion (van Leeuwen et al., 2000) and radial velocity (van Loon et al., 2007) measurements to separate cluster members from the substantial foreground stellar and background galaxy populations. Optical spectroscopic information permits us to compare the contributions from stars of different composition and evolutionary status to their infrared (IR) emission and dust production. Our observations are discussed in § 2, photometry and the Cen point-source catalog are described in § 3. The color-magnitude diagrams (CMDs), stellar populations, mass loss, and the intracluster medium (ICM) dust are discussed in § 4, and our conclusions are presented in § 5.
2 Observations
We used the NASA Spitzer Space Telescope to obtain image maps of the GC Cen (Program Identification [PID] 20648, PI: van Loon) with the Infrared Array Camera (IRAC; Fazio et al., 2004) and the Multiband Imaging Photometer for Spitzer (MIPS; Rieke et al., 2004). Observations are centered at R.A. = 1326459, decl. = –47°28′370 [J2000.0] and map the cluster to at least 3.2 times the half-mass radius ( 4.8′; Harris, 1996) at each wavelength. Observation details are summarized in Table 1.
Images centered at 3.6, 4.5, 5.8, and 8 µm were obtained with IRAC on 2006 March 26 UT. We observed in high dynamic range mode, enabling us to correct saturated sources in the long exposures (10.4 s) with their counterparts in the short exposures (0.4 s) while still achieving a high signal-to-noise ratio for the fainter sources. Images were taken at nine dither positions in a cycling pattern to build redundancy against outliers and artefacts. The resulting image map contains a total of 441 images and covers an area approximately 35′ 35′ around the cluster center.
MIPS images at 24 and 70 µm were obtained on 2006 February 22 UT and 2006 March 02 UT with seven scan legs of approximately 0.5° in length. The resulting mosaics combine 4,620 images for each wavelength and cover a total area of approximately 35′ 55′. We designed our MIPS observing campaign with the intention of obtaining only 24 µm data, and the MIPS 70 and 160 µm data were obtained automatically (see Rieke et al., 2004). Due to the non-functioning half of the 70 µm array, the 70 µmdata do not have complete coverage. The warm state of the telescope during the observations saturated the 160 µm array, rendering the 160 µm data useless. MIPS observation details are summarized in Table 1.
Raw MIPS and IRAC data were processed with the Spitzer Science Center (SSC) pipeline, version S13.2.0111http://ssc.spitzer.caltech.edu/archanaly/plhistory/. The Basic Calibrated Data (BCD) were post-processed with portions of the 2006 March 01 version of the SSC Legacy MOPEX software (Makovoz & Marleau, 2005). For IRAC, after applying an array distortion correction, we implemented the MOPEX background-matching routine to minimize pixel offsets in overlapping areas of the mosaics and the MOPEX mosaicker to eliminate cosmic rays and other outliers. No further cosmetic corrections were applied to the BCDs before performing point-spread-function (PSF) photometry. The final mosaics have a pixel size of 122 pix-1. A three-color image of the first three IRAC bands is presented in Figure 1a, in which very few sources appear with a red or blue excess.
For the MIPS 24 µm data, we created and applied scan-mirror-dependent and scan-mirror-independent flat fields for all images excluding the bias boost images, any image within 10′ of the cluster center, and any image containing a very bright source. A 2-degree polynomial fit was applied over the entire image to subtract the zodiacal background. At 70 µm, we first performed pixel time-filtering and column filtering with SSC contributed software from D. Fadda and D. Frayer222http://ssc.spitzer.caltech.edu/mips/filter/. We then implemented the MOPEX background-matching and mosaic routines at both 24 and 70 µm before proceeding with point-source extraction. An IRAC and MIPS three-color image is presented in Figure 1b, in which several cool dusty objects appear green at 8 µm and red at 24 µm.
3 Photometry
3.1 Point-Source Extraction
Point-source extraction for 3.6 – 24 µm was done with the DAOphot II photometry package (Stetson, 1987). PSFs were created using a minimum of 20 isolated stars. Sources brighter than 4 over the background were chosen for extraction from the mosaic image. Any remaining outliers and other extended objects were eliminated from the sample with a sharpness cut-off, which identifies sources broader or narrower than the PSF. Photometric completeness at each wavelength was determined through false star tests; 50% and 90% completeness limits are listed in Table 2.
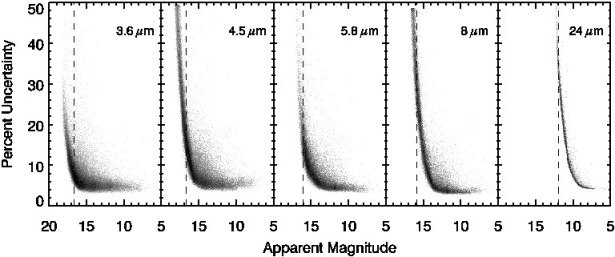
The final fluxes and flux uncertainties are color-corrected according to the IRAC and MIPS Data Handbooks versions 3.0 and 3.2.1, respectively (Spitzer Science Center, 2006a, b), using a 5000 K blackbody, which is the approximate temperature of a typical RGB star. Fluxes in the point-source catalog described in § 3.2 have not been corrected for reddening. Where the reddening correction has been applied for analysis of the data, values are taken from Indebetouw et al. (2005) and () 0.11 (Lub, 2002). The pixel-phase-dependent photometric correction described by Reach et al. (2005) was also applied to 3.6 µm fluxes and their uncertainties. This correction was applied only to 3.6 µm because it is not well defined for the other Spitzer wavelengths. The flux uncertainties that we report in the Spitzer catalog described in section § 3.2 include both the uncertainties quoted by DAOphot and the calibration uncertainties specified by Reach et al. (2005) for IRAC and Engelbracht et al. (2007) for 24 µm. All fluxes were converted to stellar magnitudes using the zero fluxes reported in the Spitzer Data Handbooks. The photometric uncertainty as a function of source magnitude is given in Figure 2.
3.2 The Point-Source Catalog
We have created a point-source catalog of 40,000 Cen objects detected at 3.6, 4.5, 5.8, 8, and 24 µm. An extraction from this catalog is given in Table 3, where column one is the source number, column two is the source ID, columns 3 – 7 are Spitzer magnitudes, column 8 is the membership probability (van Leeuwen et al., 2000), columns 9 and 10 list source type labels, and column 11 lists the Leiden identifiers (LEID) from van Leeuwen et al. (2000). The source ID follows the standard Spitzer naming convention, giving the truncated (J2000) coordinates. The complete Spitzer catalog is available electronically through the Centre Données de Strasbourg (CDS).
Cluster members and non-members were identified by cross-correlating the Spitzer source coordinates with those in the van Leeuwen et al. (2000) proper motion catalog. The van Leeuwen et al. (2000) catalog is not as deep as our survey nor is the coverage as wide, so many Spitzer sources do not have proper motion measurements. van Leeuwen et al. (2000) derived positions and proper motions by cross-referencing with the International Celestial Reference Frame as defined by the Hipparcos catalog and extended to a denser grid of stars by the Tycho-2 catalog. The coordinates of the Spitzer sources are systematically offset from the van Leeuwen et al. (2000) sources, with mean offsets of ″ and ″ and standard deviations of 0.15″ and 0.10″, respectively. Coordinates in the Spitzer catalog are not corrected for this offset.
If a source in any IRAC band was not associated with another IRAC, MIPS, or van Leeuwen et al. (2000) object, we considered it a false detection and dropped it from the Spitzer catalog. MIPS 24 µm sources that do not have IRAC or optical counterparts remain in the catalog since the very red SEDs of many MIPS sources peak in the mid-IR and are thus fainter than the sensitivity limits in the bluer Spitzer bandpasses.
Also included in the Spitzer catalog are notes in columns 9 and 10 indicating if the source is a galaxy, AGB, anomalous RGB (RGB-a), or Horizontal Branch (HB) star, based on its locations on the CMDs (see § 4.1). The catalog also indicates sources that are super-Ba- or CN-rich and/or are M-type (M), carbon (C), or post-AGB stars (P), as identified by van Loon et al. (2007).
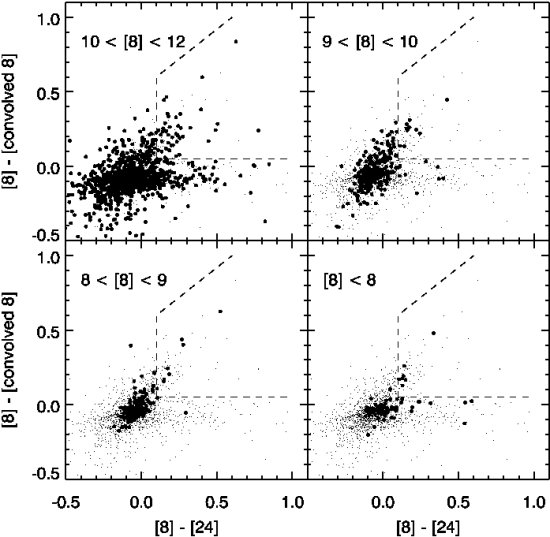
The differing resolution between IRAC and MIPS has caused some sources that are isolated in IRAC to be blended in the 24 µm mosaic, which produces an artificially red [8] – [24] color. To determine which sources are potentially affected by blending, we convolved the 8 µm mosaic with the 24 µm PSF and identified sources with elevated fluxes in the convolved mosaic compared to the unaltered mosaic (Fig. 3). These sources are marked with “B24”, for “blended at 24 µm”, in column 10 of the Spitzer catalog.
3.3 Luminosity Functions and Completeness
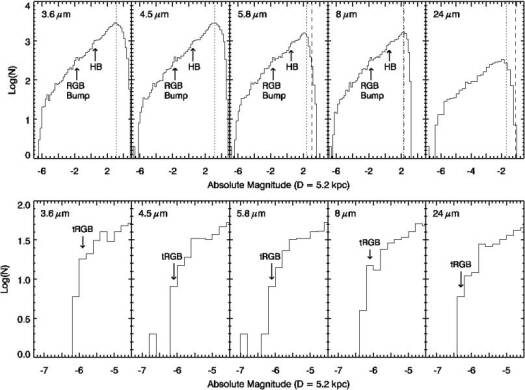
Luminosity functions for epoch two are displayed in Figure 4. The distance modulus used to determine absolute magnitudes is 13.58, given a distance of 5.2 kpc (Del Principe et al., 2006). In the top panels, known non-members are excluded and of the remaining sources, only those that are in at least two adjacent wavebands are included. The IRAC luminosity functions show a strong change in slope near an absolute magnitude of –2 that may be the RGB bump or the RGB clump, both of which are located at absolute magnitudes of 2 – 0 in the near-IR data of several GCs (Valenti et al., 2007), depending on the metallicity of the cluster. The HB is also visible at 3.6, 4.5, and 5.8 µm just beyond an absolute magnitude of zero as either a bump or change in slope.
The tip of the RGB (tRGB) is difficult to determine from the luminosity functions, as the source counts are low at absolute magnitudes brighter than 5. The sparse population of AGB stars above the tRGB is expected in GCs since this phase of stellar evolution is particularly short-lived and also because the very low mass of stars in GCs () prevents AGB luminosity from climbing much above the tRGB. Nevertheless, the source counts of known cluster members (lower panels of Fig. 4) do drop by a factor of 3 to 4 past the bins, which are 0.2 magnitudes wide, centered at absolute magnitudes of , , , , and at 3.6, 4.5, 5.8, 8, and 24 µm, respectively. The K-band tRGB for Cen is located at 6.04 0.16 magnitudes (Bellazzini et al., 2004). At 3.6 µm, the tRGB location is 6 magnitudes for many stellar populations, including the Large Magellanic Cloud (LMC; van Loon et al., 2005) and smaller stellar populations such as the Local Group dwarf irregular galaxy WLM (Jackson et al., 2007).
Photometric completeness in each waveband was determined by performing false star tests, for which 2% of the total stellar population that mimicked the luminosity function was added to each mosaic at random positions and PSF photometry was performed to attempt to recover these false stars. The test was carried out 100 times for each wavelength. Dotted lines mark the 50% completeness limits in the upper panels of Figure 4, which are listed in Table 2. The dashed line in Figure 4 marks the sensitivity limit at each bandpass, and shows that the photometry is the most incomplete at 3.6 and 4.5 µm, which is likely due to severe stellar crowding in the cluster core at these wavelengths. Photometry at 5.8 – 24 µm is 50% complete to within two magnitudes of the 3 sensitivity limits.
4 Discussion
4.1 The Color-Magnitude Diagrams
Figure A Spitzer Space Telescope Atlas of Centauri: The Stellar Population, Mass Loss, and the Intracluster Medium displays the optical (van Leeuwen et al., 2000), the near-IR (Sollima et al., 2004), and our mid-IR CMDs. The CMDs are corrected for reddening, as discussed in § 3, with values from Rieke & Lebofsky (1985), but the effect of reddening on the mid-IR magnitudes is minimal. The IRAC and MIPS CMDs shows very little structure aside from the RGB, and at longer wavelengths, a very broad, faint red plume. Mid-IR isochrones that include all known RGB/AGB properties, molecular bands, and dust considerations have yet to be developed. For reference, the brightest IRAC sources are labeled with large filled circles in Figure A Spitzer Space Telescope Atlas of Centauri: The Stellar Population, Mass Loss, and the Intracluster Medium, and the three brightest M-type stars are also labeled with their LEID numbers. Bright IRAC sources that are not labeled are not cluster members. Figure A Spitzer Space Telescope Atlas of Centauri: The Stellar Population, Mass Loss, and the Intracluster Medium shows the same CMDs with different source types labeled in color. Black points are confirmed cluster members (confirmed non-members are not plotted) and gray points, which are mostly located at the faint end of the RGB, do not have matches in the proper motion catalog.
Absorption in molecular bands may be responsible for some of the spread towards red colors on the RGB, but cannot cause colors as red as those of the dustiest stars. However, while many of the very red stars on the mid- to lower-RGB in Figure A Spitzer Space Telescope Atlas of Centauri: The Stellar Population, Mass Loss, and the Intracluster Medium may be dusty, it is very likely that some of the these sources are red due either to mismatches across bands, photometric errors, or contamination from cluster non-members.
The – [3.6] CMD clearly displays the RGB, AGB, and HB. Also visible as a sparsely populated branch to the red of the RGB is the RGB-a (magenta points). The plume of stars that falls intermediate to the RGB and the HB is mostly due to foreground contamination (Bellazzini et al., 2004), however the brighest cluster members in this plume ( 13, 1 – [3.6] 3) include post-AGB stars such as LEID 16018, 30020, 32015, 32029, and 43105. Note that while van Leeuwen et al. (2000) found that 16018 and 32029 are cluster non-members, van Loon et al. (2007) determined through optical spectroscopy that they do in fact belong to Cen. As such, their membership probabilities have been set to 100% in the Spitzer catalog.
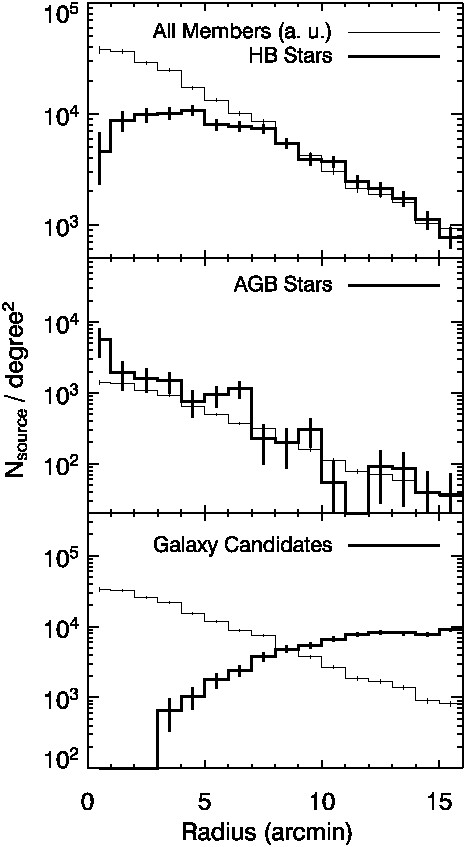
We identified HB stars (blue points) by their positions on the optical CMD (van Leeuwen et al., 2000). At IR wavelengths, the HB becomes indistinct from the RGB. The stellar density profile shown in Figure 5 shows a paucity of HB stars in the center of the cluster. The non-central peak of the HB density profile is explained by the dominance of the cluster luminosity by bright AGB and RGB stars in the most crowded regions.
RGB-a stars are those located on the red branch of the RGB in optical and near-IR CMDs (see Fig. 5 of Sollima et al., 2004). The offset of the RGB-a from the main RGB in optical and near-IR CMDs has been attributed to a metallicity difference between the RGB-a and the regular RGB (Lee et al., 1999; Pancino et al., 2000, 2002; Origlia et al., 2003). Except for a slight blue excess in the [3.6] – [4.5] colors, no metallicity separation is evident in the Spitzer CMDs.
4.2 The Asymptotic and Red Giant Branches
Inspection of the luminosity functions (Fig. 4) suggests that the stellar count begins to decrease at an accelerated rate near an absolute magnitude of 5 at each wavelength. We chose this magnitude as the divide at all Spitzer wavelengths between mass-losing AGB candidates and the rest of the stellar population. We identify 75 mass-losing AGB candidates, several of which have a red excess, although mass-loss can occur even without a dusty circumstellar envelope (McDonald & van Loon, 2007). The AGB population is slightly more centrally concentrated than the total stellar population (Fig. 5), which is probably due to decreasing completeness of fainter sources towards the core.
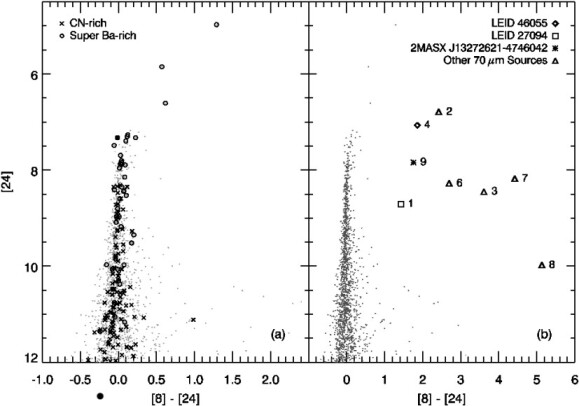
The locations on the CMD of stars that are identified as CN- and super-Ba-rich by optical spectroscopy (van Loon et al., 2007) are marked in Figure 6a. The term super-Ba-rich distinguishes stars with enhanced Ba through pre-enrichment from those that are enriched beyond this, probably due to internal mixing processes. The super-Ba-rich stars dominate the stars brighter than [24] 8.5, supporting the suggestion by van Loon et al. (2007) that these stars are enriched in Barium due to third-dredge up, and therefore delineate the thermal pulsating AGB. The super-Ba-rich stars may also be enriched in carbon, but not so much as to warrant their classification as genuine carbon stars.
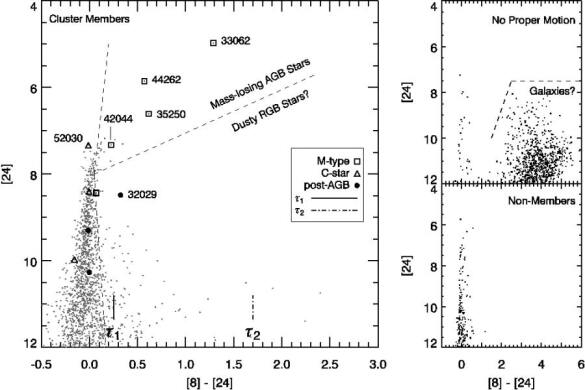
Figure 7 shows the [8] – [24] CMD for cluster members, non-members, and sources without proper motion measurements. Sources affected by blending at 24 µm are not plotted. The location on the CMD of the majority of sources without proper motion measurements suggests that most are likely galaxies. Stars brighter than [24] 10 with [8] – [24] 0.1 likely harbor dust, while sources fainter than [24] 10 are dusty if [8] – [24] 0.2. Also marked in Figure 7 and listed in Table 4 are 16 stars of interest, identified by van Loon et al. (2007) as six M-type stars (open squares), five carbon stars that show C2 bands (open triangles), and five post-AGB stars (closed circles), including Fehrenbach’s star (Fehrenbach & Duflot, 1962) near [24] = 9.25.
van Loon et al. (2007) obtained optical spectra for five of the extremely red faint cluster members ([24] 10 and [8] – [24] 0.8); these stars range from [Fe/H] 1.5 to [Fe/H] 2, and two of the stars are abnormally hot ( 7000 K). The remaining three stars appear to be normal RGB stars. Visual inspection suggests that none of these five sources are affected by blending at 24 µm, however, it is possible that HB stars or RGB stars that have little or no emission at 24 µm are spatially coincident with background galaxies, causing them to appear to have red colors. This may also be the case for the other 10 faint, extremely red stars that are matched to cluster members.
Spitzer studies of GCs that do not have proper motion or radial velocity unambiguous confirmation of membership will suffer from contamination from red field stars mistaken for dusty cluster stars. Many of the bright 24 µm sources in our images are field stars, including a variable M-type star with a period of 509 days (LEID 34041). Proper motion measurements allowed us to identify almost all bright and red cluster members in Figure 7 against field stars, with only one bright star remaining for which no proper motion information is available. This bright source is most likely LEID 55017, which is a confirmed cluster non-member. The proper motion of LEID 55017 is large enough that the Spitzer coordinates are 4″ different from the van Leeuwen et al. (2000) coordinates.
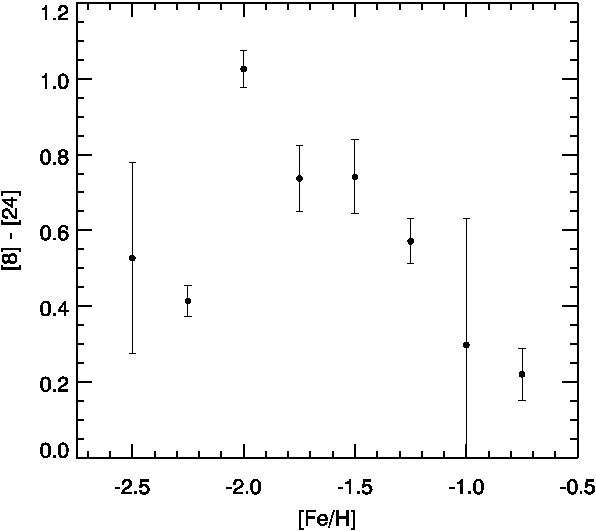
It is expected that metal-rich stars form more dust in their winds than their low metallicity counterparts due to the higher abundance of condensable material. We have metallicity information from van Loon et al. (2007) for 32 of the 140 dusty stars in Figure 7. The brightest potentially dusty stars in the cluster range 2.25 [Fe/H] 1.25, i.e. nearly the entire breadth of metallicities encountered in Cen. In fact, of this small sample, the reddest stars have [Fe/H] 1.5 (Fig. 8) and two of the three brightest dusty stars (LEID 33062, 44262, 35250) have [Fe/H] -2.0, which suggests that dust production is not inhibited at these low metallicities.
4.3 Mass-Loss Rates
Since mass-loss rates () scale directly with dust optical depth (), all dusty stars have the potential to drive a wind (Ivezić & Elitzur, 1995). However, the value for derived from the optical depth also scales with the square root of the luminosity, so the brightest stars contribute a larger fraction of the cluster’s cumulative mass-loss rate than the fainter stars. Of the 140 red cluster members that remain after eliminating blends and non-members such as LEID 34041, which, as a bright M-type star with a period of 509 days, would dominate the cumulative mass-loss rate of the cluster if included. We used the AGB models computed by Groenewegen (2006) to determine the mass-loss rates corresponding to the color of the red member stars with 0.15 [8] – [24] 3.1. Luminosities were determined by scaling to the Groenewegen (2006) mass-loss tracks for AGB stars with temperatures of 3297 and 3850 K and with silicate and AlOx dust compositions, however differing bolometric corrections for stars with different temperatures and metallicities are not taken into account. For reference, the colors corresponding to two sample optical depths are marked on the CMD in Figure 7 and listed in Table 5. The final mass-loss rates () were scaled according to the following relationship:
| (1) |
where is the unscaled mass-loss rate from Groenewegen (2006), is the wind velocity, is the dust-to-gas mass ratio ( 0.005 at solar metallicity), and is the luminosity. Following van Loon (2000) and Marshall et al. (2004), the velocity scales approximately as:
| (2) |
From equation (2), the wind velocities of even the strongest mass-losing stars in Cen are slow (). Winds this slow may have difficulty driving a massive wind; it is possible that the wind is driven by some other mechanism and that the dust is a by-product. McDonald & van Loon (2007) suggest wind velocities of 5 – 10 km s-1 for AGB stars in GCs; if wind velocities are 5 higher, the mass-loss rates would increase by the same factor.
The Groenewegen (2006) models were calculated assuming spherical circumstellar dust shells, a constant mass-loss rate, and photospheres with solar metallicity. The last of these assumptions affects the stellar colors, which we used to determine the mass-loss rates. While we do take metallicity into account in the dust-to-gas ratio, increasing the mass-loss rates by a factor of seven, the metallicity dependence is not yet well established. The mass-loss rates computed using the Groenewegen (2006) models should therefore be considered a rough estimate. Bolometric luminosities of the Cen sources can be estimated through fitting the SED or spectrum of each star, facilitating a better estimate of the real mass-loss rates (I. McDonald et al., in preparation).
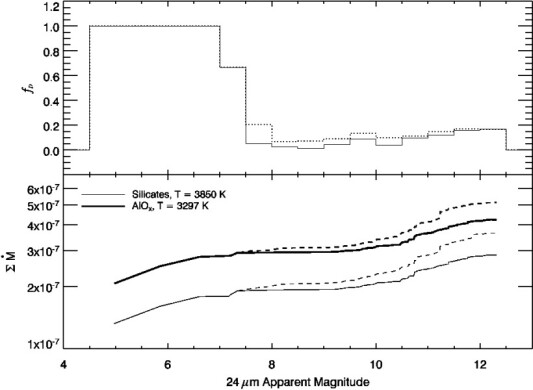
Assuming that all stars have the metallicity that comprises the majority of the population and that scales with metallicity (van Loon, 2000, 2006, = –1.7, 10-4), we find that the three brightest M-type stars (Fig. 7) contribute a total of (gas dust) 1.8 – 2.8 10-7 yr-1, depending on the temperature and dust composition. The combined mass-loss rate of these three stars is an order of magnitude less than the mass-loss rate measured for V1 in 47 Tuc with IR spectroscopy (van Loon et al., 2006a), suggesting either that we have underestimated the mass-loss rates or that the variance of with metallicity is not a linear relation. Figure 9 and Table 6 shows that the cumulative mass-loss rate () of the 140 dusty stars together is less than twice the combined mass-loss rate of the three brightest M-type stars (LEID 33062, 44262, 35250). However, the fainter stars may be contributing more to the total mass-loss rate of the cluster if their dust-to-gas ratios are smaller.
To compare to the number of dusty stars present at each magnitude, we also plot the percentage of stars that are dusty () in Figure 9, binned by half magnitudes. remains roughly constant at 10% – 20% for [24] 9.5, causing the cumulative mass-loss rate to slowly increase at [24] 8. The increase in at [24] 11 is due to the very red sources ([8] – [24] 1.0) at these magnitudes. It is possible that many of the faint stars with red excess are not truly dusty (see §4.2). Since the cumulative mass-loss rate does not increase much over more than 2 magnitudes on the upper-RGB, it is unlikely that even fainter stars, which are generally warmer and do not pulsate strongly, contribute significantly to the dust-traced mass loss.
In a Spitzer study of 47 Tuc, Origlia et al. (2007) find that red stars occupy the CMD from the tRGB down to the HB and conclude that mass-loss is occurring at a significant rate along the entire RGB. However, at least 25% of the red sources in Cen have proven to have red colors because of blending effects at 24 µm (see § 3.2). Figure 9 shows that these blended sources can increase the cumulative mass-loss rate by up to 17%. In more crowded clusters like 47 Tuc, blending will affect an even larger percentage of red stars. Indeed, it is evident in Figure 2 of Origlia et al. (2007) that the CMD covering the central region of the cluster is affected by blending, since the many red sources claimed to exist between –2 0 have no equivalent in the CMD for the outer regions of the cluster. By eliminating these blends, we find that significant dusty mass loss occurs only at or near the tRGB.
Two previous mid-IR studies of GCs detected several very red, faint sources (Boyer et al., 2006; Ita et al., 2007). Both studies offer the possibility that these sources are dusty, mass-losing stars. While the nature of the sources has yet to be established, we find that after weeding out pesky field stars and background galaxies via proper motion information, very few of the confirmed Cen cluster members reside in this region of the CMD (Fig. 7), and significant dusty mass loss occurs only near the very tip of the RGB or AGB. In the case of NGC 362 (Ita et al., 2007), these faint, red sources may be background AGB stars belonging to the Small Magellanic Cloud, however in other GCs, these sources are more likely to be background galaxies.
If the current population in Cen is representative of the cluster’s population at all times, then the cluster has lost at least 1 – 2 of material (1 – 2 10 of dust) through stellar mass loss since its last Galactic plane crossing, which occurred more than 3.4 106 years ago (Tayler & Wood, 1975). van Loon et al. (2007) find a few post-AGB stars in Cen. Assuming a post-AGB lifetime of several yr and 0.1 of mass shed on the AGB, this could have produced up to 100 of lost mass. This comparison suggests that either these AGB stars lose on average less than 0.1 on the AGB, or that our mass-loss rate estimates are too low (for instance because the wind velocity is actually higher and/or the dust-to-gas ratio is lower than assumed here).
4.4 Background Galaxies
Background galaxies (green points in Fig. A Spitzer Space Telescope Atlas of Centauri: The Stellar Population, Mass Loss, and the Intracluster Medium) dominate the faint, red plume in the [3.6] – [8] CMD due to strong PAH emission at 8 µm (Blum et al., 2006; Bolatto et al., 2007). The coverage overlap between the 3.6 µm and 8 µm mosaics is 0.3 deg2, yielding a density of 2823 galaxies/deg2. This number increases to 3174 galaxies/deg2 if we consider undetected galaxies behind the cluster center (an area of 11 arcmin2, see Fig. 5). The red and faint region of the [3.6] – [24] CMD is also heavily populated with sources. If these 24 µm sources are all background galaxies, the galaxy density derived from this CMD is 2681 galaxies/deg2, which increases to 3015 galaxies/deg2 when considering sources located behind the cluster core. When including all sources with very red colors and faint magnitudes at all wavelengths, we find a total background galaxy density of 1 104 galaxies/deg2 (Fig. 5).
To determine the expected background galaxy density, we queried the SWIRE extragalactic database (Lonsdale et al., 2004) for sources located in the same region of the CMD as our galaxy candidates. In the six SWIRE fields, there are 900 – 2200 sources/deg2 in the [3.6] – [8] CMD and 900 – 1900 sources/deg2 in the [3.6] – [24] CMD. Our images are slightly more sensitive than the SWIRE data, but when comparing identical regions of the CMD, the galaxy densities in our CMDs fall within the range of the SWIRE galaxy densities, strengthening the argument that the sources we have identified as galaxy candidates are indeed background galaxies. It is also possible that the faintest sources in the red [3.6] – [8] and [3.6] – [24] plumes are either stellar blends or regular RGB stars whose fluxes are poorly determined due to their proximity to the completion limit, causing them to have a non-zero color.
4.5 70 µm Sources
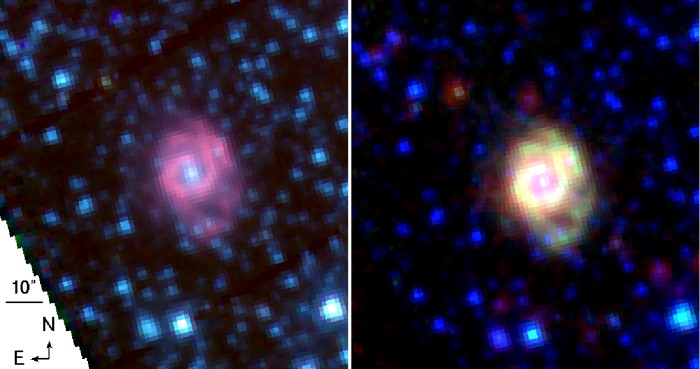
Nine point-sources appear in the 70 µm mosaic, although none are the red, possibly dusty cluster members discussed in § 4.2 and § 4.3. One of these sources is resolved at the shorter wavelengths and appears to be a background spiral galaxy (2MASX J13272621–4746042; Fig. 10). This galaxy shows a ring of PAH emission at 8 µm that is reminiscent of the famous star-forming “Ring of Fire”, seen in M31 (Barmby et al., 2006; Gordon et al., 2006). Two of 70 µm sources are near confirmed cluster members (van Leeuwen et al., 2000; van Loon et al., 2007); source 1 is 3.7″ from LEID 27094, a distance that is within the half-width, half-maximum of the 70 µm PSF, and source 4 is 1.0″ from LEID 46055. Optical spectra for both LEID stars are reported by van Loon et al. (2007) and reveal that both stars have [Fe/H] –1.25 and 5000 K. LEID 27094 is CH strong and appears to be a normal RGB star, while LEID 46055 is CH and CN strong, and is Ba-rich, suggesting that it may be enriched in carbon from third dredge-up. Despite the proximity in position between these two LEID sources and sources 1 and 4, the LEID sources may be associated with warmer stars that appear in the IRAC mosaics as secondary stars blended with sources 1 and 4, and not with the corresponding 70 µm source. The remaining six 70 µm sources are not near any known cluster members.
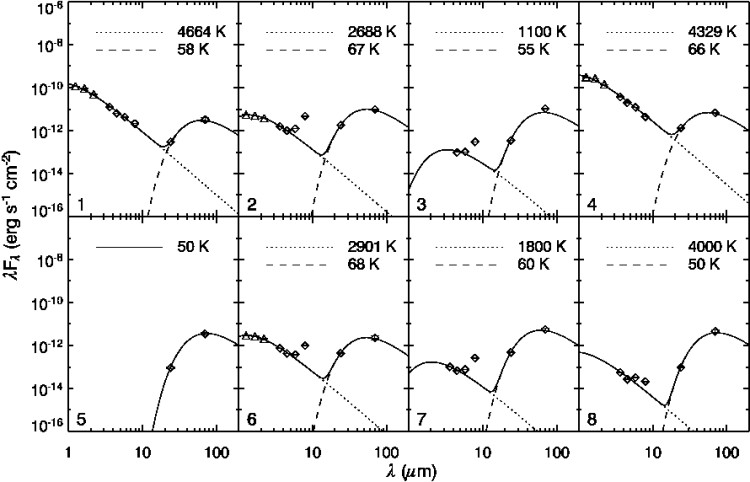
We measured 70 µm fluxes for the eight point-sources with the aperture feature of Imexamine in version 2.12.2 of IRAF333IRAF is distributed by the National Optical Astronomy Observatories, which are operated by the Association of Universities for Research in Astronomy, Inc., under cooperative agreement with the National Science Foundation.. Aperture radii were initially set to 3 the FWHM of each source and three iterations were performed to find the optimal radius. The median of the background was subtracted from the flux and the appropriate MIPS aperture correction was applied. Fluxes are listed in Table 7 and the 3.6 to 70 µm SEDs are shown in Figure 11. Aside from sources 1 and 4, all of the sources appear to be unaffected by blends at all IRAC wavelengths.
For each 70 µm source, we performed a reduced- fit of a two-component blackbody curve that include 2MASS fluxes to better define the warmer blackbody. Source 8 falls off of our IRAC images, so its IRAC fluxes were determined by using an earlier epoch of data from the Gehrz Guaranteed Time Observing Program with Spitzer (PID 132) with data reduction identical to that described in § 2. The fits take the photometric errors into account. Sources 3, 5, 7, and 8 are underconstrained for this fitting technique when we exclude the anomalously bright 5.8 and 8 µm points from the fit; for these sources, we decreased the number of fitting parameters by fixing the temperatures to 1000 to 14,000 K and 40 to 90 K for the blue and red blackbodies, respectively, and choosing the temperatures that gave the best reduced-. The IRAC and MIPS color corrections were applied by iterating the fit until the corrections remained constant within 1%. While a dual-blackbody fits well with most of the 70 µm sources, we point out that the dust around these sources may be emitting over a range of temperatures.
Better fits were obtained by excluding the 8 µm point, which is above the blue blackbody for all eight sources. To a lesser degree, the 5.8 µm point is also systematically brighter than the blue blackbody component, suggesting that there is a range of dust temperatures causing warm dust to radiate above the blackbody at 5.8 µm and perhaps also at 8 µm. However, the 5.8 µm points are still included in the fit for source 3 in order to keep the fit properly constrained. The resulting blackbodies are overplotted in Figure 11 and fitting results are shown in Table 8.
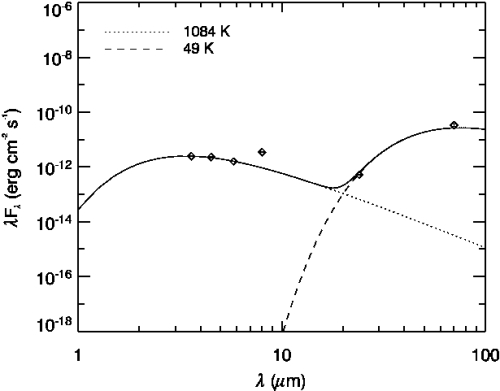
The emission features at 5.8 and 8 µm, where PAH emission dominates, and the relatively flat SEDs of the non-blended sources suggests that all or most of these sources are background galaxies (for examples of Spitzer galaxy SEDs, see Dale et al., 2005). For comparison, an SED of the resolved spiral galaxy is shown in Figure 12. We determined the flux by placing square apertures of roughly 45″ 50″ on the galaxy and subtracting the median background. As with source 8, the galaxy falls off of our IRAC coverage, so data from PID 132 is used to determine its IRAC fluxes. This SED is similar to the other eight, except that it lacks the slight excess emission at 5.8 µm that many of the other sources exhibit.
The cold dust component of the blackbody fits for the eight unidentified sources range in temperature from 50 K to 68 K – a temperature commensurate with these objects being post-thermal pulse stars, stars suffering from episodic mass loss on the RGB, or post-AGB stars. However, the temperatures of all eight sources are also consistent with dust in star forming regions that dominate the galactic far-IR emission. At a temperature of 48.8 0.8 K, the cold blackbody component of the resolved galaxy is colder than the other eight 70 µm sources, which may suggest that the warmer sources are of a different nature. Although, with so few constraints in the blackbody fits, one might argue that the temperatures of all nine sources are consistent with each other.
If the 70 µm sources are dusty AGB stars, the flux at 8 µm may be included in the wing of a broad emission feature centered at 9.5 µm due to amorphous silicate grains that overlaps with the IRAC 8 µm bandpass. The 9.5 µm feature is also detected in the 8 – 13 µm spectrum of a particularly red, large-amplitude variable star in 47 Tuc (van Loon et al., 2006a; Lebzelter et al., 2006). The positions of the 70 µm sources on the [8] – [24] CMD are marked in Figure 6b. All sources lie redward of the RGB and near the brighter end of the CMD. However, the 3.6 and 4.5 µm magnitudes of sources 2, 3, 6, 7, and 8 (triangles) are fainter than 12.5 magnitudes, suggesting that these sources are indeed galaxies. Sources 1 and 4 lie on the brighter end of the RGB, but they are blended with the aforementioned LEID sources at the shorter wavelengths, which will cause an artificial increase in brightness. While near-IR redshift measurements or radial velocity measurements would conclusively determine the nature of these sources, analysis of the Spitzer data strongly suggests that they are all background galaxies.
4.6 The Intracluster Medium
Despite ongoing stellar mass loss in Cen, there are no known detections of any phase of ICM material in the cluster. The wind velocities discussed in § 4.3 are 10 km s-1 for metal-poor, dust-driven winds from low-mass AGB stars. Such velocities are much less than the escape velocity of Cen at 1 rhm ( 44 km s-1; Gnedin et al., 2002), but if the dust and gas are not well coupled, then the dust velocity may be higher. RGB and AGB wind velocities measured from H emission wings can be as high as the cluster escape velocity, however it is likely that H wings are due to pulsation and/or chromospheric activity instead of the circumstellar shells of stars. Core velocities originate in the chromospheres and are typically lower ( 15 km s-1), but there have been at least two observations of high velocities from the IR He I line (Dupree et al., 1992; Smith et al., 2004).
If the winds are indeed slow and the total mass-loss rate discussed in § 4.3 has been constant since the last Galactic plane crossing, then, barring any ICM removal mechanisms and assuming that all stars belong to the population with the lowest metallicity, 1 – 2 of material should have accumulated in the cluster. This mass estimate includes only dusty mass loss on the RGB and AGB; mass loss from non-dusty stars on the RGB and from stars that lose significant mass in such a brief period of time that it may easily have been missed (e.g., associated with the formation of a planetary nebula) may cause this estimate to increase by a factor of two or three. Based on the total amount of AGB mass loss, which is the only source of dust, we expect a dust mass of = 1 – 2 10-4 of dust. Since the estimate of the time since the last Galactic plane crossing is a lower limit ( 3.4 106 yr; Tayler & Wood, 1975), the predicted ICM dust mass may be higher.
The average 1 sensitivity of our 24 µm mosaic is 2.5 10-2 MJy/str. Following Evans et al. (2003), the relationship between the dust mass and the expected IR flux density is:
| (3) |
where is the distance to Cen, is the dust absorption coefficient (cm2 g-1), is the dust temperature (K), and ) is the Planck function in cgs units. Assuming a standard Mathis-Rumpl-Nordsieck dust distribution (Mathis et al., 1977) and an ISM-type dust composition of graphite and silicate grains, is taken to be 56 11 cm2 g-1 (Ossenkopf & Henning, 1994), although this value could be up to a decade larger. A cloud with 1 – 2 10-4 of dust and an equilibrium temperature of 70 K would yield a 24 µm flux density of 23 – 45 mJy. With our sensitivity, we are capable of detecting 23 mJy to the 3 level in our 24 µm mosaic if all of the dust is uniformly distributed within an area of 2′ 2′, or a radius of A small, centrally located cloud at the 3 level would be detectable over the background stellar emission in the 24 and 70 µm mosaics. However, unlike in M15 (Boyer et al., 2006), our MIPS images do not show a large dust cloud located at the center of Cen.
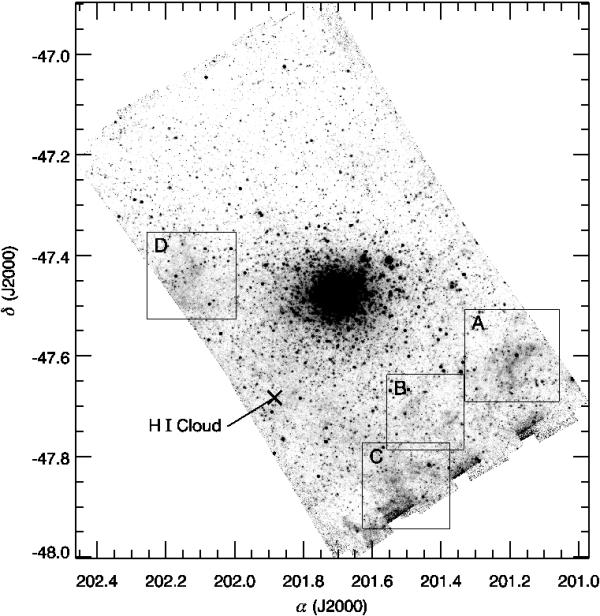
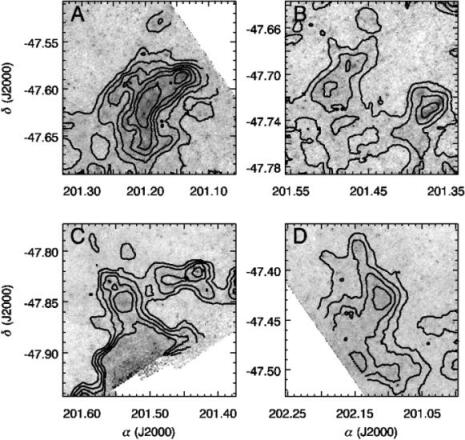
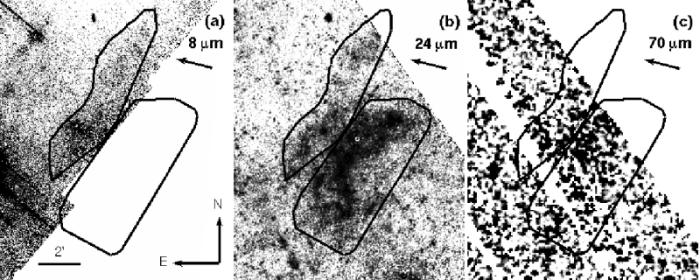
While there is no central ICM dust cloud in Cen, there is faint, diffuse emission covering nearly the entire 24 µm image to the south of the cluster center, including several small regions of concentrated extended emission on the outskirts of the cluster that appear near the 3 limit (Figs. 13 and 14). Feature A (Fig. 15) appears at 8, 24, and 70 µm, features B and C appear at 8 and 24 µm, and feature D appears only at 24 µm, as the coverage is not identical across all bands. The probability that these features are artefacts is quite low as they each appear in more than 95% of the BCD images at various array positions.
It is uncertain whether features A – D are associated with the cluster or are part of the foreground. The morphology of feature A provides the strongest evidence for cluster association, as the warmer 8 µm emission lies closer to the cluster center than the cooler 24 and 70 µm emission (Figs. 14 and 15). Moreover, the warmer portion is approximately perpendicular to the direction towards the cluster center. This configuration suggests the possibilities that either a warm wind is pushing the ICM out of the cluster or that the 8 µm arc is optically thick and is being irradiated by the cluster’s stellar radiation field with cold dust in its shadow. A determination of the dust temperature would aid in ascertaining the origin of feature A. Unfortunately, only very small portions of feature A are present in the Spitzer mosaics at all wavebands (Fig. 15), and the limited coverage makes it impossible to reliably determine the temperature of the dust from an SED.
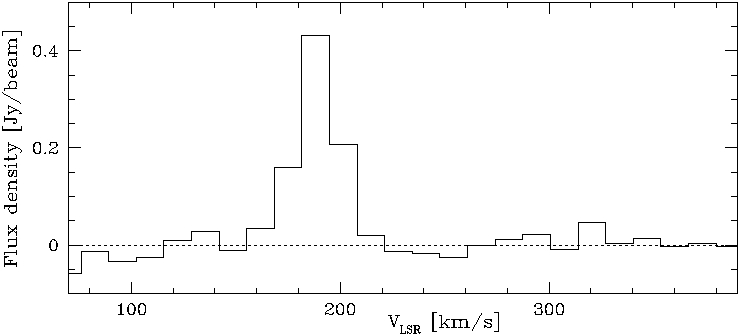
The case for an ICM origin for features A – D is strengthened by our discovery of an unreported H I cloud near the velocity of Cen (Fig. 16) in public data from the H I Parkes All-Sky Survey (HIPASS; Barnes et al., 2001), which may have also been detected by Smith et al. (1990) in earlier observations. The center of this H I feature is not spatially coincident with any of the dust features, but rather lies 15′ to the southeast of the cluster center, just on the edge of the coverage of our MIPS mosaic (Fig. 13). The velocity of the H I feature ( 190 km s-1) suggests a connection to Cen ( 230 km s-1). Smith et al. (1990) argue instead that, because the feature is detected on only one side of the cluster, it is more likely to be a small high-velocity cloud that is part of the Magellanic Stream (Bajaja et al., 1985, = 200 km s-1). While an association between the H I feature and the Magellanic Stream is a possibility, similar offset H I clouds have been discovered in larger dSph galaxies (Bouchard et al., 2003, 2006; Young et al., 2006), so finding a cloud that is associated with Cen may not come as a surprise. In M15, dust and H I trace each other in the ICM (van Loon et al., 2006b). Therefore, if the H I feature is indeed associated with Cen, it is reasonable to assume that dust is also present. Since both the dust and the H I feature are located well outside 1 , it is possible that we are seeing the ICM in the process of escaping the cluster.
5 Conclusions
Our Spitzer multi-wavelength and dual-epoch study of the most massive Galactic globular cluster, Cen, and the resulting point-source catalog provide the most complete mid- to far-IR atlas of any GC to date. Despite Cen’s rather unusual stellar population, the Spitzer CMDs show little structure beyond the division between the RGB stars belonging to the cluster and background galaxies. The HB stars and RGB-a stars are not separated from the RGB, except for a slightly blue [3.6] – [4.5] color for the RGB-a.
Nine sources are detected at 70 µm, one of which is a resolved spiral galaxy, and two of which are spatially coincident with optical sources that are known cluster members. If emission at 5.8 and 8 µm in the SEDs of the eight point sources is PAH emission, then these sources are background galaxies.
By cross-referencing with a catalog of optical spectra (van Loon et al., 2007), we confirm that super-Ba-rich stars delineate the tip of the AGB, likely due to a third dredge-up, and find that three M-type stars not only have strong red excess, but are brighter than the 24 µm tRGB. Attributing the excess IR luminosity to dust suggests that the three bright M-type stars dominate the cluster’s cumulative mass-loss rate (gas dust) of 2.9 – 4.2 10-7 yr-1. If the cluster mass-loss rate has remained constant since the last Galactic plane crossing, then the cluster has lost at least 1 – 2 of dust-traced material over the last 3.4 106 years.
The dusty stars in our sample range over 1.5 dex in metallicity, suggesting that dust production is not inhibited even in stars with very low metal contents. In addition, our results show that, in Cen, significant dusty mass loss occurs near the very tip of the RGB or AGB, concentrated in only a few individual stars, with little evidence for such mass loss lower on the RGB.
While our images are sensitive enough to detect the amount of dust expected in Cen based on the current mass-loss rate, no obvious ICM dust clouds are apparent in the cluster center at 24 or 70 µm. We do find several regions of faint extended 24 µm emission on the outskirts of the cluster, but it is unclear whether these clouds are associated with the ICM or are in the foreground. If the dust features are associated with the cluster, they are well outside the cluster half-mass radius, and could therefore be ICM material that is in the process of escaping the cluster.
References
- Bajaja et al. (1985) Bajaja, E., Cappa de Nicolau, C. E., Cersosimo, J. C., Martin, M. C., Loiseau, N., Morras, R., Olano, C. A., & Poeppel, W. G. L. 1985, ApJS, 58, 143
- Barmby et al. (2006) Barmby, P., et al. 2006, ApJ, 650, L45
- Barnes et al. (2001) Barnes, D. G., et al. 2001, MNRAS, 322, 486
- Bellazzini et al. (2004) Bellazzini, M., Ferraro, F. R., Sollima, A., Pancino, E., & Origlia, L. 2004, A&A, 424, 199
- Blum et al. (2006) Blum, R. D., et al. 2006, AJ, 132, 2034
- Bolatto et al. (2007) Bolatto, A. D., et al. 2007, ApJ, 655, 212
- Bouchard et al. (2003) Bouchard, A., Carignan, C., & Mashchenko, S. 2003, AJ, 126, 1295
- Bouchard et al. (2006) Bouchard, A., Carignan, C., & Staveley-Smith, L. 2006, AJ, 131, 2913
- Boyer et al. (2006) Boyer, M. L., Woodward, C. E., van Loon, J. Th., Gordon, K. D., Evans, A., Gehrz, R. D., Helton, L. A., & Polomski, E. F. 2006, AJ, 132, 1415
- Cacciari et al. (2004) Cacciari, C. et al. 2004, A&A, 413, 343
- Chiosi & Maeder (1986) Chiosi, C., & Maeder, A. 1986, ARA&A, 24, 329
- Dale et al. (2005) Dale, D. A., et al. 2005, ApJ, 633, 857
- Del Principe et al. (2006) Del Principe, M., et al. 2006, ApJ, 652, 362
- Dupree et al. (1984) Dupree, A. K., Hartmann, L., & Avrett, E.H. 1984, ApJ, 281, L37
- Dupree et al. (1992) Dupree, A. K., Sasselov, D. D., & Lester, J. B. 1992, ApJ, 387, L85
- Engelbracht et al. (2007) Engelbracht, C. W., et al. 2007, PASP, submitted
- Evans et al. (2003) Evans, A., Stickel, M., van Loon, J. Th., Eyres, S. P. S., Hopwood, M. E. L., & Penny, A. J. 2003, A&A, 408, L9
- Fazio et al. (2004) Fazio, G. G., et al. 2004, ApJS, 154, 10
- Fehrenbach & Duflot (1962) Fehrenbach, C. H. & Duflot, M. 1962, ESO Comm., No. 2
- Freeman (1993) Freeman, K. C. 1993, The Globular Cluster-Galaxy Connection, 48, 608
- Gail & Sedlmayr (1987) Gail, H.-P., & Sedlmayr, E. 1987, A&A, 177, 186
- Gauger et al. (1990) Gauger, A., Sedlmayr, E., & Gail, H.-P. 1990, A&A, 235, 345
- Gehrz (1989) Gehrz, R. D. 1989, in: Interstellar Dust. Eds. L. J. Allamandola & A. G. G. M. Tielens. IAUS 135, Kluwer Academic Publishers, Dordrecht, p.445
- Gehrz & Woolf (1971) Gehrz, R. D., & Woolf, N. J. 1971, ApJ, 165, 285
- Gehrz et al. (2007) Gehrz, R. D., et al. 2007, Review of Scientific Instruments, 78, 011302
- Gnedin et al. (2002) Gnedin, O. Y., Zhao, H., Pringle, J. E., Fall, S. M., Livio, M., & Meylan, G. 2002, ApJ, 568, L23
- Gordon et al. (2006) Gordon, K. D., et al. 2006, ApJ, 638, L87
- Gordon et al. (2007) Gordon, K. D., et al. 2007, PASP, in press
- Gould & Salpeter (1963) Gould, R. J., & Salpeter, E. E. 1963, ApJ, 138, 393
- Gratton et al. (2004) Gratton, R., Sneden, C., & Carretta, E. 2004, ARA&A, 42, 385
- Groenewegen (2006) Groenewegen, M. A. T. 2006, A&A, 448, 181
- Harris (1996) Harris, W. E. 1996, AJ, 112, 1487
- Höfner & Dorfi (1997) Höfner, S., & Dorfi, E. A. 1997, A&A, 319, 648
- Iben & Renzini (1983) Iben, I. Jr., & Renzini, A. 1983, ARA&A, 21, 271
- Indebetouw et al. (2005) Indebetouw, R., et al. 2005, ApJ, 619, 931
- Ita et al. (2007) Ita, Y., et al. 2007, PASJ, in press
- Ivezić & Elitzur (1995) Ivezić, Ž., & Elitzur, M. 1995, ApJ, 445, 415
- Jackson et al. (2007) Jackson, D. C., Skillman, E. D., Gehrz, R. D., Polomski, E., & Woodward, C. E. 2007, ApJ, 656, 818
- Jura & Morris (1985) Jura, M., & Morris, M. 1985, ApJ, 292, 487
- Lebzelter et al. (2006) Lebzelter, Th., Posch, Th., Hinkle, K., Wood, P. R., & Bouwman, J. 2006, ApJ, 653, L145
- Lee et al. (1999) Lee, Y.-W., Joo, J.-M., Sohn, Y.-J., Rey, S.-C., Lee, H.-C., & Walker, A. R. 1999, Nature, 402, 55
- Leinert et al. (2002) Leinert, C., Ábrahám, P., Acosta-Pulido, J., Lemke, D., & Siebenmorgen, R. 2002, A&A, 393, 1073
- Lonsdale et al. (2004) Lonsdale, C., et al. 2004, ApJS, 154, 54
- Lub (2002) Lub, J. 2002, Omega Centauri, A Unique Window into Astrophysics, 265, 95
- Makovoz & Marleau (2005) Makovoz, D., & Marleau, F. R. 2005, PASP, 117, 1113
- Marshall et al. (2004) Marshall, J. R., van Loon, J. Th., Matsuura, M., Wood, P. R., Zijlstra, A. A. & Whitelock, P. A. 2004, MNRAS, 355, 1348
- Mathis et al. (1977) Mathis, J. S., Rumpl, W., & Nordsieck, K. H. 1977, ApJ, 217, 425
- McDonald & van Loon (2007) McDonald, I., & van Loon, J. Th. 2007, A&A, 476, 1261
- Meszaros et al. (2008) Meszaros, S., Dupree, A. K., & Szentgyorgyi, A. 2008, AJ, in press
- Norris (1996) Norris, J. E. 1996, ApJ, 462, 241
- Norris (2004) Norris, J. E. 2004, ApJ, 612, L25
- Origlia et al. (2003) Origlia, L., Ferraro, F. R., Bellazzini, M., & Pancino, E. 2003, ApJ, 591, 9160
- Origlia et al. (2002) Origlia, L., Ferraro, F. R., Fusi Pecci, F., & Rood, R. T. 2002, ApJ, 571, 458
- Origlia et al. (2007) Origlia, L., Rood, R. T., Fabbri, S., Ferraro, F. R., Fusi Pecci, F., & Rich, R. M. 2007, ApJ, 667, L85
- Ossenkopf & Henning (1994) Ossenkopf, V., & Henning, Th. 1994, A&A, 291, 943
- Pancino et al. (2000) Pancino, E., Ferraro, F. R., Bellazzini, M., Piotto, G., & Zoccali, M. 2000, ApJ, 534, L83
- Pancino et al. (2002) Pancino, E., Pasquini, L., Hill, V., Ferraro, F. R., & Bellazzini, M. 2002, ApJ, 568, L101
- Ramdani & Jorissen (2001) Ramdani A., & Jorissen, A. 2001, A&A, 372, 85
- Reach et al. (2005) Reach, W. T., et al. 2005, PASP, 117, 978
- Rieke & Lebofsky (1985) Rieke, G. H., Lebofsky, M. J. 1985, ApJ, 288, 618
- Rieke et al. (2004) Rieke, G. H., et al. 2004, ApJS, 154, 25
- Rood (1973) Rood, R. T. 1973, ApJ, 184, 815
- Salpeter (1974) Salpeter, E. E. 1974, ApJ, 193, 579
- Smith et al. (2004) Smith, G. H., Dupree, A. K., & Strader, J. 2004, PASP, 116, 819
- Smith et al. (1990) Smith, G. H., Wood, P. R., Faulkner, D. J., & Wright, A. E. 1990, ApJ, 353, 168
- Smith et al. (2000) Smith, V. V., Suntzeff, N. B., Cunha, K., Gallino, R., Busso, M., Lambert, D. L., & Straniero, O. 2000, AJ, 119, 1239
- Sollima et al. (2004) Sollima, A., Ferraro, F. R., Origlia, L., Pancino, E., & Bellazzini, M. 2004, A&A, 420, 173
- Sollima et al. (2004) Sollima, A., Ferraro, F. R., Origlia, L., Pancino, E., & Bellazzini, M. 2004, VizieR Online Data Catalog, 342, 173
- Sollima et al. (2005) Sollima, A., Pancino, E., Ferraro, F. R., Bellazzini, M., Straniero, O., & Pasquini, L. 2005, ApJ, 634, 332
- Spitzer Science Center (2006a) Spitzer Science Center. 2006a, Infrared Array Camera Data Handbook (Pasadena: SSC), http://ssc.spitzer.caltech.edu/irac/dh/
- Spitzer Science Center (2006b) Spitzer Science Center. 2006b, Multiband Imaging Photometer for Spitzer (MIPS) Data Handbook (Pasadena: SSC), http://ssc.spitzer.caltech.edu/mips/dh/
- Stanford et al. (2006) Stanford, L. M., Da Costa, G. S., Norris, J. E., & Cannon, R. D. 2006, ApJ, 647, 1075
- Stetson (1987) Stetson, P. B. 1987, PASP, 99, 191
- Tayler & Wood (1975) Tayler, R. J., & Wood, P. R. 1975, MNRAS, 171, 467
- Valenti et al. (2007) Valenti, E., Ferraro, F. R., & Origlia, L. 2007, AJ, 133, 1287
- van de Ven et al. (2006) van de Ven, G., van den Bosch, R. C. E., Verolme, E. K., & de Zeeuw, P. T. 2006, A&A, 445, 513
- van Leeuwen et al. (2000) van Leeuwen, F., Le Poole, R. S., Reijns, R. A., Freeman, K. C., & de Zeeuw, P. T. 2000, A&A, 360, 472
- van Loon (2000) van Loon, J. Th. 2000, A&A, 354, 125
- van Loon (2006) van Loon, J. Th. 2006, in: Stellar Evolution at Low Metallicity: Mass Loss, Explosions, Cosmology. Eds. H. J. G. L. M. Lamers, N. Langer, T. Nugis & K. Annuk. ASP Conf.Ser. 353, p.211
- van Loon et al. (1999) van Loon, J. Th., Groenewegen, M. A. T., de Koter, A., Trams, N. R., Waters, L. B. F. M., Zijlstra, A. A., Whitelock, P. A., & Loup, C. 1999, A&A, 351, 559
- van Loon et al. (2005) van Loon, J. Th., Marshall, J. R., & Zijlstra, A. A. 2005, A&A, 442, 597
- van Loon & McDonald (2008) van Loon, J. Th., & McDonald, I. 2007, in: Mass loss from stars and the evolution of stellar clusters. Eds. A. de Koter, L. Smith & L. B. F. M. Waters. ASP Conf.Ser., in press
- van Loon et al. (2006a) van Loon, J. Th., McDonald, I., Oliveira, J. M., Evans, A., Boyer, M. L., Gehrz, R. D., Polomski, E., & Woodward, C., E. 2006a, A&A, 450, 339
- van Loon et al. (2006b) van Loon, J. Th., Stanimirović, S., Evans, A., & Muller, E. 2006b, MNRAS, 365, 1277
- van Loon et al. (2007) van Loon, J. Th., van Leeuwen, F., Smalley, B., Smith, A. W., Lyons, N. A., McDonald, I., & Boyer, M. L. 2007, MNRAS, 382, 1353
- Villanova et al. (2007) Villanova, S., et al. 2007, ApJ, 663, 296
- Werner et al. (2004) Werner, M. W., et al. 2004, ApJS, 154, 1
- Young et al. (2006) Young, L. M., Skillman, E. D., Weisz, D. R., & Dolphin, A. E. 2007, ApJ, 659, 331
- Zinnecker et al. (1988) Zinnecker, H., Keable, C. J., Dunlop, J. S., Cannon, R. D., & Griffiths, W. K. 1988, The Harlow-Shapley Symposium on Globular Cluster Systems in Galaxies, 126, 603

![[Uncaptioned image]](/html/0801.2172/assets/x3.jpg)
CMDs for Cen. Fluxes are corrected for reddening (; Lub, 2002). magnitudes are from van Leeuwen et al. (2000) and magnitudes are from Sollima et al. (2004). The solid lines mark where the photometry is 50% complete in the case of Spitzer or mark the detection limit from van Leeuwen et al. (2000) and Sollima et al. (2004). The brightest confirmed cluster members at IRAC wavelengths are marked with large filled circles in each panel to show their evolution over color-magnitude space (non-members remain small dots). The three most extreme M-type stars are labeled with their LEID numbers.
![[Uncaptioned image]](/html/0801.2172/assets/x4.jpg)
CMDs for Cen. Same as Figure A Spitzer Space Telescope Atlas of Centauri: The Stellar Population, Mass Loss, and the Intracluster Medium, with different source types plotted in colors. Black points are confirmed cluster members (van Leeuwen et al., 2000), gray points are not included in the van Leeuwen et al. (2000) proper motion (PM) catalog, green points are possible background galaxies, blue points are HB stars, and magenta points are sources belonging to the RGB-a. HB and RGB-a stars were identified by their positions on the – [3.6] CMD. At Spitzer wavelengths, the HB does not separate from the RGB as in optical CMDs, nor does the RGB-a except for a trend towards slightly blue [3.6] – [4.5] colors. Background galaxies are identified by their [3.6] – [8] and [8] – [24] colors and appear very red at 8 µm due to PAH emission and at 24 µm due to dust emission.
| Parameter | IRAC | MIPS | |
|---|---|---|---|
| (µm) | 3.6, 4.5, 5.8 and 8 | 24 and 70 | |
| Program ID | 20648 | 20648 | |
| Date (UT) | 2006 Mar 26 | 2006 Feb 22 and Mar 02 | |
| AORkey | 14955264 | (1495)5520, 5776, 6032, 6288, | |
| 6544, and 6800 | |||
| Coverage | 35′ 35′ | 24 µm: 35′ 55′ | |
| 70 µm: 21′ 55′ | |||
| Single Frame Exposure Time (s) | 10.4 | 24 µm: 9.96 | |
| 70 µm: 10.49 | |||
| Average Depth (no. frames) | 10 | 24 µm: 67 | |
| 70 µm: 36 | |||
| Pixel Size (arcsec pixel-1) | 1.22 | 24 µm: 1.25 1.30 | |
| 70 µm: 4.93 5.03 | |||
| PSF size | 3.6 µm: 1.7″ 1.6″ | 24 µm: 5.3″ 5.9″ | |
| 4.5 µm: 1.6″ 1.6″ | |||
| 5.8 µm: 1.6″ 1.7″ | |||
| 8 µm: 1.8″ 1.8″ |
Note. — Observations are centered at R.A. = 1326584, decl. = –47°45′218 [J2000.0]
| Wavelength | 50% Complete | 90% Complete |
|---|---|---|
| (µm) | (mag) | (mag) |
| 3.6 | 16.7 0.1 | 15.9 0.1 |
| 4.5 | 16.7 0.1 | 15.9 0.1 |
| 5.8 | 16.0 0.1 | 14.5 0.1 |
| 8 | 15.8 0.1 | 14.3 0.1 |
| 24 | 11.9 0.1 | 11.6 0.1 |
Note. — Completeness limits were determined from false star tests. These limits reflect the average over the entire cluster coverage; photometry is less complete in the core than on the outskirts of the cluster.
| No. | Source IDaa To save space, the Source ID is truncated to show only the source coordinates. The full electronic catalog, available through CDS, includes the Spitzer prefix (SSTOCEN). | Apparent Magnitude | Member- | Cand- | Notedd The Note column specifies whether a source is CN- or super-Ba-rich and/or is a M-type (M), carbon (C), or post-AGB (P) star, as indicated by optical spectra (van Loon et al., 2007). The note also indicates if a source is potentially affected by blending at 24 µm (B24, see § 3.2). | LEIDee The LEID identification numbers are assigned to Spitzer sources via cross-identification with van Leeuwen et al. (2000). | ||||
|---|---|---|---|---|---|---|---|---|---|---|
| 3.6 µm | 4.5 µm | 5.8 µm | 8 µm | 24 µm | ship (%)bb Membership likelihoods are quoted as a percentage from van Leeuwen et al. (2000). | idatecc Candidate AGB, RGB-a, and HB stars and candidate galaxies are identified by their positions on optical and Spitzer CMDs. | ||||
| (1) | (2) | (3) | (4) | (5) | (6) | (7) | (8) | (9) | (10) | (11) |
| 18562 | J132626.28472520.06 | 8.49(05) | 8.52(06) | 8.53(04) | 8.47(04) | 8.48(05) | 100 | CN | 35090 | |
| 18563 | J132626.28473229.59 | 14.04(09) | 14.16(07) | 14.24(07) | 14.32(07) | |||||
| 18564 | J132626.28471144.58 | 16.58(08) | 16.37(09) | 15.86(13) | ||||||
| 18565 | J132626.28474102.18 | 16.77(09) | 16.68(16) | 16.33(18) | ||||||
| 18566 | J132626.29473737.68 | 17.51(12) | 17.71(46) | |||||||
| 18567 | J132626.29471200.23 | 17.20(11) | 17.13(20) | |||||||
| 18568 | J132626.29473049.11 | 13.59(05) | 13.58(07) | 13.68(06) | 100 | HB | 47097 | |||
| 18569 | J132626.29472651.06 | 13.23(05) | 13.20(06) | 13.18(05) | 13.16(10) | 98 | 39111 | |||
| 18570 | J132626.30471915.97 | 17.04(09) | 17.00(22) | |||||||
| 18571 | J132626.30473515.89 | 17.30(14) | 17.55(27) | |||||||
| 18572 | J132626.30471416.24 | 16.00(06) | 16.21(19) | |||||||
| 18573 | J132626.30474159.18 | 13.22(06) | 13.24(06) | 13.28(04) | 86 | CN | 72019 | |||
| 18574 | J132626.31471627.20 | 9.34(04) | 9.28(06) | 9.31(05) | 9.29(04) | 9.30(06) | 18 | P | 16018 | |
| 18575 | J132626.31473111.71 | 14.94(08) | 15.06(11) | |||||||
| 18576 | J132626.31472320.08 | 13.98(06) | 13.99(05) | 14.00(05) | 14.02(06) | |||||
| 18577 | J132626.31474246.15 | 17.80(20) | 17.95(52) | 16.08(35) | Galaxy | |||||
| 18578 | J132626.32473543.47 | 13.12(04) | 13.18(09) | 13.11(08) | 13.18(08) | |||||
| 18579 | J132626.32472534.32 | 10.13(05) | 10.15(06) | 10.15(05) | 10.16(04) | 10.18(09) | 100 | 36061 | ||
| 18580 | J132626.32474718.12 | 15.72(08) | 15.67(26) | |||||||
| 18581 | J132626.33473132.57 | 12.23(08) | 12.28(07) | 12.24(06) | 12.02(06) | 100 | RGB-a | 49082 | ||
Note. — Magnitude uncertainties are quoted in parentheses. For example, a magnitude of 8.49 0.05 is listed as 8.49(05).
| LEID | Source IDaa To save space, the Source ID is truncated to show only the source coordinates. The full electronic catalog (available through CDS) includes the Spitzer prefix (SSTOCEN). | m3.6 | m4.5 | m5.8 | m8 | m24 | Source Type |
|---|---|---|---|---|---|---|---|
| 14043 | J132750.37471542.79 | 11.75(06) | 11.77(04) | Carbon Star | |||
| 16018bb Fehrenbach’s Star (Fehrenbach & Duflot, 1962). | J132626.31471627.20 | 9.34(04) | 9.28(06) | 9.31(05) | 9.29(04) | 9.30(06) | Post-AGB |
| 30020 | J132549.95472259.76 | 12.62(05) | 12.62(06) | 12.61(06) | 12.66(04) | Post-AGB | |
| 32015 | J132538.44472401.79 | 10.26(05) | 10.23(07) | 10.22(07) | 10.27(04) | 10.27(09) | Post-AGB |
| 32029 | J132605.17472342.43 | 9.11(05) | 8.96(05) | 8.82(04) | 8.81(04) | 8.48(05) | Post-AGB |
| 32059 | J132628.13472340.56 | 8.45(05) | 8.52(06) | 8.52(04) | 8.40(05) | 8.40(05) | Carbon Star |
| 33062 | J132630.19472427.89 | 6.96(05) | 6.88(06) | 6.74(05) | 6.27(04) | 4.98(05) | M-Type |
| 35094 | J132628.81472523.60 | 8.43(05) | 8.56(07) | 8.48(05) | 8.50(05) | 8.43(05) | M-Type |
| 35250 | J132737.72472517.37 | 7.39(05) | 7.45(06) | 7.35(05) | 7.23(04) | 6.61(05) | M-Type |
| 35252 | J132738.29472505.60 | 14.21(04) | 14.07(10) | 14.49(08) | 14.15(10) | M-Type | |
| 41071 | J132614.42472805.39 | 9.82(04) | 9.93(06) | 9.89(05) | 9.81(04) | 9.97(08) | Carbon Star |
| 42044 | J132605.35472820.80 | 7.59(04) | 7.74(06) | 7.67(04) | 7.55(05) | 7.33(05) | M-Type |
| 43105 | J132627.22472847.47 | 9.56(04) | 9.54(06) | 9.46(04) | 9.44(04) | Post-AGB | |
| 44262 | J132646.37472930.35 | 7.05(05) | 6.85(05) | 6.68(04) | 6.42(04) | 5.85(05) | M-Type |
| 44484 | J132726.37472916.93 | 8.44(06) | 8.63(05) | 8.53(05) | 8.51(05) | 8.44(05) | M-Type |
| 52030 | J132601.59473306.08 | 7.40(05) | 7.48(06) | 7.44(05) | 7.32(04) | 7.33(05) | Carbon Star |
| 53019 | J132544.03473324.79 | 13.03(05) | 13.07(06) | 13.03(04) | 12.77(10) | Carbon Star |
Note. — Magnitude uncertainties are quoted in parentheses. For example, a magnitude of 11.75 0.06 is listed as 11.75(06).
| ( yr-1) | |||||
|---|---|---|---|---|---|
| Silicate Dust | AlOx Dust | ||||
| LEID | Source ID | T = 3297 K | = 3850 K | = 3297 K | = 3850 K |
| 33062 | SSTOCEN J132630.19472427.89 | 1.7 10-7 | 1.3 10-7 | 2.1 10-7 | 1.5 10-7 |
| 44262 | SSTOCEN J132646.37472930.35 | 3.4 10-8 | 2.8 10-8 | 4.4 10-8 | 3.5 10-8 |
| 35250 | SSTOCEN J132737.72472517.37 | 2.3 10-8 | 1.8 10-8 | 2.8 10-8 | 2.2 10-8 |
| Total for all dusty members | 3.4 10-7 | 2.9 10-7 | 4.2 10-7 | 3.4 10-7 | |
| Flux (mJy) | |||||||
|---|---|---|---|---|---|---|---|
| Source # | Source ID | 3.6 µm | 4.5 µm | 5.8 µm | 8 µm | 24 µm | 70 µm |
| 1 | SSTOCEN J132723.86472130.00 | 15.94(0.32) | 10.23(0.20) | 6.66(0.13) | 5.59(0.11) | 2.42(0.05) | 75.79(17.31) |
| 2 | SSTOCEN J132521.01472623.43 | 1.96(0.04) | 1.49(0.03) | 1.96(0.04) | 12.33(0.25) | 14.33(0.29) | 226.70(8.18) |
| 3 | SSTOCEN J132523.57472813.61 | 0.17(0.00) | 0.16(0.00) | 0.79(0.02) | 2.82(0.06) | 246.73(18.94) | |
| 4 | SSTOCEN J132615.23473024.56 | 46.46(0.93) | 30.02(0.60) | 19.52(0.39) | 11.56(0.23) | 10.74(0.47) | 158.02(7.96) |
| 5 | SSTOCEN J132426.26473905.88 | 0.74(0.05) | 82.01(9.44) | ||||
| 6 | SSTOCEN J132714.06474112.83 | 0.93(0.02) | 0.63(0.01) | 0.60(0.01) | 2.60(0.05) | 3.54(0.07) | 53.04(11.19) |
| 7 | SSTOCEN J132655.87474445.02 | 0.12(0.01) | 0.11(0.01) | 0.12(0.01) | 0.69(0.01) | 3.81(0.08) | 131.46(23.81) |
| 8 | SSTOCEN J132712.89474739.59 | 0.07(0.01) | 0.05(0.01) | 0.05(0.01) | 0.06(0.01) | 0.75(0.02) | 107.50(23.54) |
| 9aa Source 9 is a resolved spiral galaxy (see Fig. 10), while sources 1 through 8 are point sources. | 2MASX J132726214746042 | 2.92(0.07) | 3.38(0.09) | 3.06(0.08) | 9.27(0.21) | 5.20(0.21) | 617.08(73.84) |
Note. — Fluxes for 3.6 – 24 µm were determined by PRF fitting with DAOphot and 70 µm fluxes were determined by aperture photometry with IRAF. Flux uncertainties are quoted in parentheses. For example, a flux of 15.94 0.32 mJy is listed as 15.94(0.32).
| Source # | Source ID | (K) | (K) | |
|---|---|---|---|---|
| 1 | SSTOCEN J132723.86472130.00 | 35.8 | 4664 19 | 58.5 1.7 |
| 2 | SSTOCEN J132521.01472623.43 | 3.3 | 2688 25 | 67.5 0.5 |
| 3 | SSTOCEN J132523.57472813.61 | 199.7 | 1100 200aa The marked uncertainties represent twice the temperature increment in the range of fixed temperatures used for the underconstrained fits. | 55.0 10aa The marked uncertainties represent twice the temperature increment in the range of fixed temperatures used for the underconstrained fits. |
| 4 | SSTOCEN J132615.23473024.56 | 40.1 | 4329 16 | 66.5 0.8 |
| 5 | SSTOCEN J132426.26473905.88 | 75.0 | 50.0 10aa The marked uncertainties represent twice the temperature increment in the range of fixed temperatures used for the underconstrained fits. | |
| 6 | SSTOCEN J132714.06474112.83 | 15.4 | 2901 28 | 68.0 2.0 |
| 7 | SSTOCEN J132655.87474445.02 | 52.2 | 1800 200aa The marked uncertainties represent twice the temperature increment in the range of fixed temperatures used for the underconstrained fits. | 60.0 10aa The marked uncertainties represent twice the temperature increment in the range of fixed temperatures used for the underconstrained fits. |
| 8 | SSTOCEN J132712.89474739.59 | 15.7 | 4000 200aa The marked uncertainties represent twice the temperature increment in the range of fixed temperatures used for the underconstrained fits. | 50.0 10aa The marked uncertainties represent twice the temperature increment in the range of fixed temperatures used for the underconstrained fits. |
| 9bb Source 9 is a resolved spiral galaxy (see Fig. 10), while sources 1 through 8 are point sources. | 2MASX J132726214746042 | 2.5 | 1084 29 | 48.8 0.8 |