A High-Resolution Spectrum of the Highly Magnified Bulge G-Dwarf MOA-2006-BLG-099S11affiliation: This paper includes data gathered with the 6.5 meter Magellan Telescopes located at Las Campanas Observatory, Chile.
Abstract
We analyze a high-resolution spectrum of a microlensed G-dwarf in the Galactic bulge, acquired when the star was magnified by a factor of 110. We measure a spectroscopic temperature, derived from the wings of the Balmer lines, that is the same as the photometric temperature, derived using the color determined by standard microlensing techniques. We measure [Fe/H]=, which places this star at the upper end of the Bulge giant metallicity distribution. In particular, this star is more metal-rich than any bulge M giant with high-resolution abundances. We find that the abundance ratios of alpha and iron-peak elements are similar to those of Bulge giants with the same metallicity. For the first time, we measure the abundances of K and Zn for a star in the Bulge. The [K/Mg] ratio is similar to the value measured in the halo and the disk, suggesting that K production closely tracks production. The [Cu/Fe] and [Zn/Fe] ratios support the theory that those elements are produced in Type II SNe, rather than Type Ia SNe. We also measured the first C and N abundances in the Bulge that have not been affected by first dredge-up. The [C/Fe] and [N/Fe] ratios are close to solar, in agreement with the hypothesis that giants experience only canonical mixing.
1 Introduction
The Galactic Bulge underwent an intense burst of star formation early in the formation of the Galaxy, leading to a very different stellar population and chemical evolution history than found in the Milky Way disk or halo (e.g., Ortolani et al., 1995; Zoccali et al., 2003; McWilliam & Rich, 1994). In particular, massive stars may dominate the pollution at almost all metallicities, leading to unique abundance patterns (e.g., Lecureur et al., 2007). Similar events are thought to mark the formation of other galactic spheroids, making the Bulge stellar population a template for interpreting extragalactic observations. As a result of its unique formation history in the Galaxy, the Bulge has been the subject of intensive study.
The detection of RR Lyrae stars (Baade, 1946) first indicated that the Bulge contained old stars. With deeper photometry, the main sequence turnoff (MSTO) of the Bulge was detected. Terndrup (1988) found a mean age of 11-14 Gyr for stars in Baade’s Window, with a negligible fraction of stars with ages 5 Gyr. Photometry reaching more than 2 magnitudes below the MSTO with Hubble Space Telescope confirmed the generally old nature of the Bulge (Ortolani et al., 1995; Holtzman et al., 1998), although Feltzing & Gilmore (2000) included a reminder that a young metal-rich population has similar MSTO colors and luminosities to an older, more metal-poor population. Therefore, deriving ages reliably from photometry of the MSTO requires adequate knowledge of the Bulge metallicity distribution function (MDF), specifically for the MSTO stars. However, because of the faintness of those stars, the measurement of the Bulge MDF has historically relied on giants.
Since the discovery of both M giants and RR Lyr stars, it has been known that the Bulge giants span a wide range in metallicity. Low-dispersion spectra provided the first quantitative measure of the MDF (Whitford & Rich, 1983; Rich, 1988). Sadler et al. (1996) measured indices from low-dispersion spectra of 268 K giants (both red clump stars and first ascent giants) to derive a mean metallicity111We adopt the usual spectroscopic notation that [A/B] log10(NA/NB)⋆ – log10(NA/NB)⊙) , with a dispersion of 0.46 dex. Recalibration by Fulbright et al. (2006) based on high-resolution spectra of 15 stars in common with the Sadler et al. (1996) sample reduced the mean metallicity to . Ramírez et al. (2000) measured from low-dispersion near-infrared spectra for 72 M giants in the inner Bulge. The good agreement between Ramírez et al. (2000) result and the recalibrated Sadler et al. (1996) result is somewhat surprising. At the bright end of the giant branch, only metal-rich first ascent giants become M giants. However, both K giants and M giants become red clump stars, and lower luminosity metal-rich giants are K stars as well. Therefore, the inclusion of red clump stars and fainter giants in the Sadler et al. (1996) sample make the biases in their sample more similar to those of the Ramírez et al. (2000) study.
Zoccali et al. (2003) measured both the MDF of the bulge and the age of the stars using deep photometry of the Bulge in the optical and near-infrared wavelengths. They constructed the MK and (V-K)0 color magnitude diagram for a low-reddening window at ()=(0.277, 6.167). Because the slope of the red giant branch (RGB) in these colors depends on the metallicity, RGB stars with different metallicities fall on different parts of the color-magnitude diagram. They could therefore use their photometry to derive the MDF of 503 giants by comparing the positions of bright (M) RGB stars with globular cluster fiducials of known metallicity. After correcting for small biases in their MDF caused by their magnitude cutoff, they find an MDF with a peak at [M/H], a sharp cutoff at [M/H] and few stars with [M/H]. Adopting the metallicities derived from the giants for the MSTO dwarfs, they estimated that the Bulge is coeval with the halo and argued that the lack of stars above the prominent MSTO of the Bulge ruled out a significantly younger population.
These measurements of the Bulge giant MDF can be improved by metallicity measurements from high-dispersion measurements of many stars in several fields throughout the Bulge. Recently, Lecureur et al. (2008) and Zoccali et al. (2008) have obtained a total of K giant spectra at (R20,000) in 4 Bulge windows. They confirm the metal-rich nature of the Bulge.
With such a metal-rich population having been reached so quickly after star formation began, the Bulge is expected to have a distinct chemical evolution compared to other Galactic populations, such as the halo or the disk because, for example, the contributions of longer-lived polluters, such as Type Ia supernovae (SNe) or low-mass AGB stars, should be small. Indeed, McWilliam & Rich (1994) measured high [/Fe] ratios in giants, in particular, high [Mg/Fe] for [Fe/H] values up to solar, arguing for little Type Ia SN contribution of Fe compared to the thick or thin disks. Fulbright et al. (2007) confirmed the overall enhancement in [Mg/Fe] and strengthened the conclusion of McWilliam & Rich (1994) that the other abundance ratios do not track [Mg/Fe] exactly. [O/Fe], [Si/Fe], [Ca/Fe] and [Ti/Fe] begin to decrease around [Fe/H]=0, while [Mg/Fe] does so at supersolar [Fe/H]. Fulbright et al. (2007) suggested that metallicity-dependent Type II SN yields could explain the different behaviors of the elements. McWilliam et al. (2007) explained the low [O/Mg] ratios in metal-rich Bulge giants through a different metallicity-dependent mechanism: Wolf-Rayet winds leading to less effective O production in metal-rich massive stars. By [Fe/H]0.2, all the [/Fe] ratios have begun to decline, probably indicating the introduction of large amounts of Fe from Type Ia SNe (e.g., Cunha & Smith, 2006).
Several studies have looked at the abundances of the light elements Na and Al in the Bulge, two elements whose production should depend on the metallicity of the massive stars that exploded as Type II SNe. Cunha & Smith (2006) measured Na in 7 K and M giants and found the predicted increase in [Na/Fe] and [Na/O] in the most metal-rich stars. Lecureur et al. (2007) found supersolar [Al/Fe] at all metallicities and, for [Fe/H] 0, enhanced [Na/Fe] compared to the ratios in disk stars. Interestingly, at higher metallicities, the scatter in [Al/Fe] and [Na/Fe] increased and became larger than could be explained by observational errors. Interpreting the Na and Al abundances as the result of Type II SN production may be problematic. The surface abundances of Al and Na have been shown to be increased by large amounts of internal mixing in metal-poor globular cluster stars (e.g. Shetrone, 1996), where the products of proton-capture reactions deep inside the star are mixed up to the surface, leading to enhancements in these two elements. However, Lecureur et al. (2007) argued that the C and N abundances in the giants they studied were consistent with only mild mixing and, therefore, that the high Na and Al had to be due to the overall chemical evolution of the Bulge. Cunha & Smith (2006) also found evidence for mild mixing in giants, affecting C and N, but not O, Na, or Al.
Finally, there is little information on the neutron-capture elements in the Bulge. The absorption lines for these elements are concentrated in the blue part of the optical spectrum, where the crowding from Fe, CN, and other lines is severe. Near-IR spectra have essentially no lines of these elements. While there are a few lines of Ba in the red, these lines in metal-rich giants are so saturated that reliable measurements are very difficult. As a result, only the neutron-capture element Eu has published results so far. McWilliam & Rich (1994) found [Eu/Fe]0 in Bulge giants, which is likely because of the production of Eu in the r-process. Measuring additional neutron-capture element abundances would test this idea, because the r-process is better at making some elements (e.g., Eu) than others (e.g., Ba).
Our knowledge of the metallicity and abundance ratios of Bulge stars has generally been confined to the bright giants, which are usually the only ones accessible to high-resolution observations. But studying the dwarfs has several advantages. Their abundances of the elements such as C and N are unaffected by dredge-up processes on the giant branch. We can measure elements, such as S and Zn, that not measured in giants, because the hotter temperatures of the dwarfs decrease the strength of CN and increase the strength of certain atomic lines. In addition, it is critical to know the metallicity of stars at the MSTO to accurately measure the ages from their color and luminosity. Finally, individual ages can be assigned to dwarf stars near the turnoff.
The advent of large surveys to identify and follow-up microlensing events, such as the Microlensing Observations in Astrophsycis (MOA) collaboration222http://www.massey.ac.nz/iabond/alert/alert.html, the Optical Gravitational Lens Experiment333http://www.astrouw.edu.pl/ ogle/ogle3/ews/ews.html (OGLE), the Microlensing Follow Up Network444http://www.astronomy.ohio-state.edu/microfun/ (FUN) and the Probing Lensing Anomalies Network555http://planet.iap.fr/ (PLANET), provides an opportunity to study otherwise unobservable Bulge dwarfs. During high-magnification microlensing events, it is possible to obtain high-resolution, high signal-to-noise ratio spectra of faint stars with a huge savings in observing time: a factor where is the magnification and is the number of magnitudes below sky of the unmagnified star. In Johnson et al. (2007) , we reported the detailed abundances for a highly-magnified Bulge dwarf, OGLE-2006-BLG-265S, which from a 15 minute exposure at magnification , was shown to be one of the most metal-rich stars ever observed. It also provided the first measurements of S and Cu in the Bulge. Here we present a high-resolution spectrum of the Bulge G-dwarf MOA-2006-BLG-99S, taken at magnification .
Finally, we respond the challenge: “Ask not what microlensing can do for stellar spectroscopy – ask what stellar spectroscopy can do for microlensing.” There is one important way that the spectroscopic study of bulge dwarfs can benefit microlensing. Whenever a source approaches or transits a “caustic” (line of infinite magnification) caused by the lens, one can measure , the ratio of the angular source radius to angular Einstein radius , from the microlens lightcurve. Then is inferred from the dereddened color and magnitude of the source to yield , which in turn provides important constraints on the lens properties. Because spectroscopy is not normally available for these microlensed sources, the dereddened color and magnitude are estimated by comparing the source position on an instrumental color-magnitude diagram with that of the clump and then assuming that the Bulge clump is similar to the local clump as measured by Hipparcos (Yoo et al., 2004a). This procedure undoubtedly suffers some statistical errors and could suffer systematic errors as well. For example, the Bulge clump may have a different color from the local one. High-resolution spectra of an ensemble of microlensed bulge sources will test this procedure for both statistical and systematic errors. For OGLE-2006-BLG-265S, the standard microlensing procedure yielded , whereas Johnson et al. (2007) obtained from high-resolution spectroscopy. This difference hints at a possible discrepancy, but only by repeating this procedure on a number of dwarfs can this be confirmed.
2 Observations
MOA-2006-BLG-99 was alerted as a probable microlensing event toward the Galactic Bulge (J2000 RA = 17:54:10.99, Dec = 35:13:38.0; , ) by MOA on 22 July 2006. On 23 July, MOA issued a further alert that this would be a high-magnification event, with . Intensive photometric observations were then carried by several collaborations, including FUN, primarily with the aim of searching for planets (Mao & Paczyński, 1991; Griest & Safizadeh, 1998; Udalski et al., 2005; Gould et al., 2006). Results of that search will be presented elsewhere. The event actually peaked on 23 July (HJD 2453940.349) at . One of us (BSG) happened to be at the Clay 6.5-m Telescope at the Magellan Observatory when he received the flurry of FUN emails describing this event. He then interrupted his normal program to obtain a 20-minute exposure of this event at the beginning of the night, just after peak, when the magnification was . Unfortunately, the atmospheric transparency was poor, and the observation had to be interrupted after 1089 seconds when the cloud cover became too thick. Conditions cleared several hours later, and he obtained two 20-minute exposures centered at UT 02:09:36 and UT 02:30:34 24 July, when the magnification was and . We base our results on these higher quality spectra.
The observations of MOA-2006-BLG-99 were made using the Magellan Inamori Kyocera Echelle (MIKE) double spectrograph (Bernstein et al., 2003) mounted on the Clay telescope on Las Campanas. with seeing of 0.7–1.0 arcsec. We used the 1.0 arcsec slit, which produces R25,000 on the blue side and R19,000 on the red side.
3 Data Reduction
The data were reduced using the MIKE Python data reduction pipeline (D. Kelson, 2007, private communication), with the exception of the bluest orders containing the CH and CN lines, which were reduced using the IRAF666IRAF is distributed by the National Optical Astronomy Observatories, which are operated by the Association of Universities for Research in Astronomy, Inc., under cooperative agreement with the National Science Foundation. echelle package. The bias and overscan were subtracted. The wavelength calibration was derived from Th-Ar data. Flatfields were taken through a diffusor slide to create “milky flats” that made the orders sufficiently wide to get good flatfields along the edges of the orders of the data frames. Parts of orders with overlapping wavelength coverage were coadded together before analysis. These overlap regions are larger for the bluer parts of the spectrum. Over the wavelength region where individual lines were measured (5300-8000Å), the signal-to-noise (S/N) is 30. The CN and CH bandhead regions had lower S/N (S/N10).
4 Abundance Analysis
We analyzed both the spectrum of MOA-2006-BLG-99S and the spectrum of the Sun (Kurucz et al., 1984) using the same set of lines, line parameters, and model atmosphere grids. We used TurboSpectrum (Alvarez & Plez, 1998), a 1-dimensional LTE code, to derive abundances. TurboSpectrum uses the recent treatment of damping from Barklem et al. (2000). We interpolated the model atmosphere grid of ATLAS9 models777http://kurucz.harvard.edu/grids.html updated with new opacity distribution functions (Castelli & Kurucz, 2003). The abundances of most elements were determined from analysis of the equivalent widths (EWs). The EWs for both MOA-2006-BLG-99S and the Sun are presented in Table 1. We restricted the analysis to lines with EWmÅ. The EWs were measured using SPECTRE888http://verdi.as.utexas.edu/spectre.html (C. Sneden, 2007, private communication). We compared synthetic with observed spectra to determine abundances for lines that were blended, lines that had substantial hyperfine splitting and for C and N that were measured from CH and CN lines, respectively. We used the solar atlas of Moore et al. (1966) to check for blending with telluric features and eliminated the few lines that were affected.
The linelists for CH and CN are from B. Plez (2006, private communication). The effect of hyperfine splitting (HFS) was included for Sc, Mn, Cu and Ba. The HFS constants were taken from the sources listed in Johnson et al. (2006). HFS information was not available for the Na or Al lines, so neither this study nor the literature studies we use for comparison can correct for those effects. Therefore, the comparison between [Na/Fe] and [Al/Fe] values for MOA-2006-BLG-99S and the literature values is robust, but the absolute values of these abundance ratios for all studies have a systematic error. Table 1 lists the transition probabilities (listed as log -values) and sources for all the atomic lines.
4.1 Atmospheric Parameters
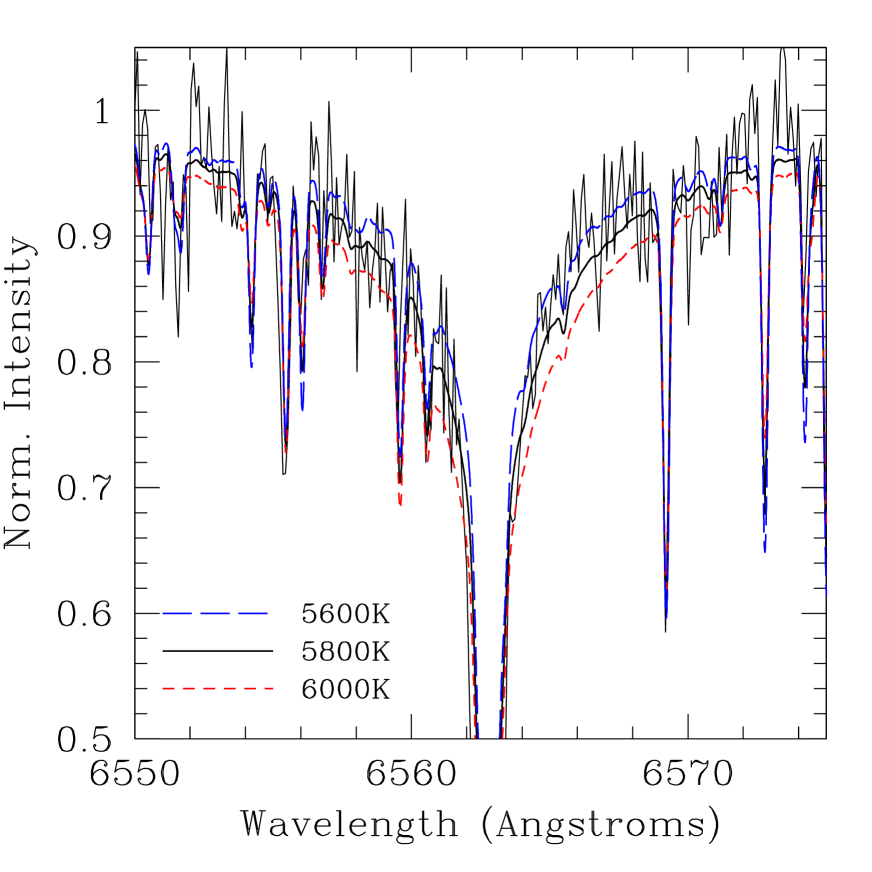
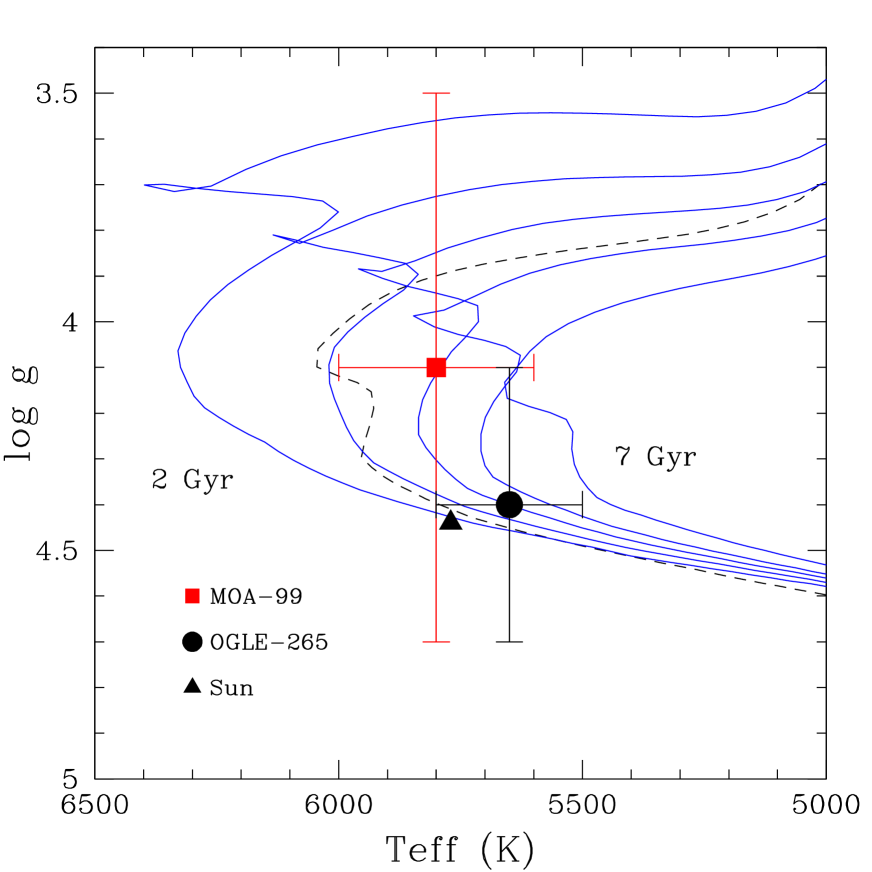
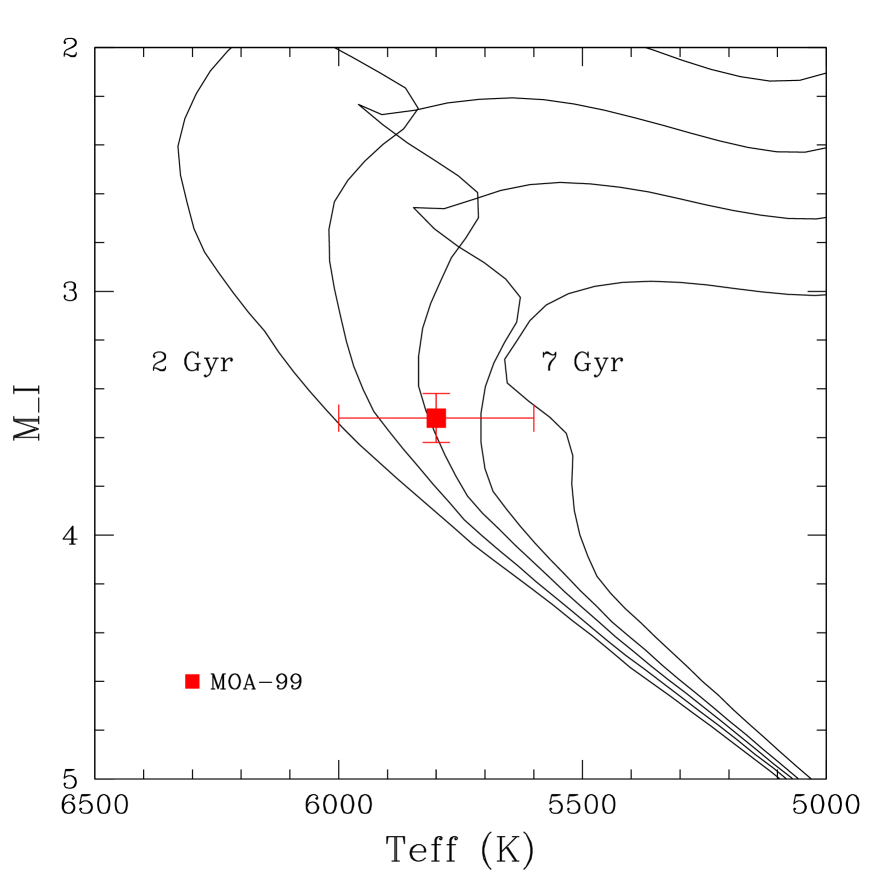
We measured a Teff=5800K using the wings of the H- and H- lines (Figure 1). Our uncertainty in the temperature is based on the uncertainty in this fit, in particular the uncertainty in the level of the continuum. Temperatures derived from the Balmer lines for metal-rich dwarfs show good agreement with temperatures derived from the infrared flux method and from colors (Mashonkina et al., 1999; Barklem et al., 2002). For MOA-2006-BLG-99S, we compared the temperature derived from the Balmer lines with that derived from excitation equilibrium of the Fe I lines. The temperature derived from the Fe I lines was very uncertain because the abundances derived from individual lines were poorly determined because of the S/N of the spectrum. The excitation equilibrium favored a higher temperature (+200K) with an uncertainty of 300K.Given the uncertainties, this temperature is in agreement with the Balmer line temperature. Next, we measured the microturbulent velocity, , by ensuring that the abundances derived from the Fe I lines do not depend on their reduced EW. Our best fit value was =1.5 km/s. Changing by 0.3 km/s gave marginal fits to the data, and we adopt that as our uncertainty in . The gravity was measured by ionization balance for Fe I and Fe II and for Ti I and Ti II. As a sanity check, in Figure 2, we compare the atmosphere parameters for MOA-2006-BLG-99S, OGLE-2006-BLG-265S, and the Sun to the parameters from the Yonsei-Yale (Yi et al., 2001; Demarque et al., 2004) isochrones. Finally, the metallicity of the model atmosphere, [m/H], was set equal to the [Fe/H] given by the Fe I lines. Because the log of the model atmosphere affects the [m/H] and the [m/H] affects the abundances (and therefore the log measurement), we iterated to find a solution for which Fe I and Fe II were equal and the [m/H] of the model was equal to [Fe I/H].
Using standard microlensing techniques (e.g., Yoo et al. 2004a), FUN determined that the dereddened color and magnitude of the source were , . The error is due to possible differential reddening between the microlensed source and the red clump, which is assumed to have the same as the local Hipparcos clump. If (as seems likely) the source lies at approximately the Galactocentric distance, then its absolute magnitude is and its radius is 1.2. That is, it is a solar-type star. We combined the FUN color and the Ramírez & Meléndez (2005) color-temperature relation (an update of the Alonso et al. (1996) relation) to derive an estimate of the temperature of 5806 200 K. This photometric temperature agrees with the temperature from the Balmer lines. For OGLE-2006-BLG-265S, the spectroscopic and photometric temperatures were different, suggesting possible systematic errors in estimating the dereddened color and magnitude of the source star. As outlined in the Introduction, quantifying any systematic errors is important for obtaining the most accurate information about microlensing events, and additional data will be crucial for quantifying any systematic error.
4.2 Error Analysis
Our uncertainties are 200K for Teff and 0.3 km/s for . The distribution of EWs and excitation potential for the Fe I lines were sufficiently uncorrelated that did not depend on Teff. Our measurements of Teff and therefore did not depend on accurate assessments of the other model atmosphere parameters, namely log and [m/H]. Our measurement of log and [m/H], on the other hand, depended strongly on the other model atmosphere parameters. Because we set the gravity by ionization equilibrium, log depends on Teff, , and [m/H], as well as the abundance measured from the Fe I and Fe II lines. Therefore, the uncertainty in log depends on the uncertainties in those quantities. The uncertainty in [m/H], in turn, depends on the uncertainty in Teff, log , and , as well as the scatter in the abundance given by different Fe I lines for a particular model atmosphere. The standard error of the mean for the gravity derived from the 35 Fe I lines for a single model atmosphere was 0.04 dex, and for the 4 Fe II lines was 0.14. We adopt 0.04 dex as the uncertainty from EW and log errors for Fe I for inclusion in the [m/H] uncertainty. Adding the Fe I and Fe II uncertainties in quadrature give us 0.15 dex as our uncertainty in the difference between the Fe I and the Fe II log999log (A) log10(NA/NH) + 12.0 values arising from the EW and oscillator strength uncertainties. The total uncertainty in log is 0.66 dex and in [m/H] is 0.21 dex.
We ran the Fe I and Fe II EWs through a series of models: 200K, 0.3 km/s, 0.3 dex for log , and 0.13 dex in [m/H] (smaller because of the limits of the Kurucz grid), and calculated the difference in Fe abundance with these different model atmospheres.
Finally, we calculate uncertainties using modified equations (A5) and (A20) from McWilliam et al. (1995). We considered the covariance between Teff: log , Teff: [m/H] , log : [m/H] , : log , and : [m/H]. The covariances were calculated by a Monte Carlo technique. For example, to calculate the covariance between Teff and log , we first found and noted the remaining scatter that was caused by uncertainty in , etc. Next, we randomly picked 1000 Teff from a Gaussian distribution with a of 200K. We used the derivative to calculate log and then added an extra random log drawn from a Gaussian distribution with a equal to the uncertainty from non-Teff causes. We calculated the covariance using these 1000 Teff-log pairs. A similar calculation was done for the other covariances.
5 Results
In Table 2, we summarize the abundances measured for 17 elements in MOA-2006-BLG-99S. We include both log and its error, as well as [X/Fe] and its error. To give an idea of the uncertainty due to scatter from the lines, rather than from atmospheric parameters, we give , the rms of abundances derived from individual lines as well as the number of lines. We also give our measurements of the solar abundances, which we will use to calculate ratios. For reference, we include the Grevesse & Sauval (1998) solar abundances in the final column.
5.1 Metallicity
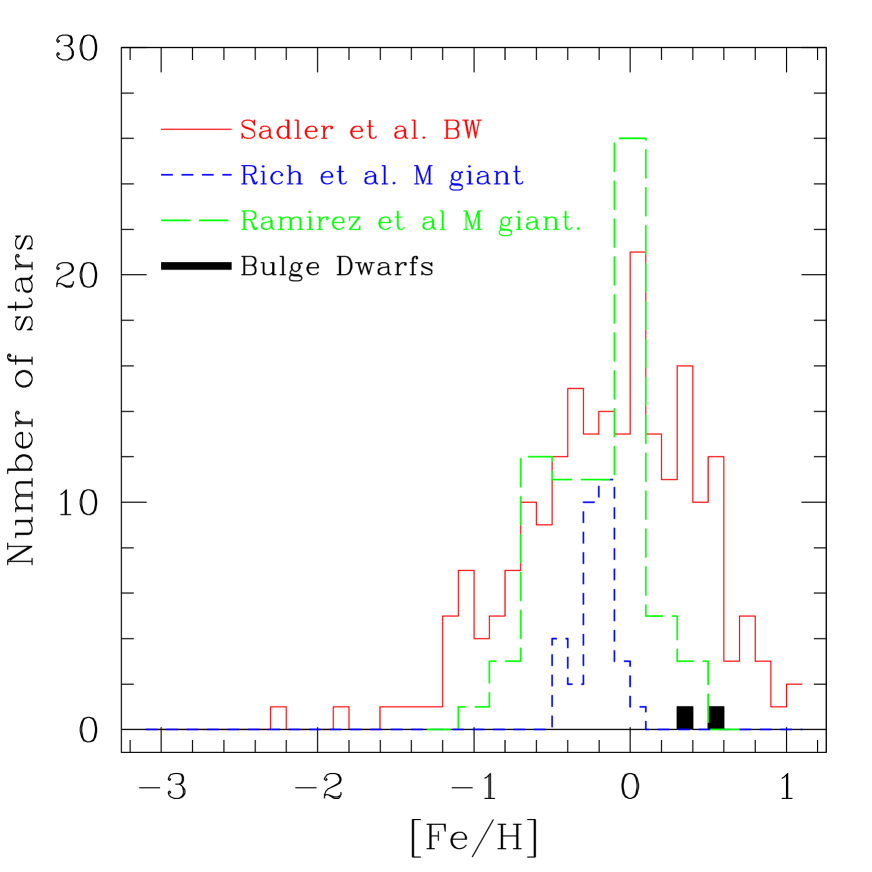
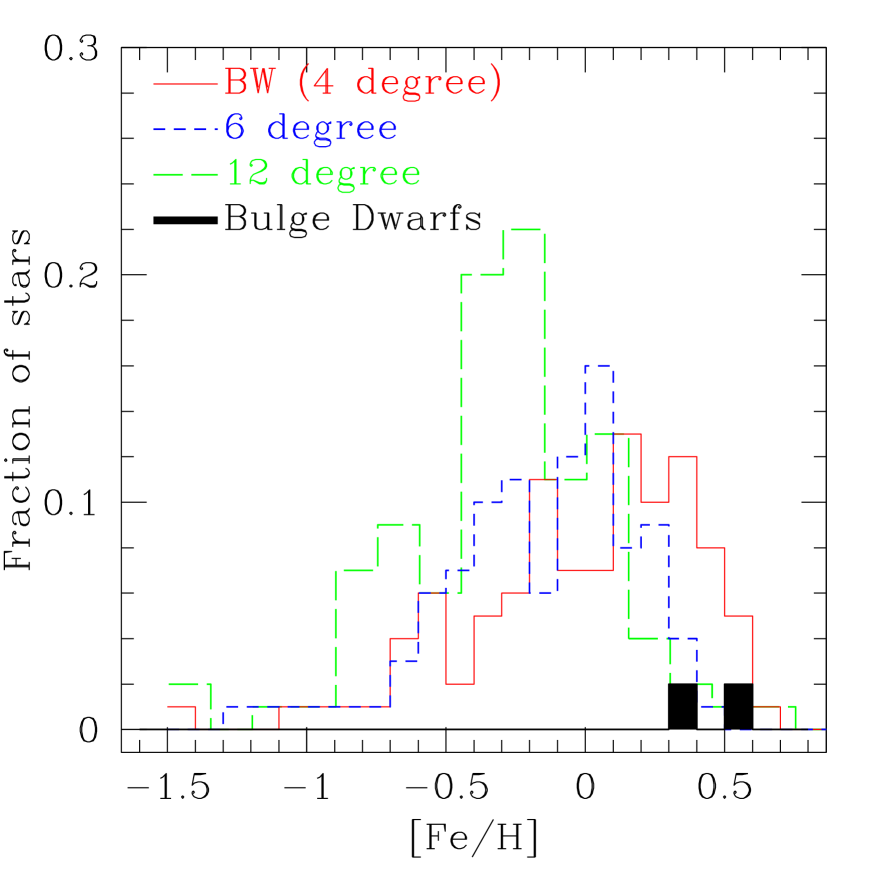
We measure [Fe/H] for MOA-2006-BLG-99S. In Johnson et al. (2007), we measured [Fe/H] for the dwarf OGLE-2006-BLG-265S. The stars that are microlensed are unbiased in metallicity. The criterion for spectroscopic follow-up is that the unmagnified source be faint enough to be a Bulge dwarf, regardless of color. Therefore, especially considering the large and variable reddening toward the Bulge, we are not biased in our high-resolution follow-up toward high metallicity sources. The high metallicities of these two dwarfs is surprising given that work on giants has indicated an average metallicity near solar. In Figure 3, we compare the metallicity distribution function (MDF) of the two dwarfs with several MDFs based on studies of giant stars. The MDF of Rich et al. (2007), which is based on high-resolution analysis of M giants and should be biased toward the highest metallicity objects, lacks any giants as metal-rich as these dwarfs. This is particularly notable, since the work of Sadler et al. (1996) on K giants with low-dispersion spectra shows some extremely metal-rich stars. A complicating factor is the possible presence of a metallicity gradient in the Bulge. In Figure 4, we compare the metallicities of the dwarfs with MDFs derived by Zoccali et al. (2008) from high-resolution spectra for giants in three Bulge fields: 4∘, 6∘, and 12∘away from the Galactic center. The inner field is more metal-rich than the outer. However, these two dwarfs are located 6.5∘(MOA-2006-BLG-99S) and 4.9∘(OGLE-2006-BLG-265S) away from the Galactic Center, and therefore gradients cannot explain their anomalously high metallicities.
These results hint that the MDFs of the Bulge giants and dwarfs may be different. Whether this is true can be established by more observations of Bulge dwarfs and by resolution of the discrepancies among the MDFs derived for giants, particularily between the low-dispersion and high-dispersion studies. Because the microlensed dwarfs are found at a range of distances from the Galactic Center, comparison of the giant and dwarf MDFs also depends on measuring the metallicity gradient (and the size of deviations from that gradient) in the Bulge. Ideally, the MDF for giants in the same field as the microlensed dwarf would be measured.
5.2 Comparison with Isochrones and the Age of MOA-2006-BLG-99S
With our measurements of Teff, log , and [Fe/H] from spectroscopy, we can compare the position of MOA-2006-BLG-99S on the Hertzsprung-Russell diagram with theoretical isochrones (Fig. 2). We use the Yonsei-Yale isochrones (Yi et al., 2001; Demarque et al., 2004) with [Fe/H]=0.385, [/Fe]=0 for comparison. The best fit age for this star is 5 Gyr. Instead of log g, we can also use the I-band magnitude to plot the star on the H-R diagram. We adopt a distance of 8.5 kpc, placing this dwarf on the far side of the Bulge, its most likely position because the optical depth for lensing is larger there. Figure 5 shows that a similar age is obtained. Indeed, shifting the position of MOA-2006-BLG-99S in the vertical direction, by changing its distance or luminosity has little effect on the young age that we derive for this star, because, at this metallicity, there should be no stars this hot with ages 6 Gyr. However, the uncertainty in the temperature combined with the effect that changing the temperature has on the derived metallicity produce large uncertainties in the age. If we instead adopt the Teff on the lower edge of our range (5600K), the metallicity calculated from the Fe I lines drops to [Fe/H]=0.16 dex. Using isochrones of this metallicity, the new Teff gives an age of 9 Gyrs. Improvements in the accuracy of temperatures are needed to get better age constraints for Bulge dwarfs, but in principal, ages can be measured for individual stars near the main-sequence turnoff.
5.2.1 Mixing in Giants in the Bulge
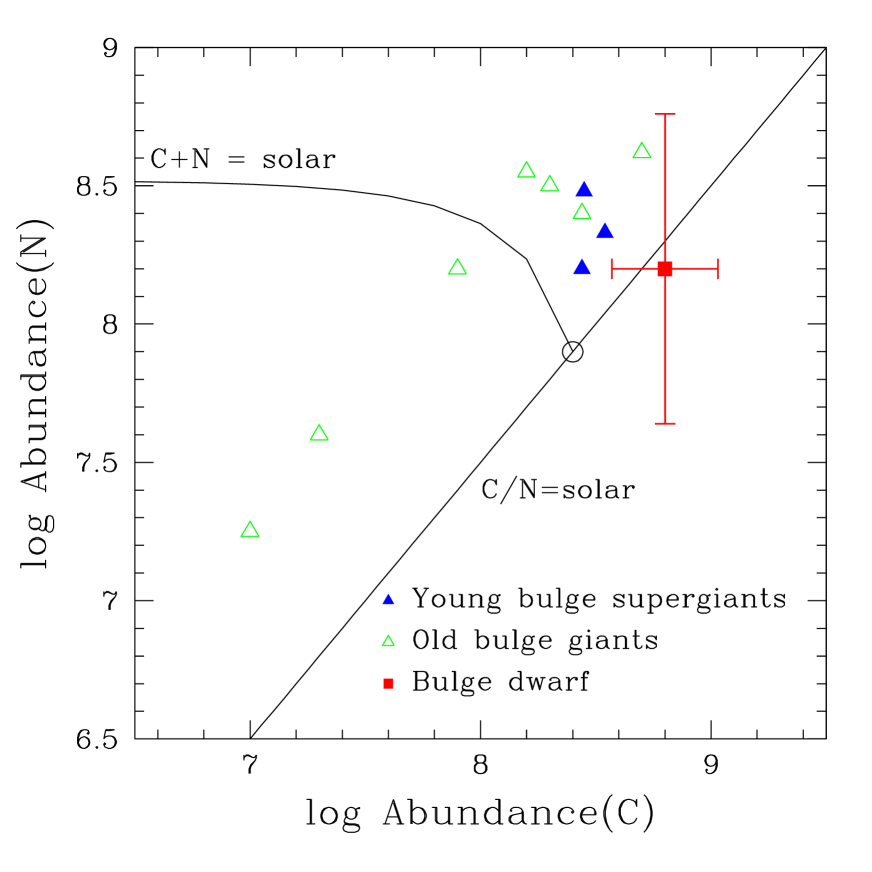
As stars move up the giant branch, they pass through first dredge-up, which brings up material that has been processed in the CN cycle. The C and N abundances measured in giants no longer represent the original C and N endowments of the stars, although C+N will remain constant as long as only material processed in the CN cycle, and not the ON cycle, is mixed to the surface. Cunha & Smith (2006) and Cunha et al. (2007) measured C and N in giants in the Bulge. They found that the giants lie to the N-rich side of the line defined by the C/N ratio of the Sun (Figure 6). Cunha et al. (2007) concluded that a small amount of mixing had occurred in the giants. This conclusion is only valid if the original abundances in the giants lie close to the line. Otherwise, if the Bulge dwarfs have non-solar C/N ratios, the C/N ratios measured in Bulge giants could imply either no mixing (and a N-rich original composition) or substantial mixing (and a C-rich original composition). The abundances of C and N for MOA-2006-BLG-99S are also plotted on Figure 8 and shows that the assumption of Cunha et al. (2007) is justified and that the expected amount of mixing has occurred in the giants.
5.3 Lithium
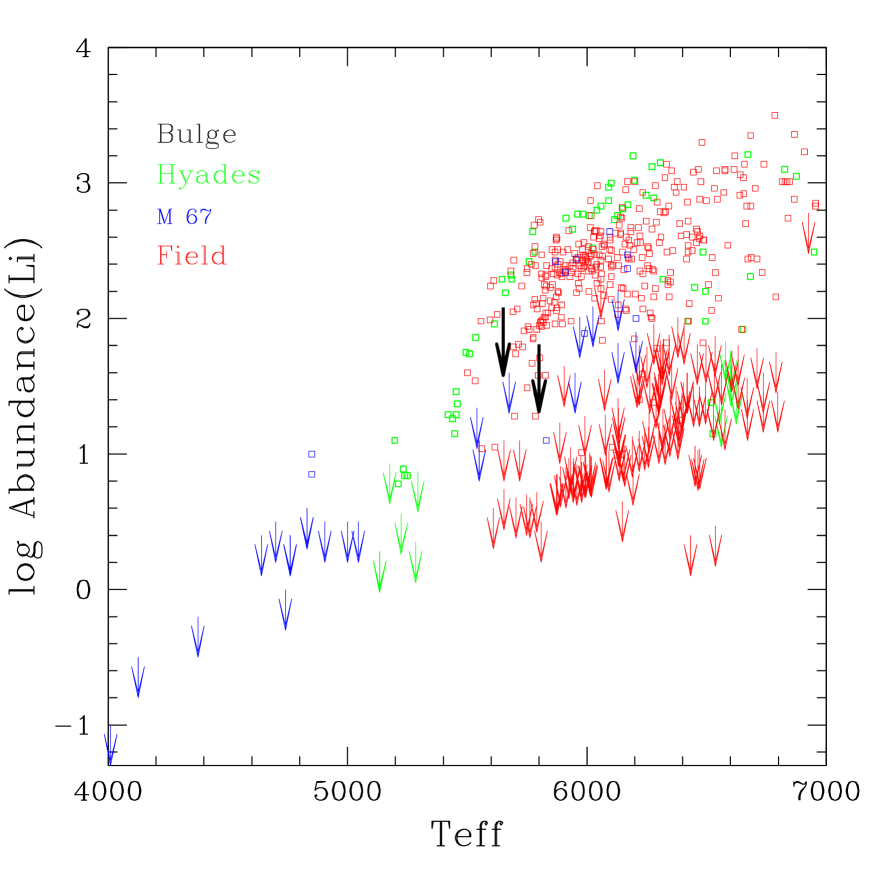
Li has been created since the Big Bang by stellar nucleosynthesis and by cosmic ray spallation. A Li abundance for a star in the Bulge, measuring how fast Li was made in the early Galaxy, would be very interesting. However, most stars no longer have the same amount of Li on their surfaces as was present in their natal gas clouds. Li is easily burned during pre-main sequence and main-sequence phases of stars and is either destroyed throughout the convective envelope during the RGB phase or (for a brief time) created in the star itself and dredged up. We have no detection of Li in this star, only a 3- upper limit of log(Li)=1.84 dex based on a fit to the data (see Johnson et al. 2007 for more details). In Figure 7 we show this upper limit compared with Li measurements in open cluster stars having a range of ages as well as field stars from Lambert & Reddy (2004). We also include the upper limit from OGLE-2006-BLG-265S. Lower values can be expected in field stars because of astration on the main-sequence and because they are often older than the clusters featured in Figure 7 and were formed out of gas that had not been polluted by as much Li. Figure 7 shows that the Li upper limits in the bulge dwarfs are consistent with the upper limits in field dwarfs. A dwarf with TeffK is probably needed to measure the amount of Li produced by spallation in the Bulge.
5.4 Chemical Evolution of the Bulge
The Bulge has a different star formation history than the halo/disk. The ratios of Type II/Type Ia pollution or Type II/AGB star pollution at a given [Fe/H] are therefore different as well, and the abundance ratios reflect this. We compare the abundances for both MOA-2006-BLG-99S and OGLE-2006-BLG-265S with Bulge giants and field stars from the thick/thin disk and halo from literature sources. In Table 3, we summarize the literature sources we use for each element.
5.4.1 Carbon and nitrogen
For many elements, observing red giant stars in the Bulge is an effective method of measuring their abundances. However, as shown in §5.2.1, internal mixing on the RGB alters the abundances of C and N. The abundances of C and N that we measure in MOA-2006-BLG-99S therefore represent the first observations of the primordial C and N produced by the chemical evolution of the Bulge.
MOA-2006-BLG-99S has [C/Fe]=0.04 and [N/Fe]=0.06 (Fig. 8). The solar values of [C/Fe] and N/Fe] show that C and N production kept pace with the Fe production in the Bulge. There are many sources of C in the Universe (Gustafsson et al., 1999, e.g.). Type II SNe and AGB stars certainly contribute substantial amounts of C and N; the roles of novae and Wolf-Rayet stars are less clear. These contributions, whatever they are, track the production of Fe in the chemical evolution of the Bulge. Finally, we attempted to measure the 12C/13C ratio, which is sensitive to the source of C, being low for low-mass AGB stars and high for Type II SNe. We could only set an uninteresting limit (12C/13C ¿ 1) on this very interesting number.

5.5 Sodium and Aluminum
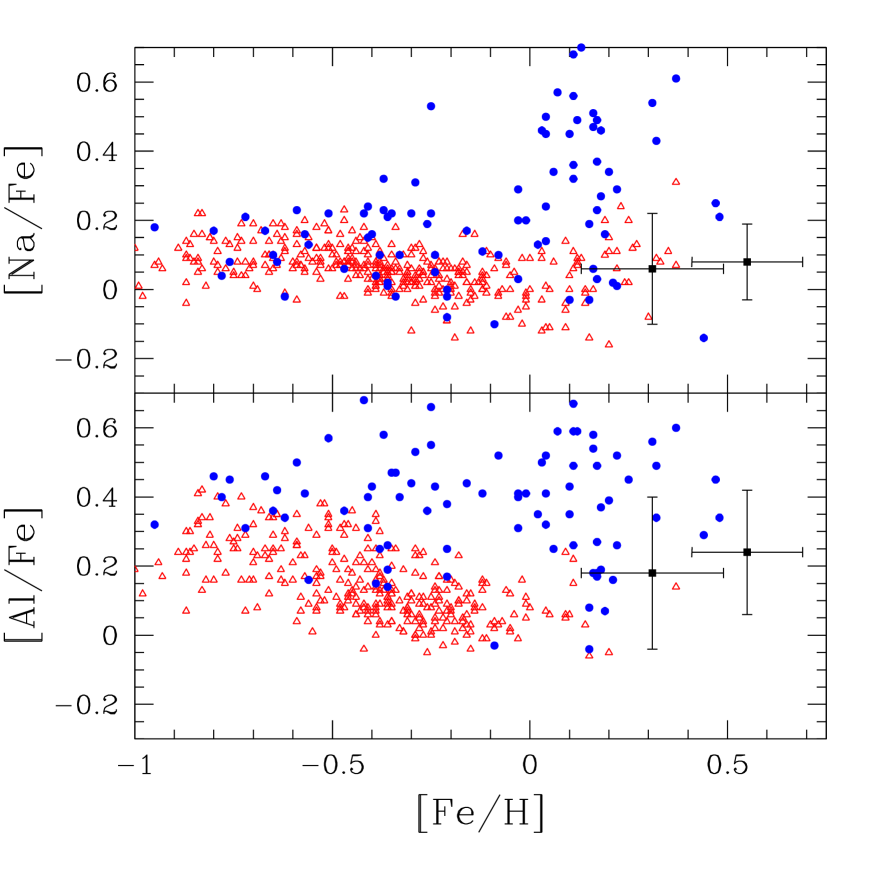
The abundances of Na and Al are elevated in Bulge giants (McWilliam & Rich, 1994; Lecureur et al., 2007) compared to disk stars. Metal-rich Type II SNe are predicted to produce more of the odd-Z elements such as Na and Al than metal-poor Type II SNe and could potentially be the explanation of the difference between the Bulge and the disk. In Figure 9, we show the [Na/Fe] and [Al/Fe] value for MOA-2006-BLG-99S and OGLE-2006-BLG-265S. These two unmixed stars are on the lower end of the scatter seen in the giants. This could be a hint that the larger [Na/Fe] and [Al/Fe] values seen in giants are due to internal mixing, but because the dwarf values fall within the scatter outlined in the scatter indicates that more measurements in dwarf stars are needed before any differences in the distribution of [Na/Fe] and [Al/Fe] in dwarfs and giants can be seen.
5.6 The elements
Figure 10 shows the [O/Fe], [Mg/Fe], [Si/Fe], and [Ca/Fe] for MOA-2006-BLG-99S compared with halo stars, thin and thick disk stars, and Bulge giants. The metallicity of MOA-2006-BLG-99S is in the range of metallicities measured for Bulge giants, allowing direct comparison of [/Fe] ratios between dwarfs and giants. The agreement is good, as both the giants and the dwarf have [/Fe] below the high [/Fe] values of the more metal-poor ([Fe/H]0) stars. This decline in all [/Fe] ratios suggests that Fe from Type Ia SNe is being added and that the more metal-rich stars formed sufficiently later to have this ejectum in their gas.

5.7 Potassium
K is an odd-Z element and is predicted in nucleosynthesis models to be underproduced relative to the elements in metal-poor SNe. There are few measurements in the literature, and those that exist show the opposite trend of increasing [K/Fe] with decreasing [Fe/H] (Gratton & Sneden, 1987; Chen et al., 2000; Cayrel et al., 2004). However, the only K line available for study in most stars, the resonance line at 7698Å, is affected by non-LTE effects, and these corrections have not yet been applied to large samples. Zhang et al. (2006) derived NLTE corrections for each star in their sample. The [K/Fe] values were still supersolar at low metallicities, with the thin disk stars showing a drop in [K/Fe] for[Fe/H]. The [K/Fe] ratios in the thick disk stars remain high. However, the [K/Mg] ratios showed much smaller variations among the different Galactic populations. They argued that the constant [K/Mg] ratio ([K/Mg]=) in the stars indicated that the nucleosynthesis of K is closely coupled to that of the -elements, which is somewhat surprising given the theoretical predictions.
We measured the 7698Å line in MOA-2006-BLG-99 and the Sun. We also measured the K abundance in OGLE-2006-BLG-265S using TurboSpectrum and the model atmosphere described in Johnson et al. (2007). The [K/Fe] we measure for OGLE-2006-BLG-265S is Figure 11 compares the results for the Bulge to the Zhang et al. (2006) results. We applied no NLTE correction, but assumed that the LTE abundances in the Sun and MOA-2006-BLG-99S would be affected by the same amount.
The [K/Mg] values are 0.07 for MOA-2006-BLG-99S and 0.12 for OGLE-2006-BLG-265S; the [K/Mg] abundance is still within a narrow range, even in this very different chemical evolution history.

5.8 Iron-peak elements
The abundances for Ti, Sc, Mn and Ni are shown in Figure 12. McWilliam & Rich (1994) found that [Ti/Fe] behaves like [O/Fe] in the Bulge, with supersolar [Ti/Fe] ratios for many stars, followed by [Ti/Fe] decreasing to solar for [Fe/H. The abundance of Ti is also enhanced in halo stars, leading it to be classified as an “-element” for observational purposes. In MOA-2006-BLG-99S, [Ti/Fe] is close to solar, in line with the -elements discussed above. The ratios of [Sc/Fe] and [Ni/Fe] are observed to be close to solar for a wide range of populations: halo, thick and thin disk and Bulge. The data for MOA-2006-BLG-99S show that abundances in this Bulge dwarf agree with this picture.
For [Fe/H] in the Galactic halo/disk, there is a plateau at [Mn/Fe] (McWilliam et al., 1995, 2003). Because Type Ia SNe have not polluted the most metal-poor stars in the Galaxy, we can derive the ratio of Mn/Fe produced in (metal-poor) Type II SNe from this plateau. [Mn/O] starts to rise before [O/Fe] starts to drop in the disk. Because the drop in [O/Fe] signals the onset of substantial Type Ia SN contribution, the rise in Mn relative to O cannot be due to Type Ia SNe, but rather to increased production of Mn by more metal-rich Type II SNe (Feltzing et al., 2007). McWilliam et al. (2003) also measured Mn in 13 stars in the Sagittarius dwarf galaxy. These stars have substantial Type Ia SNe contributions to their gas, but [Mn/Fe] values about 0.2 dex below the trend seen in the Galactic disk, providing additional evidence that metal-rich Type II SNe are responsible for Mn production. The near solar [Mn/Fe] values for MOA-2006-BLG-99S and OGLE-99 are also in support of this idea, because they were seen in an environment that had many Type II SNe occur, unlike the Sagittarius stars.

The [Ti/Fe] value in MOA-2006-BLG-99S agrees well with [Ti/Fe] ratios measured in bulge giants of similar metallicity. Within the error bars, the other [iron-peak/Fe] ratios follow the trends seen the disk stars.
5.9 Copper and Zinc

The percent of Cu and Zn production to be ascribed to different nucleosynthesis sites (e.g., Type II SNe, AGB stars, Type Ia SNe) is uncertain. The observations show that [Cu/Fe] at the lowest metallicities and then rises to solar by [Fe/H] (e.g. Mishenina et al., 2002). [Zn/Fe], on the other hand, has supersolar values at the lowest metallicities and then decreases to closer to solar (e.g. Mishenina et al., 2002). Matteucci et al. (1993) used new weak s-process calculations and available SN models to argue that approximately two-thirds of the Zn and Cu production in the Universe is due to Type Ia SNe. The rest of the Zn is from a primary process in massive stars, while the Cu comes from a secondary (=metallicity-dependent) process in massive stars. Using this model and a chemical evolution model for the Bulge, Matteucci et al. (1999) predicted that both [Cu/Fe] and [Zn/Fe] would be 0.2 at [Fe/H]=0.3. The SN models available to Matteucci et al. (1993) did not include important effects, such as detailed calculation of neutron-capture elements beyond Fe. Bisterzo et al. (2005) used updated results and considered Zn and Cu production by neutron-capture in the O-rich parts of Type II SNe (“weak sr-process”). In their analysis, Cu is mostly produced in this weak sr-process, a secondary process. A small amount of primary Cu is made as radioactive Zn in the inner regions of Type II SNe. Zn production is also due to massive star nucleosynthesis, but here there is a large primary production in the -rich freeze out in Type II SNe, which is supplemented at higher metallicities by a secondary contribution from the weak-sr process. Bisterzo et al. (2005) find no need for contributions to Cu and Zn from Type Ia SNe or AGB stars.
The measurements of [Cu/Fe] and [Zn/Fe] in MOA-2006-BLG-99S support the Bisterzo et al. (2005) model and argue against the production of large amounts of Zn in Type Ia SNe. Because the abundance of Cu is dominated by a secondary process, the solar [Cu/Fe] at [Fe/H]=0.36 and the supersolar value at [Fe/H]=0.56 are the result of copious Cu production in metal-rich Type II SNe. However, the primary production of Zn and the smaller secondary contribution is not sufficient to keep up with the Fe from both Type II SNe and Type Ia SNe. The observations also show again that the chemical evolution of Zn is separate from Fe.
5.10 Barium
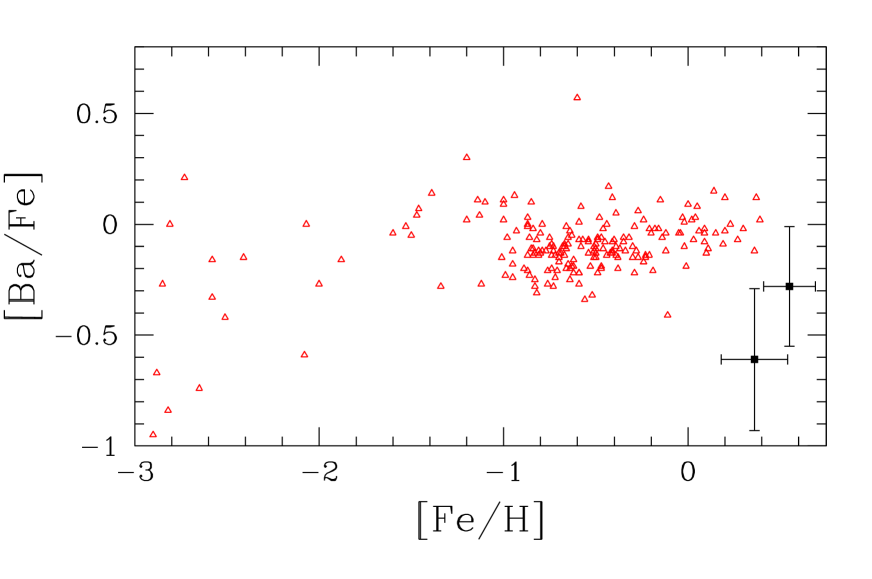
The [Ba/Fe] for MOA-2006-BLG-99S falls considerably below the solar value ([Ba/Fe]= (Fig. 14). It falls in the range not seen in other parts of Galaxy, except for the metal-poor halo. We note that we could only measure 1 line of Ba in MOA-2006-BLG-99S, and the solar value we measure is the most discrepant from the solar value in Grevesse & Sauval (1998). However, even if the Grevesse & Sauval value is used, the [Ba/Fe] for MOA-2006-BLG-99S is still subsolar ([Ba/Fe]=0.24). If we use the solar value of Ba (log((Ba)=2.39) reported in Johnson et al. (2007), OGLE-2006-BLG-265S has a [Ba/Fe].
The paucity of Ba in the halo stars is explained by the fact that the r-process is the only available channel for producing the heavy elements in the early Univere, and the r-process is not an efficient producer of Ba. It is tempting to ascribe the low Ba in MOA-2006-BLG-99S to the same cause, especially in light of the high [Eu/Fe] measurements in Bulge giants by McWilliam & Rich (1994). Stellar populations dominated by Type II SNe and r-process production should have high [Eu/Fe] and [Eu/Ba] before Type Ia SNe and AGB stars eventually add Fe and Ba to the ISM. Whether the Ba deficiency in MOA-2006-BLG-99S can be explained by a lack of contributions from AGB stars depends on the relative timescales of Type Ia SN pollution and AGB pollution and whether the low [/Fe] values in MOA-2006-BLG-99S are the result of Type Ia pollution. If we assume that Type Ia SNe have contributed significantly to the abundances of MOA-2006-BLG-99S, which is reasonable, then AGB pollution must trail Type Ia SN production. The evidence on this point is mixed. Simmerer et al. (2004) saw, in addition to a wide range at any given metallicity, a rise in the [La/Fe] ratios at [Fe/H] . Because La, like Ba, is mostly due to the s-process, this would indicates the s-process from AGB stars is added before Fe from Type Ia SNe causes the [/Fe] ratios to turn over. On the other hand, Meléndez & Cohen (2007) argued based on the isotope ratios of Mg that 3-6 M⊙ stars did not start contributing to the halo until [Fe/H], at the same time or later than the Type Ia SNe. The [Ba/Fe] measured in OGLE-2006-BLG-265S is closer to the solar value, and suggests that by [Fe/H]=0.5 the Bulge had reached the same point in chemical evolution as the solar neighborhood, with substantial amounts of Ba supplied by the s-process in AGB stars balancing the iron supplied by Type Ia SNe. Ba abundances for Bulge stars with a wide range of metallicity would help clarify the origin of the Ba abundance in the Bulge.
6 Conclusions
The results for MOA-2006-BLG-99S demonstrate the unique information that can be obtained from high-resolution spectra of microlensed dwarfs in the Bulge. Because microlensing is not biased in metallicity, we can measure the MDF of the Bulge main-sequence stars when sufficient number of highly magnified Bulge dwarfs have been observed with high-dispersion spectrographs. However, the two dwarfs we have studied so far both have [Fe/H], which makes them more metal-rich than any of the M giants observed at high-resolution. If the temperatures and metallicities measured for the two dwarfs are accurate, then these stars are younger than the bulk of the Bulge population.
For many elements, the abundance ratios we measure in MOA-2006-BLG-99S are not surprising. The iron-peak and -elements (O, Mg, Si, Ca, and Ti) fall on the trend observed in the Bulge giants. The solar values for the [/Fe] ratios suggest that Type Ia SN ejecta are responsible for some of the Fe, which would be expected if these metal-rich stars were part of a younger population in the Bulge. The [C/Fe] and [N/Fe] ratios are also 0, suggesting that AGB stars have also begun to contribute these light elements to offset the contribution of Fe from Type Ia SNe. It is therefore unexpected to find [Ba/Fe]-. Such low [Ba/Fe] values, when found in the halo, imply that only Type II SNe and the r-process have polluted the gas, and not the s-process from AGB stars.
The C and N abundances we measure in MOA-2006-BLG-99S are unaffected by any mixing or dilution and therefore are the result of the chemical evolution of the Bulge. Comparing the total amount of C+N to that measured in Bulge giants, we conclude that only mild mixing, as expected in theoretical models, has occurred in the Bulge. This agrees with the assertions by Lecureur et al. (2007), Zoccali et al. (2006), and McWilliam et al. (2007) that the O, Na and Al abundances in Bulge giants should not have been affected by mixing. The [Na/Fe] and [Al/Fe] ratios for MOA-2006-BLG-99S fall on the lower end of the values seen in Bulge giants of this metallicity. The [Na/Fe] and [Al/Fe] ratios in giants are marked above all else by large scatter and more abundance ratios in dwarfs are needed before a comparison of scatter can be made.
We can use our measurements of the abundances of K, Cu and Zn, rare for Bulge stars, to exploit the different star formation history of the Bulge to study the nucleosynthesis sites of these elements. The supersolar [Cu/Fe] and subsolar [Zn/Fe] values agree with the model of Bisterzo et al. (2005) and the production of these two elements predominantly in Type II SNe. The chemical evolution of K is more difficult to understand, because the [K/Mg] value in the Bulge is similar to that in the metal-poor halo, although the production of K should be enhanced in metal-rich SNe.
Finally, we note that the standard microlensing technique of estimating the intrinsic color and magnitude of the source star by using the offset from the position of the red clump can be tested by deriving a temperature and gravity from the spectrum. For MOA-2006-BLG-99S, the photometric and spectroscopic temperature agree very well, although the agreement was considerably less good for OGLE-2006-BLG-265S.
In summary, the abundances in MOA-2006-BLG-99S provide unique information about the formation and evolution of the Bulge. Larger samples of dwarfs observed in this way would allow the derivation of the dwarf MDF and the trends in abundance ratios over a wide range of metallicity. By taking advantage of microlensing events in the Bulge, we can achieve this goal with a modest amount of telescope time.
| Ion | Wavelength | E.P. | log gf | EWstar | EWsun | Source |
|---|---|---|---|---|---|---|
| O I | 7771.941 | 9.15 | 0.370 | 101.5 | 70.2 | 1 |
| O I | 7774.161 | 9.15 | 0.220 | 86.7 | 60.1 | 1 |
| O I | 7775.390 | 9.15 | 0.000 | 71.1 | 47.4 | 1 |
| Na I | 5682.633 | 2.10 | 0.710 | 148.1 | 96.9 | 2 |
| Na I | 5688.194 | 2.10 | 0.400 | 150.6 | 118.7 | 2 |
| Na I | 6154.226 | 2.10 | 1.570 | 60.9 | 35.9 | 2 |
| Na I | 6160.747 | 2.10 | 1.270 | 82.3 | 55.8 | 2 |
| Mg I | 5711.088 | 4.33 | 1.870 | 140.6 | 112.7 | 2 |
| Mg I | 7387.689 | 5.75 | 1.270 | 141.2 | 70.6 | 2 |
| Al I | 7836.134 | 4.02 | 0.650 | 93.1 | 54.2 | 2 |
| Si I | 5665.555 | 4.93 | 1.940 | 89.2 | 40.2 | 2 |
| Si I | 5690.425 | 4.93 | 1.770 | 57.4 | 49.7 | 2 |
| Si I | 5772.146 | 5.08 | 1.650 | 69.9 | 51.9 | 2 |
| Si I | 6125.021 | 5.61 | 1.520 | 57.7 | 30.4 | 2 |
| Si I | 6142.483 | 5.62 | 1.500 | 61.8 | 32.3 | 2 |
| Si I | 6155.134 | 5.62 | 0.720 | 124.5 | 84.5 | 2 |
| Si I | 6237.319 | 5.61 | 1.050 | 90.9 | 63.9 | 2 |
| Si I | 6244.466 | 5.62 | 1.320 | 77.6 | 47.3 | 2 |
| Si I | 7415.948 | 5.61 | 0.850 | 115.0 | 85.5 | 2 |
| Si I | 7918.384 | 5.95 | 0.510 | 157.5 | 84.5 | 2 |
| Si I | 7932.348 | 5.96 | 0.370 | 131.8 | 92.3 | 2 |
| Si I | 7944.001 | 5.98 | 0.210 | 140.8 | 107.0 | 2 |
| K I | 7698.974 | 0.00 | 0.170 | syn | syn | 1 |
| Ca I | 5581.965 | 2.52 | 0.530 | 111.8 | 94.7 | 3 |
| Ca I | 5590.114 | 2.52 | 0.571 | 148.4 | 91.0 | 3 |
| Ca I | 6161.297 | 2.52 | 1.266 | 77.3 | 59.2 | 3 |
| Ca I | 6166.439 | 2.52 | 1.142 | 83.2 | 70.2 | 3 |
| Ca I | 6169.042 | 2.52 | 0.797 | 110.2 | 88.7 | 3 |
| Ca I | 6169.563 | 2.52 | 0.478 | 147.8 | 105.2 | 3 |
| Ca I | 6455.598 | 2.52 | 1.290 | 59.6 | 56.9 | 3 |
| Ca I | 6471.662 | 2.52 | 0.686 | 116.1 | 90.2 | 3 |
| Ca I | 6499.650 | 2.52 | 0.818 | 97.5 | 84.1 | 3 |
| Sc II | 5526.820 | 1.77 | 0.02 | syn | syn | 5 |
| Sc II | 5657.880 | 1.51 | 0.600 | syn | syn | 5 |
| Sc II | 6245.620 | 1.51 | 1.070 | syn | syn | 5 |
| Ti I | 5866.451 | 1.07 | 0.780 | 60.6 | 48.1 | 2 |
| Ti I | 6126.216 | 1.07 | 1.370 | 59.7 | 23.4 | 2 |
| Ti I | 6258.102 | 1.44 | 0.300 | 72.9 | 49.8 | 2 |
| Ti I | 6261.098 | 1.43 | 0.420 | 61.1 | 50.1 | 2 |
| Ti II | 5381.015 | 1.57 | 1.920 | 80.4 | 59.3 | 4 |
| Mn I | 5470.270 | 2.14 | 1.460 | syn | syn | 5 |
| Mn I | 6013.520 | 3.07 | 0.250 | syn | syn | 5 |
| Mn I | 6021.710 | 3.07 | 0.03 | syn | syn | 5 |
| Fe I | 5307.361 | 1.61 | 2.987 | 105.7 | 84.5 | 1 |
| Fe I | 5321.108 | 4.43 | 0.951 | 65.1 | 40.8 | 1 |
| Fe I | 5322.041 | 2.28 | 2.803 | 105.4 | 59.8 | 1 |
| Fe I | 5329.989 | 4.08 | 1.189 | 128.7 | 55.7 | 1 |
| Fe I | 5379.574 | 3.70 | 1.510 | 74.2 | 60.5 | 1 |
| Fe I | 5501.465 | 0.96 | 3.047 | 127.1 | 115.4 | 1 |
| Fe I | 5506.779 | 0.99 | 2.797 | 149.4 | 115.1 | 1 |
| Fe I | 5701.545 | 2.56 | 2.120 | 114.7 | 81.9 | 1 |
| Fe I | 5705.465 | 4.30 | 1.500 | 54.3 | 38.7 | 1 |
| Fe I | 6027.051 | 4.08 | 1.090 | 78.4 | 65.1 | 1 |
| Fe I | 6082.711 | 2.22 | 3.573 | 63.5 | 34.0 | 1 |
| Fe I | 6165.360 | 4.14 | 1.470 | 72.3 | 43.7 | 1 |
| Fe I | 6173.336 | 2.22 | 2.880 | 119.9 | 68.7 | 1 |
| Fe I | 6219.281 | 2.20 | 2.420 | 114.4 | 86.6 | 1 |
| Fe I | 6252.555 | 2.40 | 1.690 | 148.8 | 115.3 | 1 |
| Fe I | 6265.134 | 2.18 | 2.550 | 107.8 | 87.2 | 1 |
| Fe I | 6297.793 | 2.22 | 2.740 | 94.6 | 72.8 | 1 |
| Fe I | 6301.501 | 3.65 | 0.718 | 141.5 | 121.6 | 1 |
| Fe I | 6311.500 | 2.83 | 3.141 | 49.0 | 27.1 | 1 |
| Fe I | 6322.685 | 2.59 | 2.426 | 100.1 | 79.0 | 1 |
| Fe I | 6335.331 | 2.20 | 2.180 | 127.5 | 95.8 | 1 |
| Fe I | 6344.149 | 2.43 | 2.920 | 91.7 | 58.4 | 1 |
| Fe I | 6380.743 | 4.19 | 1.380 | 82.6 | 51.6 | 1 |
| Fe I | 6408.018 | 3.69 | 1.018 | 131.7 | 94.7 | 1 |
| Fe I | 6411.649 | 3.64 | 0.720 | 139.5 | 128.7 | 1 |
| Fe I | 6498.939 | 0.96 | 4.700 | 49.8 | 45.0 | 1 |
| Fe I | 6592.914 | 2.73 | 1.470 | 129.6 | 107.3 | 1 |
| Fe I | 6593.870 | 2.43 | 2.420 | 117.3 | 81.7 | 1 |
| Fe I | 6804.001 | 4.65 | 1.496 | 67.2 | 21.1 | 1 |
| Fe I | 6810.263 | 4.61 | 0.986 | 71.4 | 48.9 | 1 |
| Fe I | 6855.162 | 4.56 | 0.740 | 102.2 | 69.0 | 1 |
| Fe I | 6858.150 | 4.61 | 0.930 | 79.5 | 50.8 | 1 |
| Fe I | 7401.685 | 4.19 | 1.350 | 58.7 | 39.7 | 1 |
| Fe I | 7710.364 | 4.22 | 1.110 | 103.9 | 63.5 | 1 |
| Fe I | 7941.089 | 3.27 | 2.580 | 59.8 | 42.0 | 1 |
| Fe II | 6247.557 | 3.89 | 2.430 | 86.3 | 51.8 | 2 |
| Fe II | 6416.919 | 3.89 | 2.880 | 65.0 | 41.0 | 2 |
| Fe II | 6432.680 | 2.89 | 3.690 | 61.3 | 40.0 | 2 |
| Fe II | 6456.383 | 3.90 | 2.190 | 71.7 | 61.2 | 2 |
| Ni I | 5754.655 | 1.93 | 1.850 | 133.5 | 75.4 | 2 |
| Ni I | 5805.213 | 4.17 | 0.620 | 60.5 | 42.1 | 2 |
| Ni I | 6108.107 | 1.68 | 2.430 | 68.5 | 63.3 | 2 |
| Ni I | 6111.066 | 4.09 | 0.820 | 70.0 | 32.7 | 2 |
| Ni I | 6128.963 | 1.68 | 3.360 | 46.8 | 24.8 | 2 |
| Ni I | 6175.360 | 4.09 | 0.500 | 63.5 | 46.9 | 2 |
| Ni I | 6176.807 | 4.09 | 0.260 | 95.1 | 63.4 | 2 |
| Ni I | 6314.653 | 1.94 | 2.000 | 92.1 | 72.4 | 2 |
| Ni I | 6378.247 | 4.15 | 0.810 | 59.5 | 29.9 | 2 |
| Ni I | 6482.796 | 1.93 | 2.760 | 54.8 | 40.7 | 2 |
| Ni I | 6598.593 | 4.24 | 0.910 | 42.0 | 24.8 | 2 |
| Ni I | 6643.629 | 1.68 | 1.910 | 122.2 | 95.0 | 2 |
| Ni I | 6767.768 | 1.83 | 2.100 | 106.2 | 80.5 | 2 |
| Ni I | 6772.313 | 3.66 | 0.940 | 83.8 | 49.8 | 2 |
| Ni I | 7110.892 | 1.94 | 2.880 | 57.8 | 36.0 | 2 |
| Ni I | 7715.583 | 3.70 | 1.010 | 105.7 | 49.7 | 2 |
| Ni I | 7748.891 | 3.71 | 0.330 | 164.4 | 84.0 | 2 |
| Ni I | 7788.936 | 1.95 | 1.750 | 123.4 | 92.2 | 2 |
| Ni I | 7797.586 | 3.90 | 0.320 | 103.6 | 79.2 | 2 |
| Cu I | 5782.050 | 1.64 | 2.920 | syn | syn | 5 |
| Zn I | 4722.153 | 4.03 | 0.338 | syn | syn | 1 |
| Zn I | 4810.528 | 4.08 | 0.137 | syn | syn | 1 |
| Ba II | 6496.410 | 0.60 | 0.380 | syn | syn | 5 |
| Ion | log | [X/FeI]aa[X/Fe I] given for all species except Fe I, where [Fe I/H] is given. | Nlines | Solar | ||||
|---|---|---|---|---|---|---|---|---|
| meas. | GS98 | |||||||
| C (CH) | 8.8 | 0.26 | 0.04 | 0.22 | 0.20 | … | 8.4 | 8.52 |
| N (CN) | 8.2 | 0.56 | 0.06 | 0.43 | 0.20 | … | 7.9 | 7.92 |
| O I | 9.09 | 0.11 | 0.16 | 0.22 | 0.33 | 3 | 8.89 | 8.83 |
| Na I | 6.69 | 0.13 | 0.09 | 0.16 | 0.12 | 4 | 6.24 | 6.33 |
| Mg I | 8.18 | 0.21 | 0.16 | 0.25 | 0.17 | 2 | 7.66 | 7.58 |
| Al I | 6.98 | 0.16 | 0.11 | 0.22 | 0.10 | 1 | 6.51 | 6.47 |
| Si I | 7.98 | 0.10 | 0.06 | 0.13 | 0.10 | 12 | 7.56 | 7.55 |
| K I | 5.60 | 0.28 | 0.14 | 0.29 | 0.20 | 1 | 5.10 | 5.12 |
| Ca I | 6.58 | 0.29 | 0.09 | 0.16 | 0.23 | 9 | 6.31 | 6.36 |
| Sc II | 3.25 | 0.31 | 0.30 | 0.23 | 0.13 | 3 | 3.19 | 3.17 |
| Ti I | 5.25 | 0.23 | 0.05 | 0.17 | 0.27 | 4 | 4.94 | 5.02 |
| Ti II | 5.18 | 0.36 | 0.22 | 0.28 | 0.20 | 1 | 5.04 | 5.02 |
| Mn I | 5.62 | 0.13 | 0.09 | 0.12 | 0.08 | 3 | 5.34 | 5.39 |
| Fe I | 7.81 | 0.18 | 0.36 | … | 0.25 | 35 | 7.45 | 7.50 |
| Fe II | 7.81 | 0.28 | 0.18 | 0.19 | 0.25 | 4 | 7.63 | 7.50 |
| Ni I | 6.61 | 0.10 | 0.02 | 0.09 | 0.26 | 19 | 6.23 | 6.25 |
| Cu I | 4.40 | 0.23 | 0.01 | 0.20 | 0.10 | 1 | 4.05 | 4.21 |
| Zn I | 4.63 | 0.23 | 0.28 | 0.21 | 0.10 | 2 | 4.55 | 4.60 |
| Ba II | 2.25 | 0.43 | 0.61 | 0.32 | 0.20 | 1 | 2.50 | 2.13 |
| Source | C | N | O | Na | Mg | Al | Si | K | Ca | Sc | Ti | Mn | Ni | Cu | Zn | Ba |
|---|---|---|---|---|---|---|---|---|---|---|---|---|---|---|---|---|
| Bulge Stars | ||||||||||||||||
| Fulbright et al. (2007) | x | x | x | x | x | x | ||||||||||
| Rich & Origlia (2005) | ||||||||||||||||
| Rich et al. (2007) | x | x | x | x | x | x | ||||||||||
| Lecureur et al. (2007) | ||||||||||||||||
| Cunha & Smith (2006) | x | x | x | x | x | |||||||||||
| Halo/Disk Data | ||||||||||||||||
| Reddy et al. (2006) | x | x | x | x | x | x | x | x | x | x | x | x | x | x | ||
| Reddy et al. (2003) | x | x | x | x | x | x | x | x | x | x | x | x | x | x | x | |
| Feltzing et al. (2007) | x | |||||||||||||||
| Bensby & Feltzing (2006) | x | |||||||||||||||
| Bensby et al. (2005) | x | x | x | x | x | x | ||||||||||
| Bensby et al. (2004) | x | |||||||||||||||
| Bensby et al. (2003) | x | x | ||||||||||||||
| Chen et al. (2004) | x | x | x | x | x | x | x | x | x | x | ||||||
| Carretta et al. (2000) | x | x | ||||||||||||||
| Zhang et al. (2006) | x | |||||||||||||||
References
- Alvarez & Plez (1998) Alvarez, R., & Plez, B. 1998, A&A, 330, 1109
- Balachandran (1995) Balachandran, S. 1995, ApJ, 446, 203
- Alonso et al. (1996) Alonso, A., Arribas, S., & Martinez-Roger, C. 1996, A&A, 313, 873
- Baade (1946) Baade, W. 1946, PASP, 58, 249
- Barklem et al. (2000) Barklem, P. S., Piskunov, N., & O’Mara, B. J. 2000, A&AS, 142, 467
- Barklem et al. (2002) Barklem, P. S., Stempels, H. C., Allende Prieto, C., Kochukhov, O. P., Piskunov, N., & O’Mara, B. J. 2002, A&A, 385, 951
- Bensby et al. (2003) Bensby, T., Feltzing, S., & Lundström, I. 2003, A&A, 410, 527
- Bensby et al. (2004) Bensby, T., Feltzing, S., & Lundström, I. 2004, A&A, 415, 155
- Bensby & Feltzing (2006) Bensby, T., & Feltzing, S. 2006, MNRAS, 367, 1181
- Bensby et al. (2005) Bensby, T., Feltzing, S., Lundström, I., & Ilyin, I. 2005, A&A, 433, 185
- Bernstein et al. (2003) Bernstein, R., Shectman, S. A., Gunnels, S. M., Mochnacki, S., & Athey, A. E. 2003, Proceedings of the SPIE, 4841, 1694
- Bisterzo et al. (2005) Bisterzo, S., Pompeia, L., Gallino, R., Pignatari, M., Cunha, K., Heger, A., & Smith, V. 2005, Nuclear Physics A, 758, 284
- Carretta et al. (2000) Carretta, E., Gratton, R. G., & Sneden, C. 2000, A&A, 356, 238
- Castelli & Kurucz (2003) Castelli, F., & Kurucz, R. L. 2003, Modelling of Stellar Atmospheres, 210, 20
- Cayrel et al. (2004) Cayrel, R., et al. 2004, A&A, 416, 1117
- Chen et al. (2000) Chen, Y. Q., Nissen, P. E., Zhao, G., Zhang, H. W., & Benoni, T. 2000, A&AS, 141, 491
- Chen et al. (2003) Chen, Y. Q., Zhao, G., Nissen, P. E., Bai, G. S., & Qiu, H. M. 2003, ApJ, 591, 925
- Chen et al. (2004) Chen, Y. Q., Nissen, P. E., & Zhao, G. 2004, A&A, 425, 697
- Cunha & Smith (2006) Cunha, K., & Smith, V. V. 2006, ApJ, 651, 491
- Cunha et al. (2007) Cunha, K., Sellgren, K., Smith, V. V., Ramirez, S. V., Blum, R. D., & Terndrup, D. M. 2007, ArXiv e-prints, 707, arXiv:0707.2610
- Demarque et al. (2004) Demarque, P., Woo, J.-H., Kim, Y.-C., & Yi, S. K. 2004, ApJS, 155, 667
- Feltzing et al. (2007) Feltzing, S., Fohlman, M., & Bensby, T. 2007, A&A, 467, 665
- Feltzing & Gilmore (2000) Feltzing, S., & Gilmore, G. 2000, A&A, 355, 949
- Fulbright et al. (2006) Fulbright, J. P., McWilliam, A., & Rich, R. M. 2006, ApJ, 636, 821
- Fulbright et al. (2007) Fulbright, J. P., McWilliam, A., & Rich, R. M. 2007, ApJ, 661, 1152
- Gould et al. (2006) Gould, A., et al. 2006, ApJ, 644, L37
- Gratton & Sneden (1987) Gratton, R. G., & Sneden, C. 1987, A&A, 178, 179
- Grevesse & Sauval (1998) Grevesse, N., & Sauval, A. J. 1998, Space Science Reviews, 85, 161
- Griest & Safizadeh (1998) Griest, K. & Safizadeh, N. 1998, ApJ, 500, 37
- Gustafsson et al. (1999) Gustafsson, B., Karlsson, T., Olsson, E., Edvardsson, B., & Ryde, N. 1999, A&A, 342, 426
- Holtzman et al. (1998) Holtzman, J.A., Watson, A.M., Baum, W.A., Grillmair, C.J., Groth, E.J., Light, R.M., Lynds, R., & O’Neil, E.J. 1998, AJ, 115, 1946
- Johnson et al. (2007) Johnson, J. A., Gal-Yam, A., Leonard, D. C., Simon, J. D., Udalski, A., & Gould, A. 2007, ApJ, 655, L33
- Johnson et al. (2006) Johnson, J. A., Ivans, I. I., & Stetson, P. B. 2006, ApJ, 640, 801
- Kurucz et al. (1984) Kurucz, R. L., Furenlid, I., Brault, J., & Testerman, L. 1984, National Solar Observatory Atlas, Sunspot, New Mexico: National Solar Observatory, 1984,
- Lambert & Reddy (2004) Lambert, D. L., & Reddy, B. E. 2004, MNRAS, 349, 757
- Lecureur et al. (2007) Lecureur, A., Hill, V., Zoccali, M., Barbuy, B., Gómez, A., Minniti, D., Ortolani, S., & Renzini, A. 2007, A&A, 465, 799
- Lecureur et al. (2008) Lecureur, A. et al. 2008, in prep
- McWilliam & Rich (1994) McWilliam, A., & Rich, R. M. 1994, ApJS, 91, 749
- McWilliam et al. (1995) McWilliam, A., Preston, G. W., Sneden, C., & Searle, L. 1995, AJ, 109, 2757
- McWilliam et al. (2003) McWilliam, A., Rich, R. M., & Smecker-Hane, T. A. 2003, ApJ, 592, L21
- McWilliam et al. (2007) McWilliam, A., Matteucci, F., Ballero, S., Rich, R. M., Fulbright, J. P., & Cescutti, G. 2007, ArXiv e-prints, 708, arXiv:0708.4026
- Mao & Paczyński (1991) Mao, S. & Paczyński, B. 1991, ApJ, 374, L37
- Mashonkina et al. (1999) Mashonkina, L., Gehren, T., & Bikmaev, I. 1999, A&A, 343, 519
- Matteucci et al. (1993) Matteucci, F., Raiteri, C. M., Busson, M., Gallino, R., & Gratton, R. 1993, A&A, 272, 421
- Matteucci et al. (1999) Matteucci, F., Romano, D., & Molaro, P. 1999, A&A, 341, 458
- Meléndez & Cohen (2007) Meléndez, J., & Cohen, J. G. 2007, ApJ, 659, L25
- Mishenina et al. (2002) Mishenina, T. V., Kovtyukh, V. V., Soubiran, C., Travaglio, C., & Busso, M. 2002, A&A, 396, 189
- Moore et al. (1966) Moore, C. E., Minnaert, M. G. J. & Houtgast, J. 1966. The Solar Spectrum 2935Å- 8770 Å, US Govt. Printing Office, Washington, D. C.
- Ortolani et al. (1995) Ortolani, S., Renzini, A., Gilmozzi, R., Marconi, G., Barbuy, B., Bica, E., & Rich, R. M. 1995, Nature, 377, 701
- Pickering et al. (2001) Pickering, J. C., Thorne, A. P., & Perez, R. 2001, ApJS, 132, 403
- Piskunov et al. (1995) Piskunov, N. E., Kupka, F., Ryabchikova, T. A., Weiss, W. W., & Jeffery, C. S. 1995, A&AS, 112, 525
- Ramírez et al. (2000) Ramírez, S. V., Stephens, A. W., Frogel, J. A., & DePoy, D. L. 2000, AJ, 120, 833
- Rich & Origlia (2005) Rich, R. M., & Origlia, L. 2005, ApJ, 634, 1293
- Rich et al. (2007) Rich, R. M., Origlia, L., & Valenti, E. 2007, ApJ, 665, L119
- Ramírez & Meléndez (2005) Ramírez, I., & Meléndez, J. 2005, ApJ, 626, 465
- Reddy et al. (2006) Reddy, B. E., Lambert, D. L., & Allende Prieto, C. 2006, MNRAS, 367, 1329
- Reddy et al. (2003) Reddy, B. E., Tomkin, J., Lambert, D. L., & Allende Prieto, C. 2003, MNRAS, 340, 304
- Rich (1988) Rich, R. M. 1988, AJ, 95, 828
- Sadler et al. (1996) Sadler, E. M., Rich, R. M., & Terndrup, D. M. 1996, AJ, 112, 171
- Shetrone (1996) Shetrone, M. D. 1996, AJ, 112, 1517
- Simmerer et al. (2004) Simmerer, J., Sneden, C., Cowan, J. J., Collier, J., Woolf, V. M., & Lawler, J. E. 2004, ApJ, 617, 1091
- Smith & Raggett (1981) Smith, G., & Raggett, D. S. J. 1981, Journal of Physics B Atomic Molecular Physics, 14, 4015
- Terndrup (1988) Terndrup, D. M. 1988, AJ, 96, 884
- Udalski et al. (2005) Udalski, A., et al. 2005, ApJ, 628, L109
- Whitford & Rich (1983) Whitford, A. E., & Rich, R. M. 1983, ApJ, 274, 723
- Yi et al. (2001) Yi, S., Demarque, P., Kim, Y.-C., Lee, Y.-W., Ree, C. H., Lejeune, T., & Barnes, S. 2001, ApJS, 136, 417
- Yoo et al. (2004a) Yoo, J., et al. 2004a, ApJ, 603, 139
- Zhang et al. (2006) Zhang, H. W., Gehren, T., Butler, K., Shi, J. R., & Zhao, G. 2006, A&A, 457, 645
- Zoccali et al. (2003) Zoccali, M., et al. 2003, A&A, 399, 931
- Zoccali et al. (2006) Zoccali, M., et al. 2006, A&A, 457, L1
- Zoccali et al. (2008) Zoccali, M., et al. 2008, in prep