Hydrogen Dissociation and Diffusion on Ni and Ti -doped Mg(0001) Surfaces
Abstract
It is well known, both theoretically and experimentally, that alloying MgH2 with transition elements can significantly improve the thermodynamic and kinetic properties for H2 desorption, as well as the H2 intake by Mg bulk. Here we present a density functional theory investigation of hydrogen dissociation and surface diffusion over Ni-doped surface, and compare the findings to previously investigated Ti-doped Mg(0001) and pure Mg(0001) surfaces. Our results show that the energy barrier for hydrogen dissociation on the pure Mg(0001) surface is high, while it is small/null when Ni/Ti are added to the surface as dopants. We find that the binding energy of the two H atoms near the dissociation site is high on Ti, effectively impeding diffusion away from the Ti site. By contrast, we find that on Ni the energy barrier for diffusion is much reduced. Therefore, although both Ti and Ni promote H2 dissociation, only Ni appears to be a good catalyst for Mg hydrogenation, allowing diffusion away from the catalytic sites. Experimental results corroborate these theoretical findings, i.e. faster hydrogenation of the Ni doped Mg sample as opposed to the reference Mg or Ti doped Mg.
I Introduction
Safe and efficient hydrogen storage is one of the biggest barriers to the more wide spread usage of hydrogen as an energy carrier or fuel. Currently, commercial solutions are based on liquid or compressed gas storage methods, which are inefficient and have safety issues. Alternative storage methods include metal hydrides, which are formed by the interaction between a suitable metal and hydrogen. The relatively strong metal-hydrogen bonds provide an intrinsically safe storage medium. The release of hydrogen from the hydride is then achieved by heating the material above a certain decomposition temperature. There are a large number of metals in nature that form hydrides, however, only the lighter ones are thought to be suitable candidates for mobile hydrogen storage purposes (see schlapzutt01 for an overview). Beside being light weight, a hydride will need to have good cyclability (several hundred times with little loss of performance), fast adsorption/desorption kinetics (the hydride should form/decompose on a time scale of minutes) and low decomposition temperature (ideally between 20 and 100 Celsius).
Magnesium is a good case study due to its lightweight, low cost, cyclability and the high H storage capacity of 7.6% by weight once the hydride MgH2 is formed schwarz99 . However, its commercial application is still on hold for practical issues due to low H absorption/desorption kinetics and high working temperatures bobet00 . The strong bond between Mg and hydrogen provides MgH2 with high thermodynamic stability, which has an enthalpy of formation of about -76 kJ/mol yamaguchi94 , and a decomposition temperature of more than 300 Celsius bogdanovic99 . The slow kinetics may be explained by the high energy barrier which needs to be overcome (see for example sprunplu91 ) to dissociate the H2 molecule due to the tendency of Mg to repel the s-electron of H because of the Pauli exclusion principle hamnor95 .
A step forward in improving hydrogen reaction kinetics has been achieved by the mechanical ball milling of MgH2 with transition elements (see oelerich01 and references therein). The hydrogen storage properties of mechanically milled powders improves because of the reduced powder size (see for example zaluski95 ; liang99 ; zaluska99 ; shang04 and references therein), which shorten the diffusion distance of H into bulk Mg for the formation of the hydride. There are many experimental and theoretical papers in the literature showing that the hydriding properties of MgH2 are further enhanced by the addition of traces of transition metals which act as a catalyst (see for example yavari03 ; liang04 ; shang04 ; song04 ; vegge05 and references therein). In particular, alloying Mg with Ni can slightly improve the thermodynamic properties of the hydride by favouring H2 adsorption/dissociation and consequent atomic hydrogen absorption/desorption due to a weakening of the bonding between Mg and H atoms (see for example liang99 ; shang04 ; song04 ; vegge05 ; hanada05 and references therein).
While from theoretical calculations the destabilization effect of Ni on MgH2 appears second only to Cu (see song04 ), experimentally Ni shows the highest kinetics, with Cu falling behind. As suggested by Shang et al. shang04 , Cu results are disadvantageous for H desorption probably because of the formation of a MgCu2 compound. Recently, a new method of chemical fluid deposition in supercritical fluids has been used on metal hydrides bobet07 . Even sparser literature exists for the activation barrier of hydrogen dissociation on a transition metal doped surface, which includes only the theoretical calculations made by Du et al. du05 ; du06 ; du07 within DFT (RPBE) for both the pure Mg(0001), and Ti and Pd incorporated Mg surfaces. Their results show that the dissociation barrier of hydrogen on the Ti doped Mg surface is greatly reduced (in fact, there is no barrier at all) due to the strong interaction between the hydrogen orbital and the Ti orbital, however, strong binding of the two H atoms near the Ti site prevents easy diffusion, reducing therefore the efficacy of the catalyst for Mg hydrogenation du07 . Palladium doping appears to both lower the dissociation barrier and the diffusion barrier, suggesting a better catalytic activity. Their findings are consistent with the experimentally observed trend of generally improved hydrogen absorption kinetics when Mg surfaces are doped with transition metals, as previously mentioned.
To our knowledge, so far there is no published theoretical investigation of H2 dissociation and corresponding activation barrier on a Ni-incorporated Mg surface, nor a systematic investigation of the catalytic effect of other transition metal dopants apart from the above mentioned studies on the Ti-doped and Pd-doped Mg surfaces presented by Du et al. du05 ; du06 ; du07 . There are a few theoretical papers about the dissociation of molecular hydrogen on a pure Mg surface where the corresponding activation barrier has been effectively calculated. These investigations were based on a jellium model and potential energy surface(PES) calculations within density functional theory (DFT) with the local density approximation(LDA) or generalised gradient corrections (RPBE) hjelmberg79 ; johansson81 ; norskhoum81 ; bird93 ; vegge04 .
For the purpose of a larger scale investigation, we have performed DFT calculations for hydrogen dissociation and diffusion on a Ni-doped Mg surface, accompanied by analogous calculations on a Ti-doped Mg surface for a consistency check with the recently reported theoretical values. This study should be regarded as a first step in order to build up a global picture of the dissociative chemisorption of hydrogen when doping the Mg surface with different transition metals. The main purpose of this article is to try to understand the observed large enhancement of the kinetics of hydrogen adsorption by Mg when it is doped with a small quantity of Ni, but not when it is doped with Ti. The computational results are supported by experimental data where a Ni doped Mg sample is hydrogenated substantially faster than the reference Mg or Ti doped Mg.
II Computational method
DFT calculations were performed with the ab-initio simulation package VASP vasp using the projector augmented wave (PAW) method blochl94 ; kresse99 and the PBE exchange-correlation functional pbe . An efficient charge density extrapolation was used to speed up the calculations alfe99 . A plane-wave basis set was used to expand the electronic wave-functions with a plane-wave energy cut-off of 270 eV, which guarantees convergence of adsorption energies within 1 meV. For completeness, Mg bulk parameters were also calculated using the LDA functional. Monkhorst-Pack k-points were used to sample the Brillouin zone monk . A smearing function of the Methfessel-Paxton (MP) type (product of a Gaussian times a th-order Hermite polynomial) methfessel89 was used throughout. Figs. 1, 3 - 9 and 13 have been made using the XCRYSDEN software xcrysden . The exact values of the various parameters used in the calculations will be reported below in the relevant sections.
Activation energies have been calculated using the nudged elastic band (NEB) method neb . A sufficient number of replicas has to be used in order to predict accurately a minimum energy path (MEP), for most cases we repeated the calculations with a different number of replicas until convergence of the activation energy and main features of the MEP were observed. The total number of images actually used in each case is reported where relevant in the following sections.
III Theoretical Results
III.1 Bulk Mg, Ti and Ni, and the Mg(0001) surface
Magnesium bulk crystal at ambient conditions has the hexagonal closed packed (hcp) structure. Several preliminary tests were first carried out using the PBE version of the PAW potential of magnesium, which only includes the 3 electrons in valence and has a core radius of 1.1 Å. These included: the energy dependence on the ratio for different k-points meshes, from a minimum of 56 to a maximum of 880 k-points in the irreducible wedge of the Brillouin zone (IBZ); different values of for the MP smearing functions and different smearing widths; and different plane-wave cutoffs. To calculate the bulk structural properties of Mg, energy versus volume curves were fitted to a Birch-Murnaghan equation of state murna . We found that with a 18x18x12 k-point mesh (259 points in the IBZ), and a smearing width of 0.2 eV, the zero pressure equilibrium volume and bulk modulus of bulk Mg were converged to within 0.2% and 0.3% respectively. Similar convergence results were obtained with the standard LDA potentials, which also has only the 3 electrons in valence and a core radius of 1.1 Å. Results are summarised in Table 1, together with results from previous theoretical calculations. The well known trend of LDA to overestimate the bulk modulus and underestimate the lattice parameter wacho is apparent.
Finally, we have tested PBE and LDA PAW potentials with 2 and 3 electrons in valence. These potentials still have core radii of 1.1 Å but require an higher energy cut-off value of 350 eV. The structural parameters obtained with these potentials are essentially identical to those obtained with the previous potentials. Therefore, in the rest of the work we only used the standard Mg potentials.
| a (Å) | c/a | V (Å3) | k0 (GPa) | dk0 | |
| This work | 3.19(3.13)111Reported values are those from PAW PBE(LDA) calculations which do not include room temperature thermal expansion. | 1.621(1.621)111Reported values are those from PAW PBE(LDA) calculations which do not include room temperature thermal expansion. | 22.85(21.59)111Reported values are those from PAW PBE(LDA) calculations which do not include room temperature thermal expansion. | 36.8(40.5)111Reported values are those from PAW PBE(LDA) calculations which do not include room temperature thermal expansion. | 3.9(4.3)111Reported values are those from PAW PBE(LDA) calculations which do not include room temperature thermal expansion. |
| Other calculations | 3.19222Ref. du05, ., 3.18(3.13)333Ref. wacho, from DFT GGA(LDA) calculations., | 1.615(1.616)333Ref. wacho, from DFT GGA(LDA) calculations., | 22.97(21.66)444Ref. mehta06, from PAW GGA(LDA) calculations. | 35.5(40.2)333Ref. wacho, from DFT GGA(LDA) calculations., | 4.0(4.1)444Ref. mehta06, from PAW GGA(LDA) calculations. |
| 3.20(3.14)444Ref. mehta06, from PAW GGA(LDA) calculations. | 1.624(1.622)444Ref. mehta06, from PAW GGA(LDA) calculations. | 36.0(40.1)444Ref. mehta06, from PAW GGA(LDA) calculations. | |||
| Expt. | [3.21]555Ref. ashmerm, . | [1.624]555Ref. ashmerm, . | [23.24]666Ref. webofel, . | [35.4]555Ref. ashmerm, ., [36.8 3.0]777Ref. errandonea03, . | [4.3 0.4]777Ref. errandonea03, . |
| Ecoh(eV) | -1.50111Reported values are those from PAW PBE(LDA) calculations which do not include room temperature thermal expansion., -1.50(-1.78)333Ref. wacho, from DFT GGA(LDA) calculations. | ||||
| Expt. | -1.51888Ref. kittel, . | ||||
| Esurf(eV/atom) | 0.30111Reported values are those from PAW PBE(LDA) calculations which do not include room temperature thermal expansion., 0.30(0.35)333Ref. wacho, from DFT GGA(LDA) calculations., 0.34999Ref. wright94, from ab initio LDA calculations., 0.32101010Ref. ismail00, from ab initio LDA calculations. | ||||
| Expt. | 0.28111111Ref. hayden81, ., 0.33121212Ref. tyson77, . | ||||
From our PBE calculations (see Table 1), we derive a lattice constant of 3.19 Å, in error of just 0.6% with respect to the experimental value ashmerm . The zero pressure bulk modulus is 36.8 GPa, and the value of at the equilibrium volume is 1.621, both in very good agreement with the experimental values (we note however that these calculations do not include room temperature thermal expansion, which are present in the experimental data).
Titanium is also hcp crystal. We used the standard version of the PBE PAW pseudopotential for Ti, which has a core radius of 1.2 Å, and we used a 18x18x12 k-point grid. The resulting values for the structural parameters were Å and GPa, and the value of at the equilibrium volume was 1.583, in good agreement with those previously found with theoretical and experimental investigations (see Refs. vohspen01, ; zopmish03, ; jahnatek05, and references therein).
To study bulk Ni we also used the standard version of the PBE PAW potential, which has a core radius of 1.1 Å. Ni bulk has a face centred cubic crystal structure, with a small magnetic moment of 0.61 under ambient conditions kittel , so we performed spin polarised total energy calculations. The calculations were performed with a 13x13x13 grid of k-points. We found a lattice parameter Å and a bulk modulus GPa, which compare well with the experimental data of 3.524 Å and 186 GPa respectively kittel ; handbook . The zero pressure magnetic moment is 0.63 , which is also close to the experimental value of 0.61 . The values we found for , and are in agreement with those from other GGA and PBE calculations kresshafn00 ; greemavri05 ; pozzo07 .
Surfaces have been modelled using periodic slabs, with several atomic layers (from 3 to 13) and a large vacuum thickness (5-18 Å), defined as the distance between two opposite facing surfaces. We used a 18x18x1 k-point grid for the 1x1 surface primitive cell. The positions of the atoms in the three topmost layers were allowed to relax, while the rest were kept at the bulk interatomic distances. Good convergence in the calculated surface energies and relaxations of the topmost atomic layers was achieved with five layer slabs (corresponding to a slab thickness of about 13 Å) and a vacuum region thickness of about 10 Å. We found that the topmost layer has an inward relaxation of about 1.4 %, in good agreement with the inferred experimental zero temperature value of 1.7% davis92 .
III.2 H2 dissociation and H diffusion on the pure Mg and the Ti-doped Mg surfaces
Hydrogen adsorption energies on the Mg(0001) surface were determined at low coverage in four possible sites: top, bridge, hollow-fcc and hollow-hcp (see Fig. 1). These adsorption energies are defined as (H) (MgH)-[(Mg) + 1/2 (H2)], where (MgH) is the energy of the slab with one H adsorbed on the surface, (Mg) is the energy of the bare slab and (H2) the energy of the isolated hydrogen molecule, calculated by placing the H2 molecule in a large cubic box of sides 13.5 Å.
| Ads. sites | Eads (eV) | Eads (eV) |
|---|---|---|
| (2x2) | (3x3) | |
| Top | 0.75 | 0.74 |
| bridge | 0.12 | 0.13 |
| hollow (hcp) | -0.03 | -0.03 |
| hollow (fcc) | -0.05 | -0.04 |
Calculations have been performed on 2x2 (corresponding to 0.25 ML coverage, ML=monolayer) and checked against results obtained from 3x3 (corresponding to 0.11 ML coverage) surface unit cells, with differences between the two sets of calculations of less than 0.01 eV, thus implying that the results effectively correspond to those for an isolated H2 molecule. The two sets of calculations have been performed with equivalent grids of k-points, 9x9x1 and 6x6x1 for the 2x2 and the 3x3 surface unit cells respectively.
The values for the adsorption energies of atomic hydrogen in different adsorption sites on the pure Mg surface are reported in Table 2. These compare well with previous theoretical results bird93 . It is clear that there is a strong preference for the hollow sites, with a small preference for the fcc hollow site.
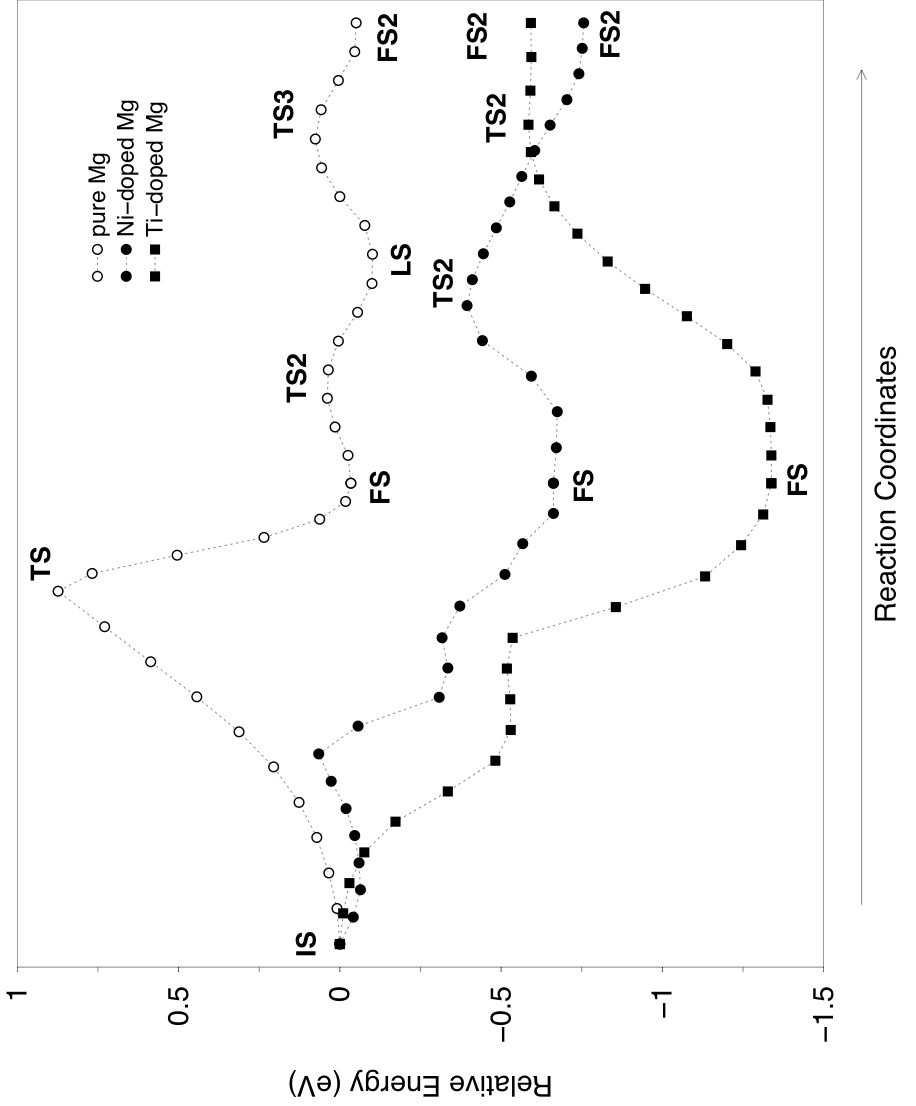
We performed NEB calculations for H2 dissociation over two possible sites (bridge and top). These have been accompanied by careful tests on supercell size, number of layers in the slab and number of replicas in the NEB calculation to obtain the minimum energy path and the activation barrier. We found that a 2x2 supercell, 5 layers and 5 replicas are enough to obtain activation energies converged to within 0.02 eV. The first MEP is rather featureless (IS TS FS), and it is well approximated also by 5 replicas, although in Fig. 2 we report the MEP obtained with 17 replicas.
Of the two sites investigated, we found that H2 prefers to dissociate over a bridge site (see Fig. 3) with an activation energy of about 0.87 eV (about 0.6 eV lower than that obtained for dissociation over a top site), in agreement with previous DFT calculations norskhoum81 ; bird93 ; vegge04 ; du05 and experimental findings sprunplu91 , as reported in Table 3.
| Ea (pure Mg) | 0.87111This work., 0.4222Ref. hjelmberg79, for a jellium system.,333Ref. bird93, , from DFT LDA calculations ans PES. This lower value as compared to other calculations is explained as due to the well known LDA overbinding., 0.5444Ref. johansson81, for a jellium system.,555Ref. norskhoum81, for a jellium system and PES., 1.15666Ref. vegge04, from DFT RPBE., 1.05777Ref. du05, , from DFT PAW RPBE calculations (see also discussion in main text)., 0.95888Ref. arboleda04, from PES calculations. |
|---|---|
| Expt. | 1.0999Ref. sprunplu91, . |
| Ea (Ni-doped Mg) | 0.06111This work. |
| Ea (Ti-doped Mg) | null111This work., negligible777Ref. du05, , from DFT PAW RPBE calculations (see also discussion in main text). |
The small difference between our findings and those of Vegge vegge05 and Du et al. du05 are due to their use of RPBE instead of PBE, and different k-point meshes.
We then performed a second NEB calculation to obtain the MEP for the diffusion of one of the H atoms on the surface from one fcc to a second fcc site (FS TS2 LS TS3 FS2; see Fig. 4). This MEP (calculated with 17 replicas) is also displayed in Fig. 2, as a continuation of the dissociation MEP, and shows that the highest energy barrier for surface diffusion is only eV, which agrees very well with the calculations of Du et al. du07 . This low energy barrier clearly indicate fast diffusion even at room temperature.
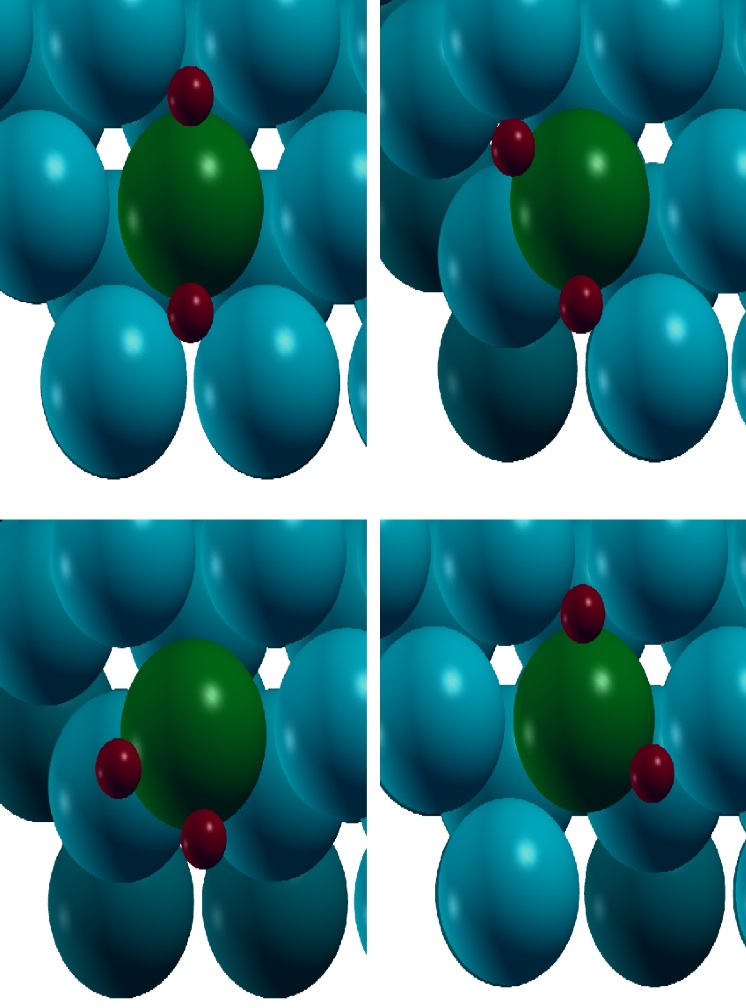
Before repeating the calculations on the Ti-doped surface, we tested all four possible sites for H adsorption after dissociation (see Fig. 5), and we found that atomic hydrogen prefers to adsorb into two of the possible three hollow-fcc sites around the Ti atom. The dissociation activation barrier was calculated using 9 and 17 replicas, with 9 being enough to display the main features of the MEP (IS FS; see Fig. 6), although in Fig. 2 we display the results obtained with 17 replicas. Our findings are very similar to the previous results of Du et al. du05 ; du07 , i.e. there is no barrier for hydrogen dissociation on a Ti-doped Mg surface, and a barrier of almost 0.8 eV for diffusing away from the Ti sites (FS TS2 FS2; see Fig. 7), which therefore becomes the rate limiting step in the reaction du07 .
III.3 H2 dissociation and diffusion on a Ni-doped Mg surface
Having benchmarked our calculations on the pure Mg and the Ti-doped Mg surfaces, we now come to the main purpose of the paper, which is to study the effect of Ni doping of the Mg(0001) surface on the activation barriers for H2 dissociation and diffusion on the surface.
On the Mg(0001) surface, we found that Ni is non-magnetic, so all calculations have been performed without including spin-polarisation.
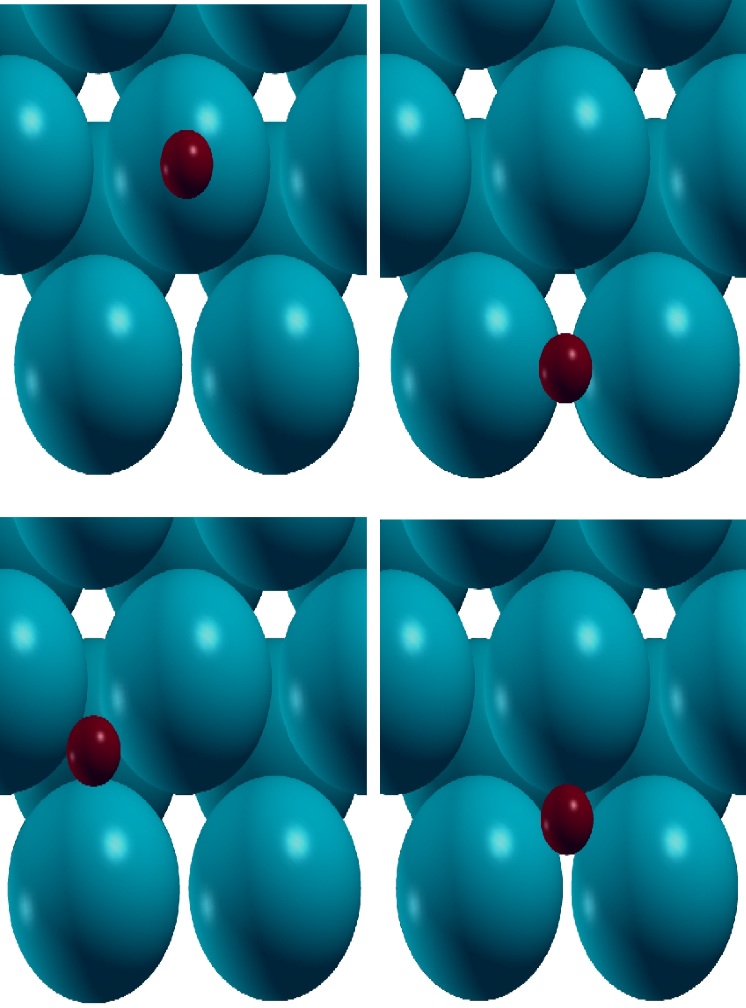
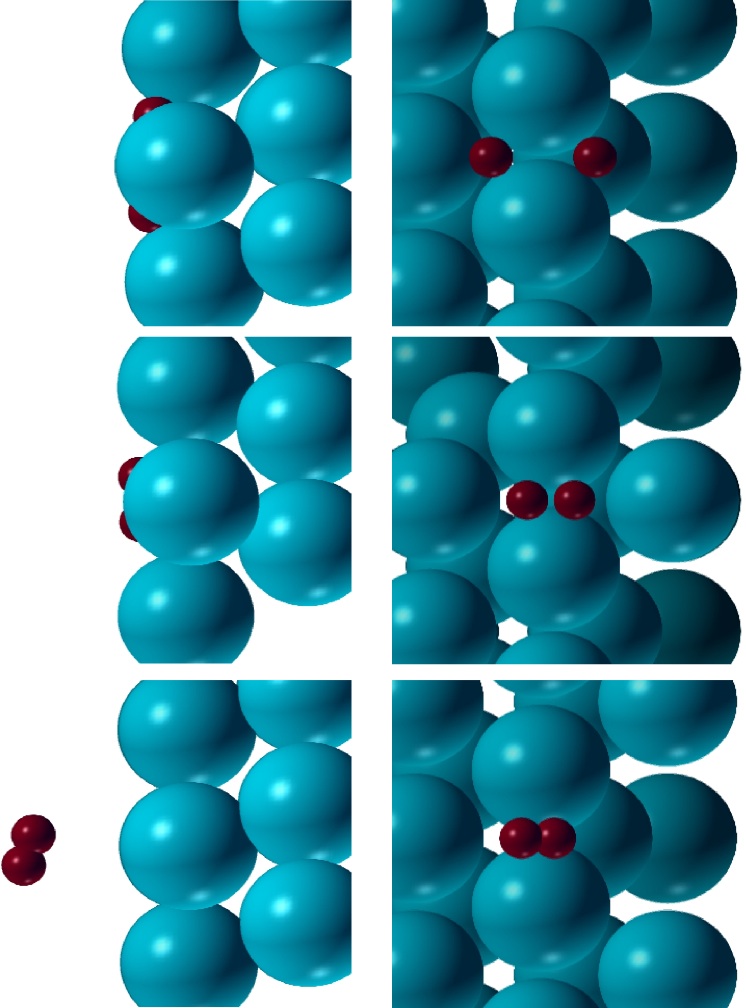
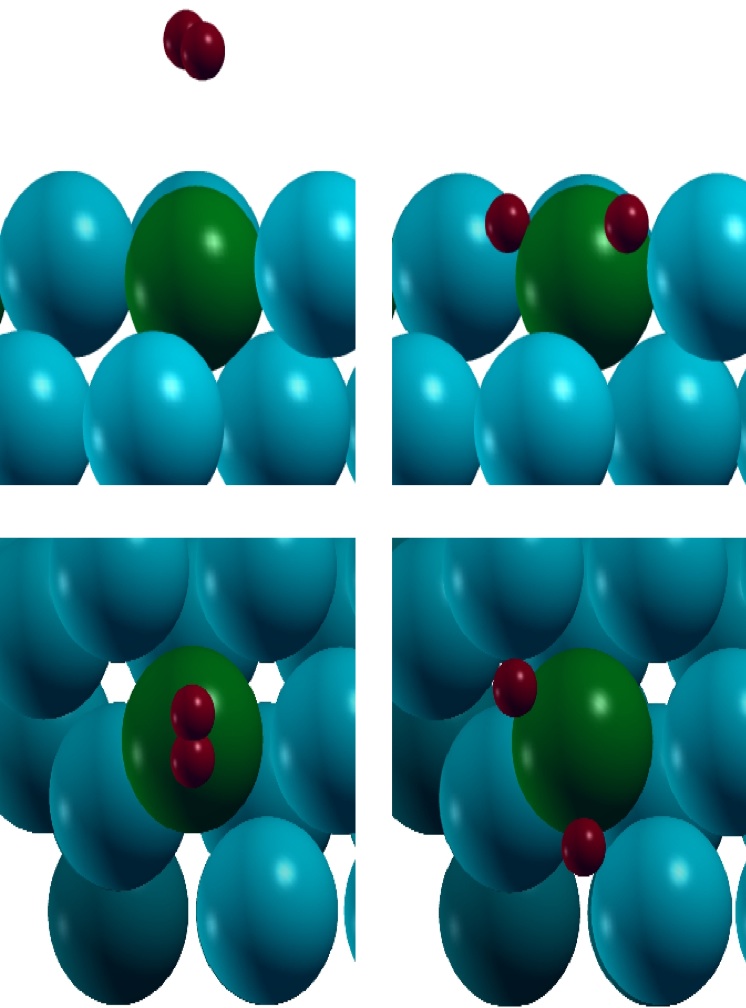
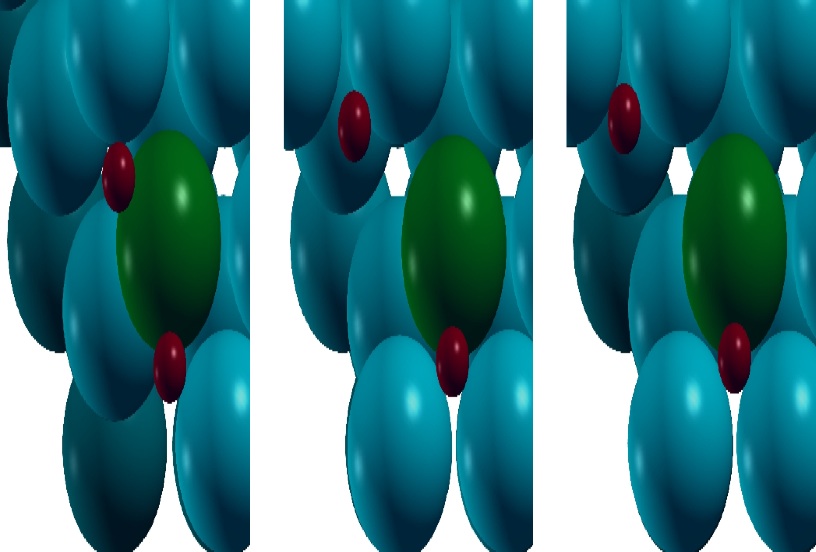
After dissociating on top of a Ni atom, the two H atoms can adsorb into four different hollow sites, as shown in Fig. 5. The most stable final state is found to be the one where the H atoms adsorb into two nearby hollow-hcp sites (see Fig. 5, bottom-right corner. We also found that the configuration on the bottom-left corner was unstable, with the hydrogen atoms repelled by the Nickel atom and squeezed between nearby Mg atoms). Figure 8 shows the dissociation of the hydrogen molecule over the Ni atom as viewed from side (top panel figures) and top (bottom panel figures) positions respectively at the IS, TS and FS. Note that on the Ni-doped Mg surface the molecule at the TS is much higher than on the pure Mg (0001) surface (see respectively Figs. 8 and 3), being at Åand Å over the two surfaces respectively.
NEB calculations were run with different numbers of replicas, and we found that 9 replicas are enough for a precise calculation of the energy barrier to within 1 meV. The resulting activation barrier for H2 dissociation on a Ni-incorporated Mg surface is only 0.06 eV, against 0.87 eV found for the pure Mg surface. In Fig. 2 we display the MEP obtained from a calculation with 17 replicas (IS TS FS).
The NEB diffusion calculation was also performed with 17 replicas (FS TS2 FS2; see Fig. 9) and shows an energy barrier of only 0.27 eV, which is only slighlty higher than the diffusion barrier on the pure Mg surface, and would also allow fast diffusion even at room temperature. We note that this barrier is similar to the one found on the Pd-doped surface by Du at al. du07 , although in that case the rate limiting step is the dissociation of the H2 molecule with an energy barrier of 0.305 eV.
This suggests that Ni should be an even better catalyst than Pd for the hydrogenation of Mg.
As a final note we would like to point out an interesting analogy with H2 dissociation on pure transition metal surfaces. In particular, on the pure Ni(111) surface Kresse kresse00 calculated an energy barrier of only 0.015 eV using DFT PAW GGA. This is similar to our value of 0.06 eV on the Ni-doped Mg surface, however, we note that when the same 4x4x1 k-point sampling grid is used we find an energy barrier of 0.014 eV on the Ni-doped Mg surface, which is therefore very close to the value found by Kresse kresse00 . These calculations are also consistent with potential energy calculations of Arboleda et al. arboleda04 , also performed with a 4x4x1 k-point grid. The small barrier for hydrogen dissociation on Ni(111) is also confirmed by experiments rendulic89 ).
Analogously, the behaviour of H2 dissociation over the Ti-doped Mg surface appears to be similar to that obtained on the pure Ti(111) surface: the null activation barrier we find with a smaller 4x4x1 grid compares with theoretical results found over a Ti (0001) surface with an analogous grid nobuhara04 ; arboleda04 . In other words, this seems to suggest that the value of the activation barrier for hydrogen dissociation over a transition-metal doped Mg surface is similar to the activation barrier for H2 dissociation over the corresponding pure transition-metal surface.
| Surface | (eV) | HsTS-IS (eV) | Ea (eV) | EFS-IS (eV) |
|---|---|---|---|---|
| Mg pure | – | -1.43 | 0.87 | -0.04 |
| Ni-doped Mg | -0.79 | -0.77 | 0.06 | -0.66 |
| Ti-doped Mg | +1.08 | – | null | -1.34 |
III.4 Electronic structure
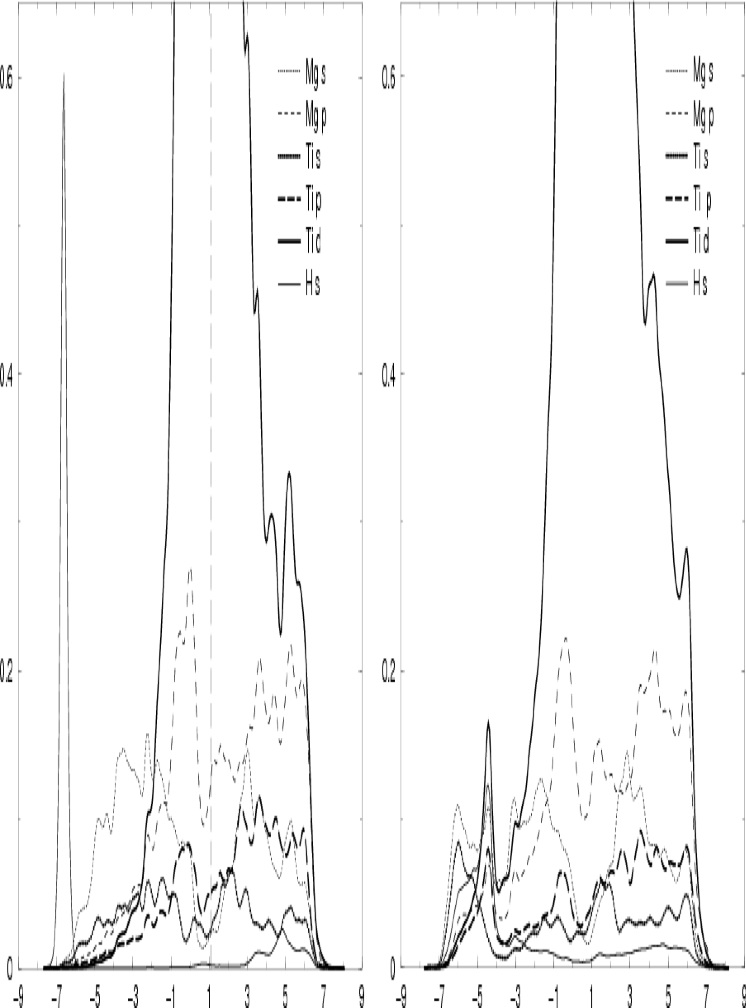
To study the electronic properties of the system, we projected the electronic density of states onto spherical harmonics functions of type , and , centred on Mg, Ni, Ti and H atoms. It is well known that the catalytic reactivity of a surface is correlated to the position of the -band (i.e., in this case the projection of the electronic density of states onto type spherical harmonics) with respect to the Fermi energy . In particular, it was shown by Hammer and Norskov hamnor95 (see also mavrikakis98 ) that a convenient parameter to monitor the catalytic reactivity is the first energy moment of the -band, or -band centre, defined as , where is the density of states projected onto spherical harmonic of type centred on some specified atom, and is some cutoff energy which we chose to be at 7 eV above the Fermi energy. Then, if the centre of the band is close to it follows that there are many electrons available for donation, as well as a significant number of empty -levels available for back-donation, and the results of this is that the system is very reactive. The electrons of Ni on Mg(0001) form a band which is relatively close to the Fermi energy and for this reason the system is very reactive. By contrast, Mg has no electrons (although in the solid state a projection onto type spherical harmonics is not zero), and therefore its reactivity is much reduced by comparison.
Ni is a late transition metal with almost all the orbitals filled with electrons, by contrast Ti only has 2 electrons in the orbitals. It is therefore clear that the position of the -band centre will be much higher in Ti than in Ni, which explains the higher reactivity of Ti.
Our calculated values for on the Ni/Ti-doped Mg surfaces are -0.79 eV and +1.08 eV for Ni and Ti respectively (see Table 4).
Using DFT RPBE, Vegge et al. vegge05 calculated the -band center position for MgTM (TM transition metal) alloys, allowing an expansion of the alloy lattice to accomodate the hydrogen atoms. They found -0.82 and +0.48 for TM=Ni,Ti respectively. Although the value we find for Ti is much larger, the same trend is observed in the case of our Ni/Ti-doped Mg surfaces.
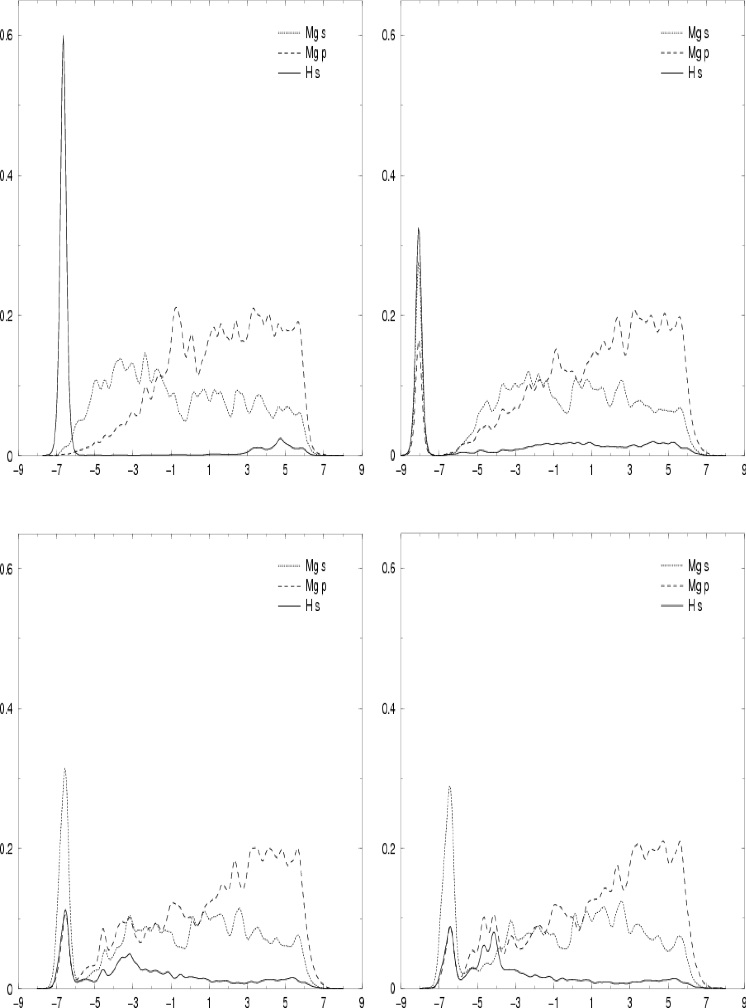
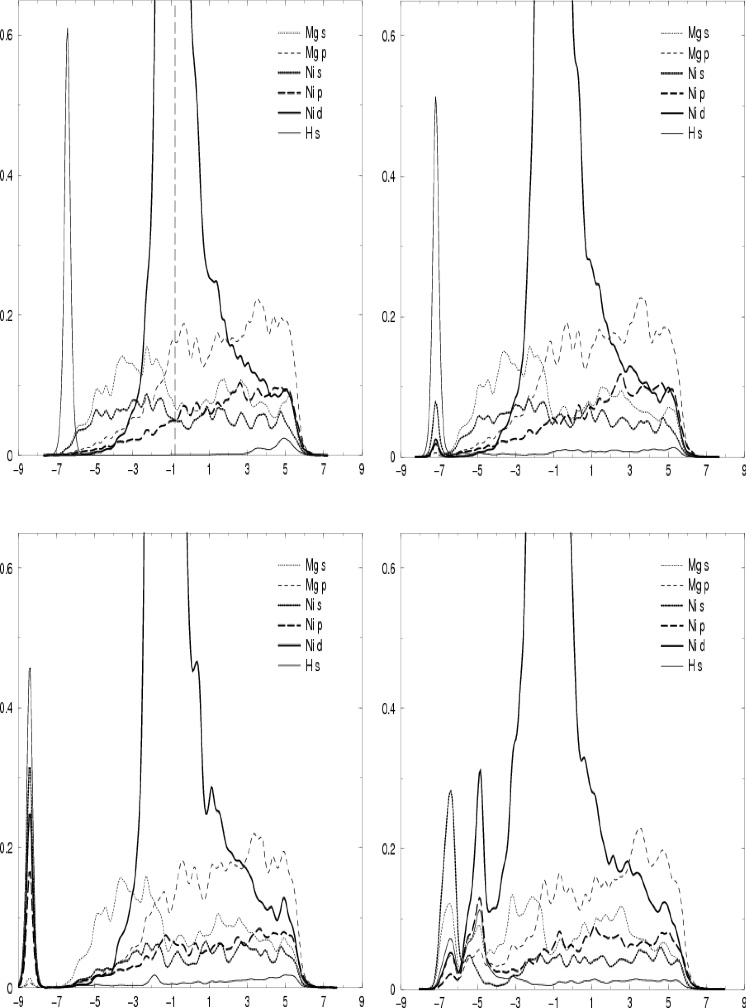
Figures 10-12 show the projected density of states (PDOS) found for the pure Mg, Ni-doped and Ti-doped Mg surfaces respectively. The PDOS are given for a number of configurations along the MEP: the initial state (IS), the transition state (TS), the replica just after the transition state (TS+1) and the final state (FS). For the Ti-doped Mg surface, the PDOS are given for IS and FS only since there is no transition state in the dissociation process. For somplicity of notation, we call here the transition state and the final state simply TS and FS, as we only refer to the part of the MEP which deals with the dissociation of the H2 molecule.
In the IS the hydrogen molecule is still far from the metal surface and there is no overlap between the H2 molecular orbitals and the orbitals of the metal surface. At the transition state, instead, when gaseous hydrogen has started dissociating over the surface, there is clear interaction between the H orbital and the Mg and orbitals on the pure Mg surface (see Fig. 10, top-right corner). On the Ni-doped surface the overlap appears to be non-zero with all the Ni , and orbitals (see Fig. 11, top-right corner). In the final state it is evident that the magnitude of the Mg electron peaks below the Fermi level are increased in the Ni/Ti-doped surfaces (see respectively Fig. 11, bottom-right corner, and Fig. 12, right) with respect to the pure Mg surface (see Fig. 10, bottom-right corner).
Interestingly, we note that there appears to be a clear negative shift of the position of the hydrogen orbital in going from the initial state to the transition state, which is more pronounced for the pure Mg surface as opposed to the Ni-doped Mg surface.
Besides the -band center positions, in Table 4 we also report the corresponding activation barriers (), the energy difference between the initial and final states () for hydrogen dissociation, and the H peak shift between the initial and transition states (HsTS-IS). The correlation between the position of the -band and the height of the activation barrier is evident, as well as the correlation with , i.e., the -band center position is smaller for larger values of the former and smaller values of the latter.
Furthermore, from the results obtained for the pure Mg and Ni-doped Mg surfaces, another interesting correlation emerges. In fact, as shown in Table 4, it appears that HsTS-IS correlates with both and , i.e., it is smaller for smaller values of the former and for larger values of the latter, following a reversed trend with respect to that noticed for the -band center position. In other words, this means that the shift of the hydrogen orbital between initial state and transition state is larger when the bond between the dopant and H atoms is weaker.
III.5 Charge distribution
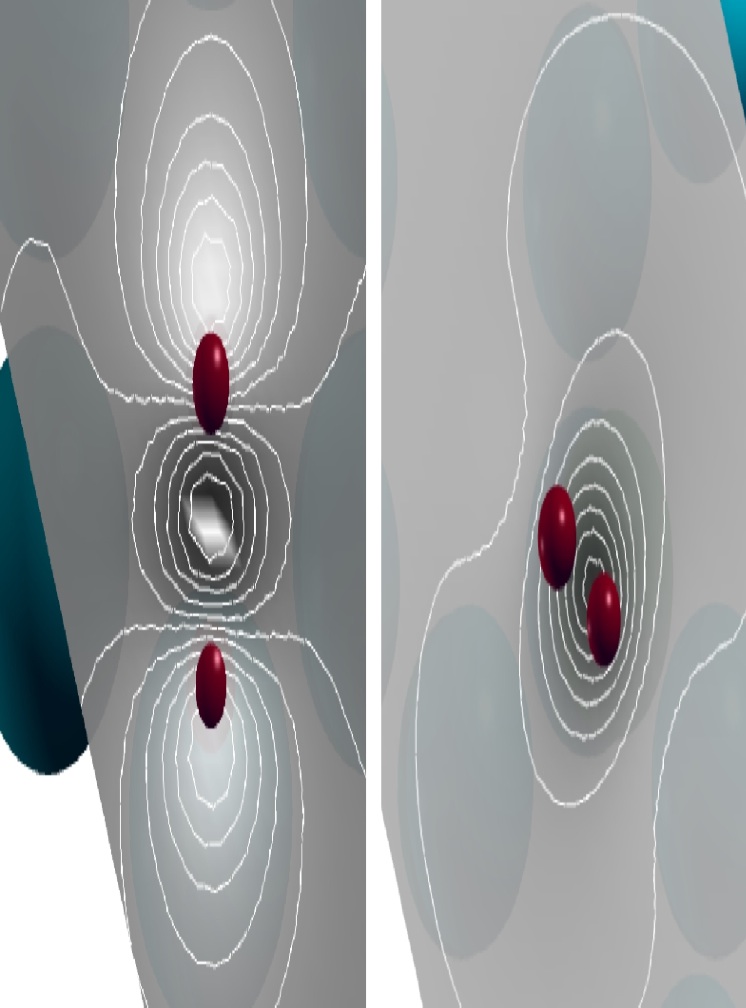
To conclude our analysis we decided to have a look at the charge distributions in the systems as the dissociation processes take place on the pure Mg and metal-doped Mg surfaces.
To do this, we calculated the total charge at each step of the MEP, and for convenience, we subtracted the charge densities obtained from calculations which included only the substrate and only the H2 fragments respectively, with the atoms in exactly the same positions. This charge difference obviously integrates to zero, and has the advantage of showing point by point where the charge is being transferred to. The analysis reveals some interesting effects. In particular, on the pure Mg(0001) surface we find that at the transition state there is a significant charge transfer from the Mg substrate to the H atoms (see Fig. 13 - left). This extra charge fills the H antibonding orbitals which eventually leads to dissociation, and builds up on the molecule because the Mg surface is unwilling to accept back-donation of electrons from the H atoms. The Coulomb energy of this charge transfer is probably the main contribution for the energy barrier.
By contrast, on the Ni doped surface there is almost no charge transfer from the substrate to the molecule at the transition state (see Fig. 13 - right). This is because while some Ni charge fills up the H2 antibonding orbitals, charge from the molecular bonding orbital is back-donated to the empty states available on the surface. As a result, the energy barrier is reduced to almost zero.
IV Experimental
IV.1 Sample preparation
The three samples prepared were MgH2, 2%Ni/MgH2 and 2%Ti/MgH2. Three batches of 25 gram samples were prepared by ball milling the different compositions for 2 hours under 4 bar of hydrogen. The MgH2 used for all is Goldschmidt 98% pure. The Ni used (99.9% pure) was from Alfa Aesar 0.8 - 0.03 m diameter as was the Ti used (20 m and 93% pure). 25 g of both 2%Ni/MgH2 and 2%Ti/MgH2 were mixed in a tubular mixer before milling for one hour. Samples were then milled using the Fritsch planetary ball mill pulverisette 5. The milling pots have a special stainless steel jacket with an o-ring fitted on the top seal, this can allow a gas atmosphere through a feeding valve, to be used during the milling process of up to 5 bar. 25 grams of sample were milled using agate pots (around 300cc volume) and 15 balls of the same material. The milling process was 2 hours using 350 rpm in a 15 minute mill 10 minute pause sequence.
IV.2 Sample testing
The rig used for testing the sample has a 10 cc reactor pot containing 1 gram of sample. The main lines of the rig are a hydrogen line regulated to a 7 bar gauge, an Argon line and a vacuum line. The inert gas line and a vacuum line are used for purging the system. The reactor is connected to an inlet flow controller, a pressure transducer to read the internal pressure and a mass flow meter outlet. A thermocouple in close contact with the powder load reads the sample temperature. A heating jacket cartridge is attached to the reactor allowing the system to operate in isothermal conditions or be temperature programmed from a control box which uses the sample thermocouple as a reference value. An interface card records inlet flow, outlet flow, temperature and pressure every second.
Volumetric hydrogenation and dehydrogenation cycles were possible to monitor using this arrangement. Hydrogenations were performed at 300 C using 25 cc min-1 of hydrogen from a regulator set at 7 bar gauge. During the hydrogenation the pressure increases to a point where the sample starts absorbing and forms a plateau pressure, once the sample is fully hydrogenated the reactor keeps building pressure until seven bar are reached. Dehydrogenations were recorded by flowing 25cc/min of hydrogen through the reactor using an inlet flow controller. The system is then open to vent for a chosen temperature or heating slope and any hydrogen evolving from the sample is recorded as an increase in the 25cc min flow by an outlet flowmeter.
IV.3 Experimental Results
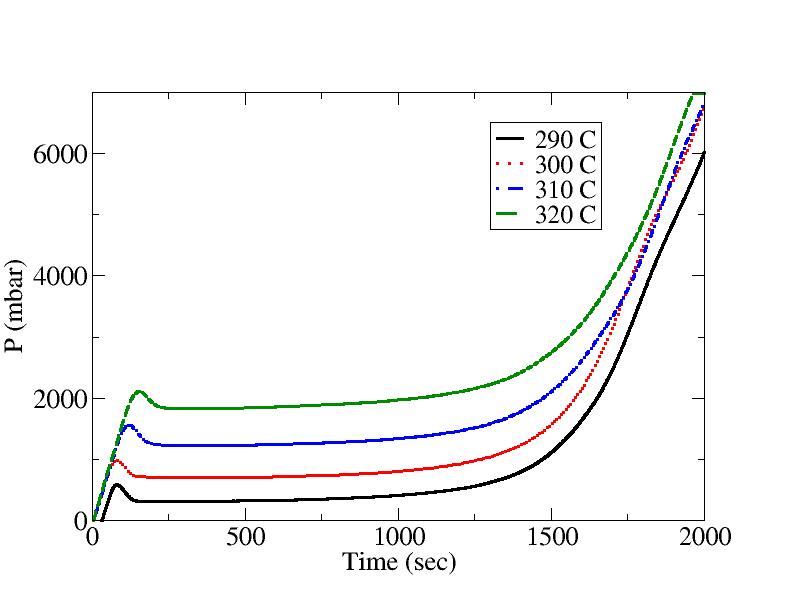
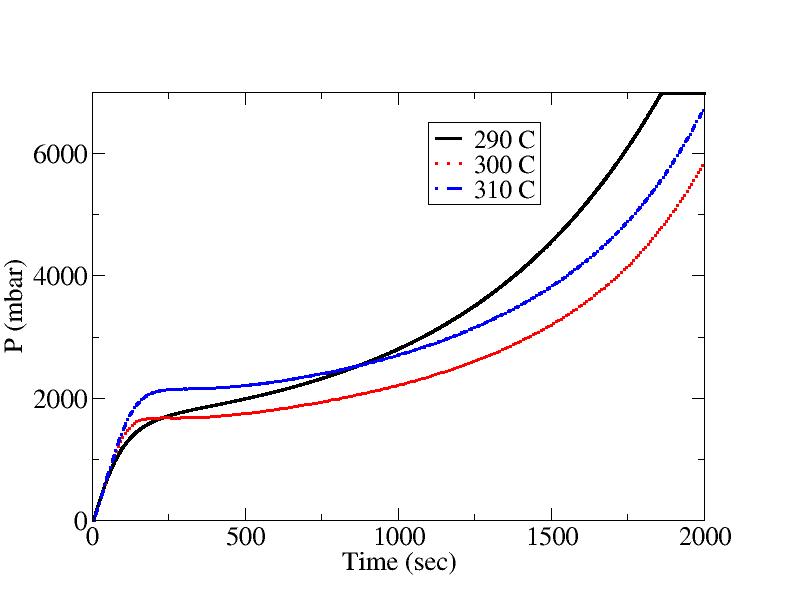
The hydrogenation plots of the 2% Ni/Mg sample at different temperatures in the range between 290 and 320 C are shown in Fig. 14. The hydrogenation of the 2%Ti/Mg sample in the temperature range between 290 and 310 C is shown in Fig. 15. Both graphs of hydrogenation show P mbar gauge vs time in seconds. The hydrogenation of pure Mg gave results close to the Ti doped samples and is therefore not shown.
The catalytic activation of Mg by Ni during hydrogenation is clear. The plateau pressures for each temperature hydrogenation are lower for the 2%Ni/Mg sample than those of Mg and 2%Ti/Mg. The fact that at 290 C the hydrogenation curve for 2%Ni/Mg is still lower than the hydrogenation in the same conditions at 300 C confirms this. At 290 C both Mg and 2%Ti/Mg showed a higher hydrogenation pressure than at 300 C suggesting Ti catalysisof Mg hydrogenation is not evident.
V Conclusions
We have presented a DFT study of hydrogen dissociation and diffusion over Ni-doped and Ti-doped Mg(0001) surfaces, and compared these with dissociation and diffusion on pure Mg(0001). Our results show that the energy barrier for hydrogen dissociation is high on the pure Mg surface (0.87 eV), and it is small (0.06 eV) or even null when Ni or Ti are used as dopants respectively. We also found that although on the pure Mg(0001) surface the binding energy of the H fragments is nearly zero, on the Ni/Ti -doped surfaces this binding energy is significant, being 0.66 and 1.34 eV respectively, with diffusion energy barriers of , and eV on the pure Mg, Ni-doped and Ti-doped surfaces respectively.
Interestingly, the activation barriers for H2 dissociation over the Ni/Ti-doped Mg surface are similar to the values found on the corresponding pure Ni/Ti surfaces arboleda04 ; kresse00 ; nobuhara04 .
More insight in the behaviour of these systems can be gained by inspecting the partial density of states and by looking at the electronic charge density distributions. In particular, the higher reactivity of Ti with respect to Ni can be understood in terms of a lower position of the -band centre, which correlates with both the height of the energy barriers for the dissociation of the H2 molecule and with the binding energy of the H fragments when adsorbed on the surface.
The charge density distributions on the different systems also shows some interesting behaviour. In particular, we argued that the presence of a barrier on the pure Mg(0001) surface may be understood in terms of the build up of extra charge on the H2 molecule as it moves closer to the surface. This happens because the closed shell Mg surface is unwilling to accept back-donation of charge from the H2 molecule. One consequence of this is that the molecule needs to arrive very close to the surface before starting to dissociate. By contrast, Ni and even more so Ti have many available empty -states, and this avoids significant charge transfer from the substrate to the molecule. In this case, the dissociation of the molecule begins much further away from the surface.
The low dissociation barrier, coupled with the low diffusion barrier, make Ni a very useful promoter for the hydrogenation of Mg. By contrast, the high dissociation barrier on the pure Mg surface, and the high diffusion barrier on the Ti-doped surface, are responsible for the slow kinetics of hydrogenation on both systems.
Our experimental findings show faster hydrogenation for the 2%Ni/Mg sample with respect to the reference Mg or the 2%Ti/Mg, in good agreement with our theoretical results of a lower activation energy for the dissociation-diffusion process in the 2%Ni/Mg system. The behaviour of Mg and 2%Ti/Mg upon hydrogenation is found to be very similar, again agreeing very well with the theoretical findings of large and similar activation energies: a dissociation energy barrier of 0.87 in the pure Mg system, and a diffusion energy barrier of 0.8 eV in the 2%Ti/Mg system, making the dissociation-diffusion process similarly difficult in both cases.
We deliberately chose to study Ni and Ti as dopants because they are at the two ends of the first row of transition metals, and so their behaviour may be expected to be representative of a range of properties. In fact, we are now extending our investigations to other transition metals, and we plan to report on these new results in the near future.
Acknowledgements.
This work was conducted as part of a EURYI scheme award as provided by EPSRC (see www.esf.org/euryi). Allocation of computer time has been provided by UCL research computing.References
- (1) A. J. Du, S. C. Smith, X. D. Yao, and G. Q. Lu, J. Am. Chem. Soc. 129, 10201 (2007).
- (2) L. Schlapbach and A. Züttel, Nature (London) 414, 353 (2001).
- (3) R. B. Schwarz, MRS Bull. 24, 40 (1999).
- (4) J.-L. Bobet, C. Even, Y. Nakamura, E. Akiba and B. Darriet, J. Alloys Compd. 298, 279 (2000).
- (5) M. Yamaguchi and E. Akiba, in Material Science and Technology, vol. 3B, edited by R. W. Cahn, P. Haasen and E. J. Kramer (New York: VCH, 1994), p. 333.
- (6) B. Bogdanovic, K. Bohmhammel, B. Christ, A. Reiser, K. Schlichte, R. Vehlen and U. Wolf, J. Alloys Comp. 282, 84 (1999).
- (7) P. T. Sprunger and E. W. Plummer, Chem. Phys. Lett. 187, 559 (1991).
- (8) B. Hammer, J. K. Nørskov, Surf. Sci. 343, 211 (1995).
- (9) W. Oelerich, T. Klassen and R. Bormann, J. Alloys Compd. 322, L5 (2001).
- (10) L. Zaluski, A. Zaluska, P. Tessier, J. O. Ström-Olsen and R. Schulz, J. Alloys Compd. 227, 53 (1995).
- (11) G. Liang, J. Huot, S. Boily, A. Van Neste and R. Schulz, J. Alloys Compd. 292, 247 (1999).
- (12) A. Zaluska, L. Zaluski and J. O. Ström-Olsen, J. Alloys Compd. 288, 217 (1999).
- (13) C. X. Shang, M. Bououdina, Y. Song and Z. X. Guo, Int. J. Hydrogen Energy 29, 73 (2004).
- (14) A. R. Yavari, J. F. R. de Castro, G. Heunen, and G. Vaughan, J. Alloys Compd. 353, 246 (2003).
- (15) G. Liang, J. Alloys Compd. 370, 123 (2004).
- (16) Y. Song, Z. X. Guo and R. Yang, Phys. Rev. B 69, 094205 (2004).
- (17) T. Vegge, L. S. Hedegaard-Jensen, J. Bonde, T. R. Munter and J. K. Nørskov, J. Alloys Compd. 386, 1 (2005).
- (18) N. Hanada, T. Ichigawa and H. Fujii, J. Phys. Chem. B 109, 7188 (2005).
- (19) J.-L. Bobet, C. Aymonier, D. Mesguich, F. Cansell, K. Asano and E. Akiba, J. Alloys Compd. 429, 250 (2007).
- (20) A. J. Du, S. C. Smith, X. D. Yao, and G. Q. Lu, J. Phys. Chem. B 109, 18037 (2005).
- (21) A. J. Du, S. C. Smith, X. D. Yao, and G. Q. Lu, J. Phys. Chem. B 110, 21747 (2006).
- (22) H. Hjelmberg, Surf. Sci. 81, 539 (1979).
- (23) P. K. Johansson, Surf. Sci. 104, 510 (1981).
- (24) J. K. Nørskov, A. Høumoller, P. K. Johansson, and B. I. Lundqvist, Phys. Rev. Lett. 46, 257 (1981).
- (25) D. M. Bird, L. J. Clarke, M. C. Payne and I. Stich, Chem. Phys. Lett. 212, 518 (1993).
- (26) T. Vegge, Phys. Rev. B 70, 035412 (2004).
- (27) G. Kresse and J. Furthmüller, Phys. Rev. B 54, 11169 (1996).
- (28) P. E. Blöchl, Phys. Rev. B 50, 17953 (1994).
- (29) G. Kresse and J. Joubert, Phys. Rev. B 59, 1758 (1999).
- (30) J. P. Perdew, K. Burke and M. Ernzerhof, Phys. Rev. Lett. 77, 3865 (1996).
- (31) D. Alfè, Comp. Phys. Comm. 118, 31 (1999).
- (32) H. J. Monkhorst and J. D. Pack, Phys. Rev. B 13, 5188 (1976).
- (33) M. Methfessel and A. Paxton, Phys. Rev. B 40, 3616 (1989).
- (34) A. Kokalj, Comp. Mater. Sci. 28, 155 (2003). Code available from http://www.xcrysden.org/.
- (35) G. Mills, H. Jonsson, and G.K. Schenter, Surf. Sci. 324 305 (1995); H. Jonsson, G. Mills, and K.W. Jakobsen, in Classical and Quantum Dynamics in Condensed Phase Simulations, edited by B.J. Berne, G. Ciccotti and D.F. Coker (World Scientific 1998); G. Henkelman and H. Johnsson, J. Chem. Phys. 113, 9978 (2000); G. Henkelman, B.P. Uberuaga, and H. Johnsson, J. Chem. Phys. 113, 9901 (2000).
- (36) F. Birch, Phys. Rev. 71, 809 (1947).
- (37) E. Wachowicz and A. Kiejna, J. Phys.: Condens. Matter 13, 10767 (2001).
- (38) S. Mehta, G. D. Price, and D. Alfè, J. Chem. Phys. 125, 194507 (2006).
- (39) N. W. Ashcroft and N. D. Mermin, in Solid State Physics (New York: Holt, Rinehart and Winston).
- (40) http://www.webelements.com
- (41) D. Errandonea, Y. Meng, D. Häusermann, and T. Uchida, J. Phys.: Condens. Matter 15, 1277 (2003).
- (42) C. Kittel, Introduction to Solid State Physics, 7th ed. (Wiley, New York, 1996).
- (43) A. F. Wright, P. J. Feibelman and S. R. Atlas, Surf. Sci. 302, 215 (1994).
- (44) Ismail, Ph. Hofmann, E. W. Plummer, C. Bungaro, and W. Kress, Phys. Rev. B 62, 17012 (2000).
- (45) B. E. Hayden, E. Schweitzer, R. Kötz, and A. M. Bradshaw, Surf. Sci. 111, 26 (1981).
- (46) W. R. Tyson and W. A. Miller, Surf. Sci. 62, 267 (1977).
- (47) Y. K. Vohra and P. T. Spencer, Phys. Rev. Lett. 86, 3068 (2001).
- (48) R. R. Zope and Y. Mishin, Phys. Rev. B 68, 024102 (2003).
- (49) M. Jahnátek, M. Krajčí, and J. Hafner, Phys. Rev. B 71, 024101 (2005).
- (50) CRC Handbook of Chemistry and Physics, 83rd ed., edited by D. R. Lide (CRC, New York, 2002).
- (51) G. Kresse and J. Hafner, Surf. Sci. 459, 287 (2000).
- (52) J. Greeley and M. Mavrikakis, J. Phys. Chem. B 109, 3460 (2005).
- (53) M. Pozzo, G. Carlini, R. Rosei and D. Alfè, J. Chem. Phys. 126, 164706, 2007.
- (54) H. L. Davis, J. B. Hannon, K. B. Ray, and E. W. Plummer, Phys. Rev. Lett. 68, 2632 (1992).
- (55) N. B. Arboleda Jr., H. Kasai, K. Nobuhara, W. A. Dino and H. Nakanishi, J. Phys. Soc. Jpn. 73, 745 (2004).
- (56) G. Kresse, Phys. Rev. B 62, 8295 (2000).
- (57) K. D. Rendulic, G. Anger and A. Winkler, Surf. Sci. 208, 404 (1989).
- (58) K. Nobuhara, H. Kasai, W. A. Dinõ, and H. Nakanishi, Surf. Sci. 566-568, 703 (2004).
- (59) M. Mavrikakis, B. Hammer and J. K. Nørskov, Phys. Rev. Lett. 81, 2819 (1998).