Stellar populations in the Canis Major over-density
Abstract
We performed a photometric multicolor survey of the core of the Canis Major over-density at , , reaching V 22 and covering . The main aim is to unravel the complex mixture of stellar populations toward this Galactic direction, where in the recent past important signatures of an accretion event have been claimed to be detected. While our previous investigations were based on disjointed pointings aimed at revealing the large scale structure of the third Galactic Quadrant, we now focus on a complete coverage of a smaller field centered on the Canis Major over-density. A large wave-length baseline, in the bands, allows us to build up a suite of colour colour and colour magnitude diagrams, providing a much better diagnostic tool to disentangle the stellar populations of the region. In fact, the simple use of one colour magnitude diagram, widely employed in all the previous studies defending the existence of the Canis Major galaxy, does not allow one to separate the effects of the different parameters (reddening, age, metallicity, and distance) involved in the interpretation of data, forcing to rely on heavy modeling. In agreement with our previous studies in the same general region of the Milky Way, we recognize a young stellar population compatible with the expected structure and extension of the Local (Orion) and Outer (Norma-Cygnus) spiral arms in the Third Galactic Quadrant. Moreover we interpret the conspicuous intermediate-age metal poor population as belonging to the Galactic thick disk, distorted by the effect of strong disk warping at this latitude, and to the Galactic halo.
keywords:
Milky Way – structure: stars.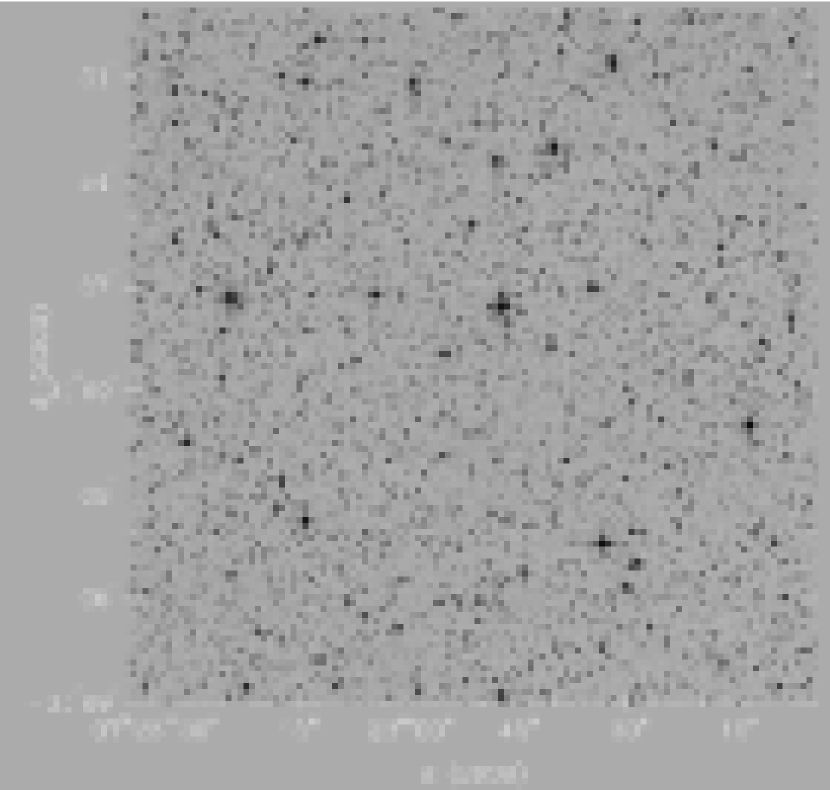
1 Introduction
In the last years, we have used photometric observations of young open cluster fields to probe the spiral structure in the third Galactic Quadrant (TGQ, ; Carraro et al. 2005a, Moitinho et al. 2006, Vázquez et al. 2008), motivated by the very poor knowledge of this portion of the Galaxy’s periphery. Interestingly, important low latitude accretion phenomena have been recently claimed to be ongoing in this part of the Galaxy, such as the Canis Major over-density (CMa, Bellazzini et al. 2004), and the Monoceros Ring (MRi, Newberg et al. 2002). Clearly, a detailed description of the structure and stellar populations of the Galactic disc (thin plus thick) is mandatory to discriminate between Galactic and extragalactic material. The TGQ is a special region of the Milky Way’s outskirts, characterized by significant absorption windows as the Puppis (l ) window (Fitzgerald 1968, Moffat et al. 1979, Janes 1991, Moitinho 2001), which allows one to detect very distant star clusters (Baume et al. 2006). Besides, and interestingly, young star clusters are found at low Galactic latitudes, underlining the fact that the young Galactic disk is significantly warped in these directions (May et al. 1997, Momany et al. 2004, Moitinho et al. 2006, Momany et al. 2006, López-Corredoira et al. 2007).
In Vázquez et al (2008), by combining optical and CO observations, we have provided a fresh and very detailed picture of the spiral structure in the TGQ, showing that this region is characterized by a complicated spiral pattern. The outer (Norma-Cygnus) arm is found to be a grand design spiral feature defined by young stars, whereas the region closer to the Sun (d⊙ less than 9 kpc) is dominated by a conspicuous inter-arm structure, at l 245o, the Local spiral arm. In this region, Perseus is apparently defined by gas and dust, and does not appear to be traced by an evident optical young stellar population, similarly to what can be found in other galaxies such as M 74 (Vázquez et al. 2008). The analysis carried out on a substantial fraction of the stellar fields we observed revealed a complicated mixture of young and old populations. Although centered on catalogued star clusters (Dias et al. 2002), a few colour magnitude diagrams (CMD) do not reveal star clusters but, and more interestingly, show hints of a young, diffuse, and distant stellar populations, which has become recently referred to as Blue Plume ( Bellazzini et al. 2004, Dinescu et al. 2005, Martínez-Delgado et al. 2005,Carraro et al. 2005 ). Since the disk is warped and flared in these directions (Momany et al. 2006), the lines of sight are expected to cross both the thin and thick disk population in front of a particular target, in a way that the analysis of the CMD becomes very challenging (see for instance the analysis of the field toward the star cluster Auner 1, Carraro et al. 2007).
In this paper we present a photometric analysis in the filters of the stellar populations in 3 wide field pointings toward the CMa over-density. Sect. 2 describes the observation and data reduction strategies. In Sect. 3 we discuss various colour combination CMDs, while Sects. 4 and 5 are dedicated to illustrate and analyze the TCD as a function of magnitude. Finally, Sect. 6 summarizes our findings.
| Designation | l | b | U | B | V | R | I | Airmass | Seeing | ||
|---|---|---|---|---|---|---|---|---|---|---|---|
| [deg] | [deg] | secs | secs | secs | secs | secs | arcsec | ||||
| Field 1 | 07:22:51 | -30:59:20 | 244.00 | -07.50 | 20,180,1800 | 10,150,1500 | 5,60,900 | 5,60,900 | 5,60,900 | 1.00-1.30 | 0.83-1.02 |
| Field 2 | 07:20:46 | -31:09:36 | 244.00 | -08.00 | 20,180,1800 | 10,150,1500 | 5,60,900 | 5,60,900 | 5,60,900 | 1.00-1.30 | 0.90-1.12 |
| Field 33 | 07:20:21 | -31:15:43 | 244.00 | -08.10 | 20,180,1800 | 10,150,1500 | 5,60,900 | 5,60,900 | 5,60,900 | 1.20-1.80 | 1.28-2.11 |
2 Observations and Data Reduction
2.1 Observational details
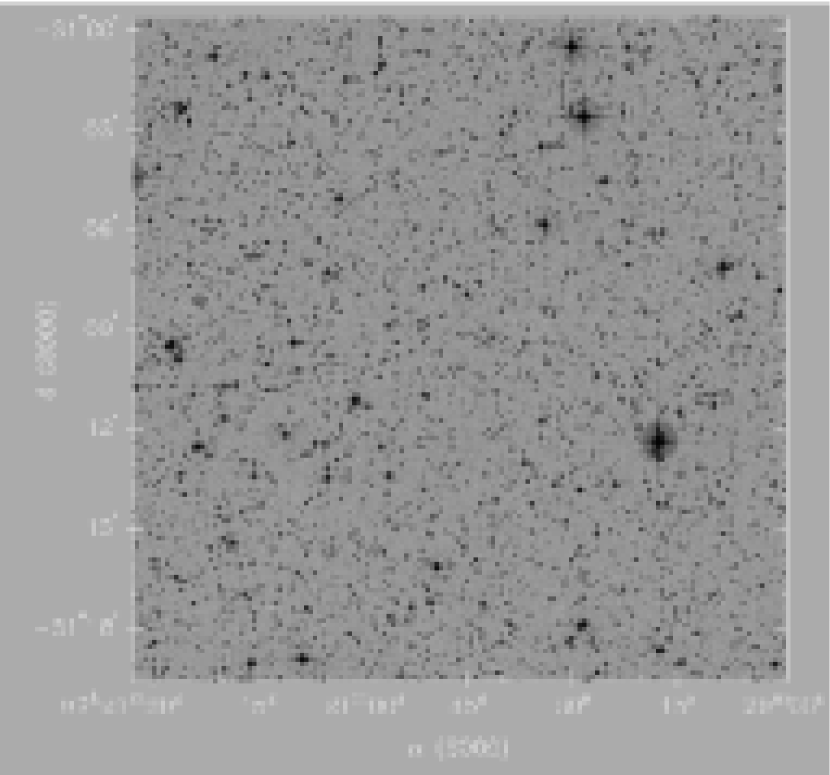
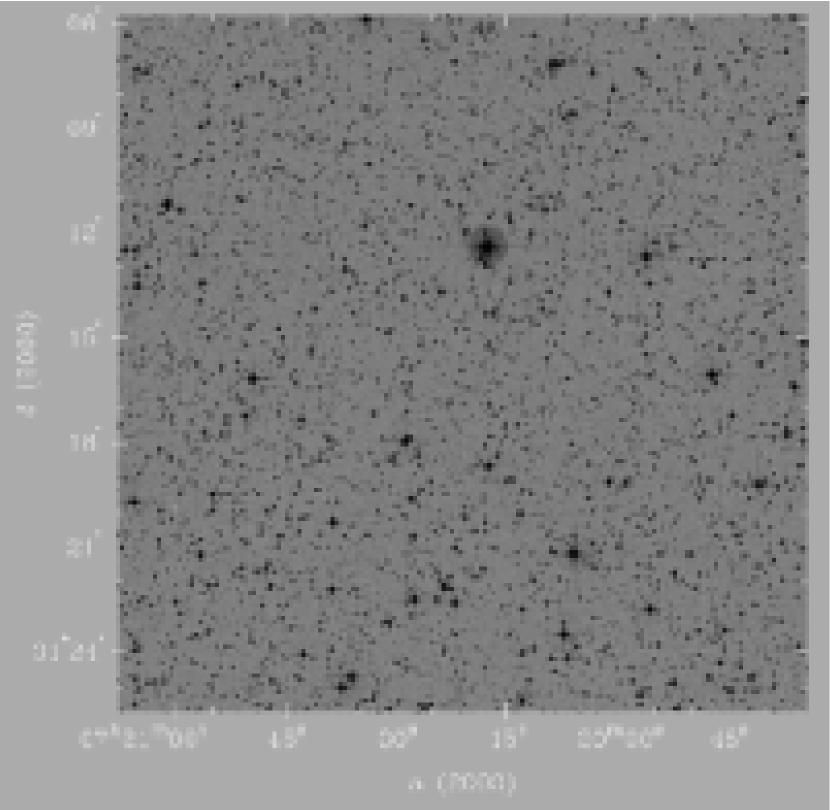
images of 3 overlapping fields (see Figs. 1 to 3) in the Third Quadrant of the Milky Way toward the CMa over-density were obtained at the Cerro Tololo Inter-American Observatory 1.0m telescope, which is operated by the SMARTS111http://www.astro.yale.edu/smarts/ consortium. The telescope is equipped with a new 4k4k CCD camera having a pixel scale of 0′′.289/pixel which allows to cover a field of on the sky. Observations were carried out on the nights of November 28 and December 3, 2005. The two nights were part of a 6 night run. In the first night we observed the fields and (see Table 1) while field was observed in the last night of the run.
The CCD is read out through 4 amplifiers, each one with slightly different bias levels and gains. Pre-processing was done using the procedure developed by Philip Massey222http://www.lowell.edu/users/massey/obins/y4kcamred.html. Briefly, the procedure trims and corrects the images for bias, flat-field, and bad pixels, preparing them from photometric extraction. A series of skyflats was employed in all the filters.

| , , |
| , , |
| , , |
| , , |
| , , |
2.2 Standard Stars
Three Landolt (1992) areas (TPhoenix, Rubin 149, and PG 0231+006) were
observed several times each night to tie instrumental magnitudes to
the standard system. All nights, except the last one, were stable and
photometric with seeing between 0.8 and 1.2 arcsec. The last night was
non-photometric with bad seeing conditions (see Table 1). Photometry
from this last night was tied to the other
nights through the comparison of stars in common.
Since the photometric solutions were identical, all the
standard star measurements were used together in obtaining a single photometric
solution for the entire run. This resulted in calibration
coefficients derived using about 200 standard stars. Photometric solutions have
been calculated following Patat & Carraro (2001). Fig. 4 shows the run
of magnitude differences (standard versus instrumental) for the whole
standard set. Notice that the colour baseline is sufficiently broad. On
the right, the rms of the fit is shown for each colour. The
calibration equations read:
| (1) | |
| (2) | |
| (3) | |
| (4) | |
| (5), |
where are standard magnitudes, are the instrumental magnitudes, is the airmass, and the derived coefficients are presented in Table 2. We adopted the extinction coefficients typical of the site (Carraro et al. 2005b).
2.3 Photometry extraction
The covered areas are shown in Figs. 1 to 3. Data have been reduced using IRAF333IRAF is distributed by NOAO, which is operated by AURA under cooperative agreement with the NSF. packages CCDRED and DAOPHOT. Photometry was done employing the point spread function (PSF) fitting method (Stetson 1987). Particular care has been put in defining the PSF model. A variable PSF was adopted due to PSF variations across the CCD. In general, up to 40 bright stars have been selected for defining the PSF model. Aperture corrections were estimated from samples of bright PSF stars (typically 15), and then applied to all the stars. The corrections amounted to 0.250-0.315, 0.280-0.300, 0.200-0.280, 0.190-0.270, and 0.210-0.280 mag for the filters, respectively, over the entire run. Photometric completeness was estimated following Baume et al. (2006) and was determined to be higher than 50 at V 20. mag.
3 Colour Magnitude Diagrams
As discussed in Moitinho et al. (2006), up to now the analysis of the stellar populations in the direction of the CMa over-density (Martin et al. 2004, Martínez-Delgado et al 2004) has been performed using only two colours (mostly B and R). More recent analysis does not deviate from this approach, and dramatically confirms the limitations and uncertainties of having just two colours. In Moitinho et al. (2006) and Carraro et al. (2007) we have clearly demonstrated that having multicolour photometry is crucial. Although being well known, the importance of multicolour measurements is often overlooked. Here, as in our previous work, we stress that the possibility of building colour-colour diagrams (or two-colour diagram (TCD), especially U-B vs B-V) is essential when young/early-type stellar populations are present.
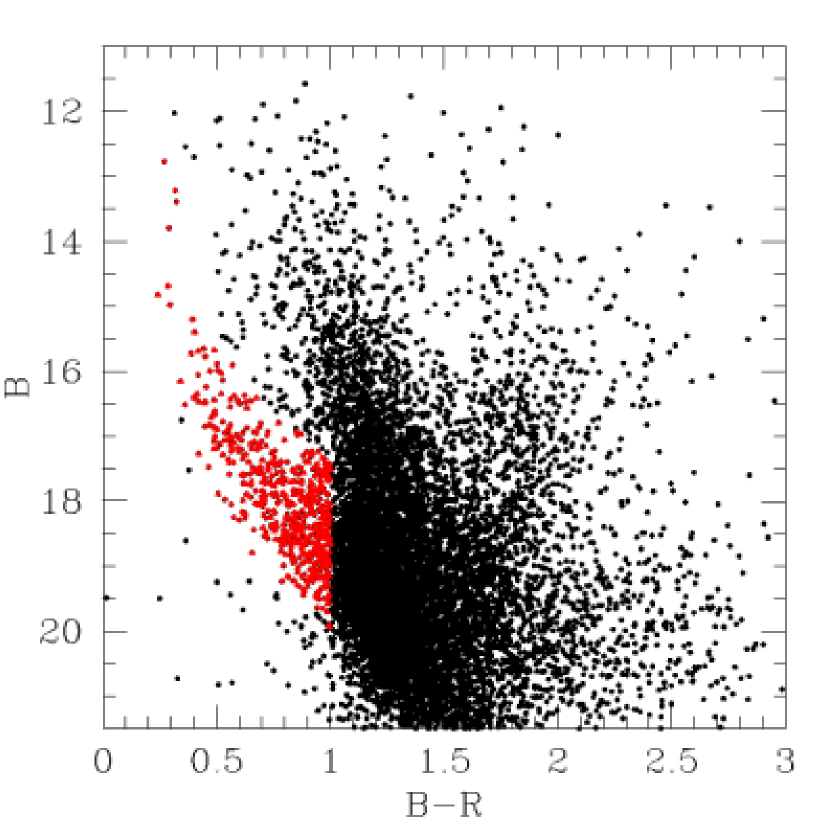
In Fig. 5 we show the B vs B-R CMD of the center of the CMa
over-density. Only stars with errors lower than 0.10 mag (about 10,000
stars) in both filters are plotted. The diagram is in every way
similar to the one presented in Martínez-Delgado et al. (2005),
except for the magnitude range. Their CMD (their Fig. 1) is several
magnitudes deeper, while the bright stars (B 16.0) are
saturated. Apart from that, the prominent feature designated as the
blue plume appears very clearly as a sequence of blue stars
which detaches from the Main Sequence (MS) at B 19.5, (B-R)
1.1, reaching (B-R) as blue as 0.35, and B as bright as 13.0
mag. The stars which most probably belong to this feature have been
indicated in the same figure
with filled triangles (red when printed in colour).Lacking any membership
analysis, these stars have been identified by means of an approximate region cut in the CMD.
These same stars are then identified and plotted with the same
symbols in Fig. 6 to 8.
We recall that this feature was originally interpreted as the
signature of the most recent star formation event in the hypothetical
CMa galaxy, occurring 1-2 Gyrs ago (Bellazzini et al. 2005), and
later was suggested as being the Blue Straggler population of CMa
(Bellazzini et al. 2006). In both cases, this feature would not be
populated by young stars (Carraro et al. 2007), but having only two
filters there is not much more one can add. However, if a population
1-2 Gyr old were present, a distinctive clump of He-burning stars
would be evident, which is not the case, as already also emphasized by
Martínez-Delgado et al. (2005).
Indeed, the recent analysis of de Jong et
al. (2006) again highlights the difficulty of working with only two
filters, which forces the authors to rely upon heavy modeling. The
lack of any spectroscopic information further complicates the
scenario.
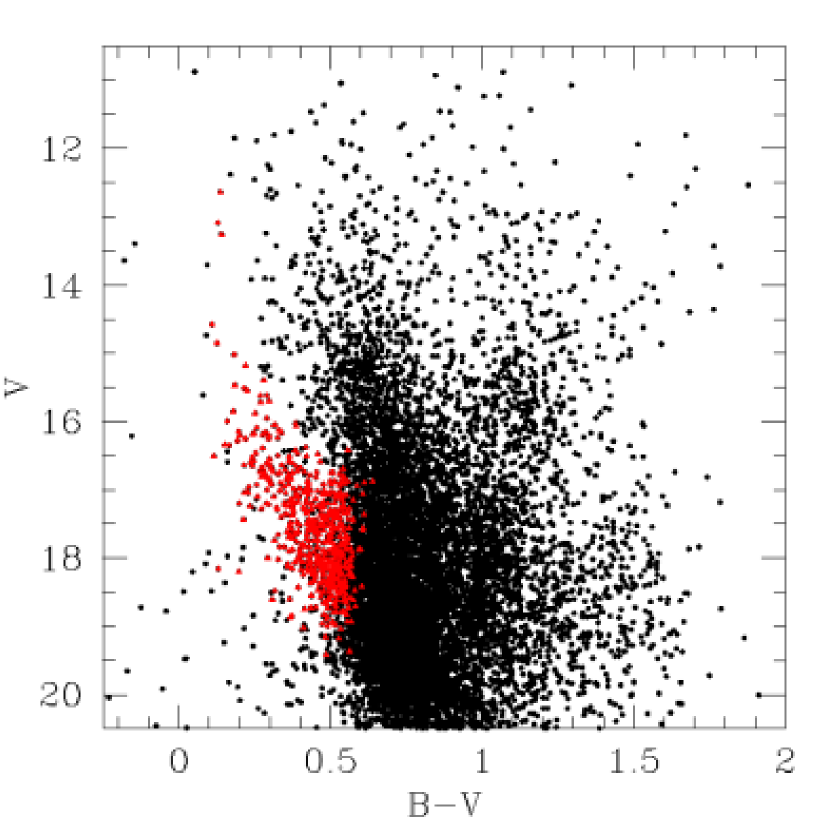
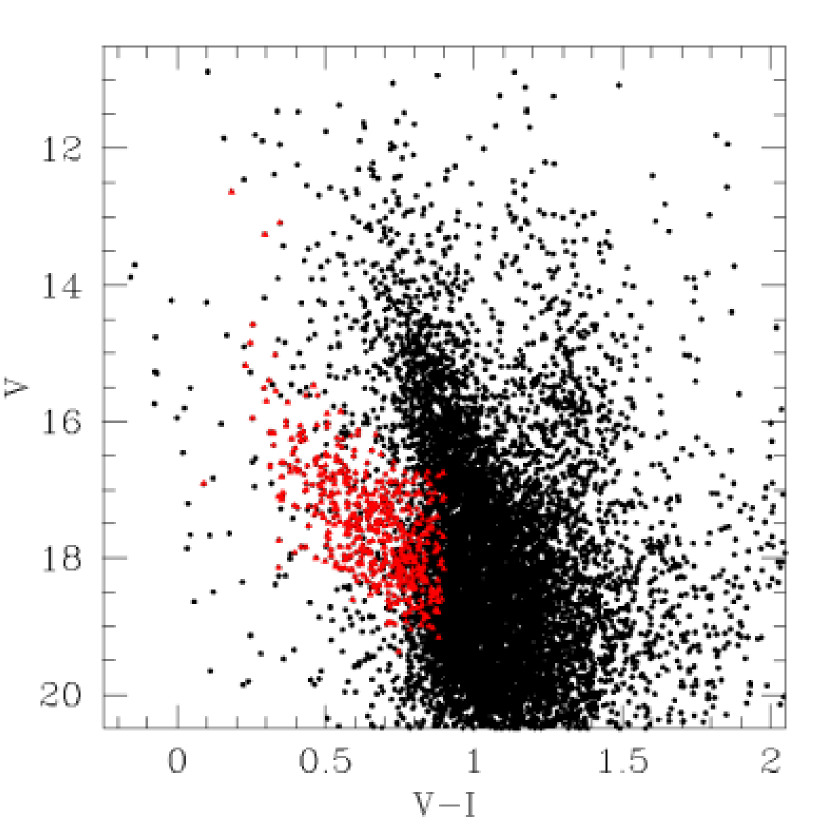
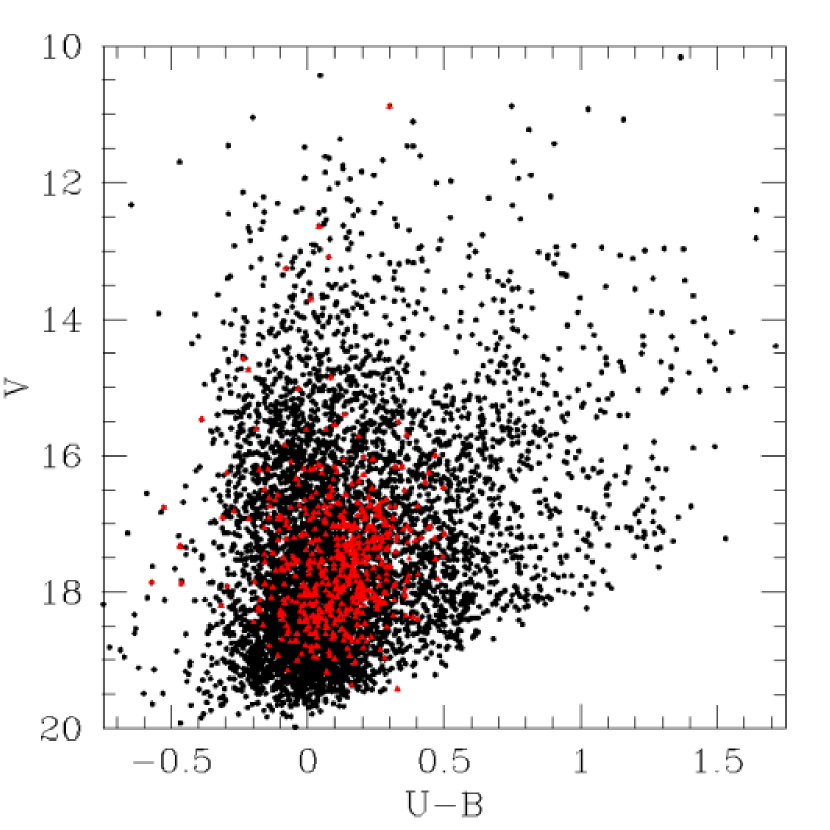
For completeness, we show in Figs. 6 to 8 the CMDs of the same region in the V vs B-V, V vs V-I, and V vs U-B planes, respectively. The same blue plume (BP) as in the B vs B-R CMD can be recognized in Fig. 6 and 7, while BP stars in the V vs U-B plane are mixed with the field dwarf stars. Besides the BP, Figs. 5 to 7 display a blurred, but still conspicuous blue Turn Off (TO) at V 17.518.0, typical of an older, intermediate metallicity, population, as will be discussed further ahead.
4 The Colour Colour Diagram: generalities
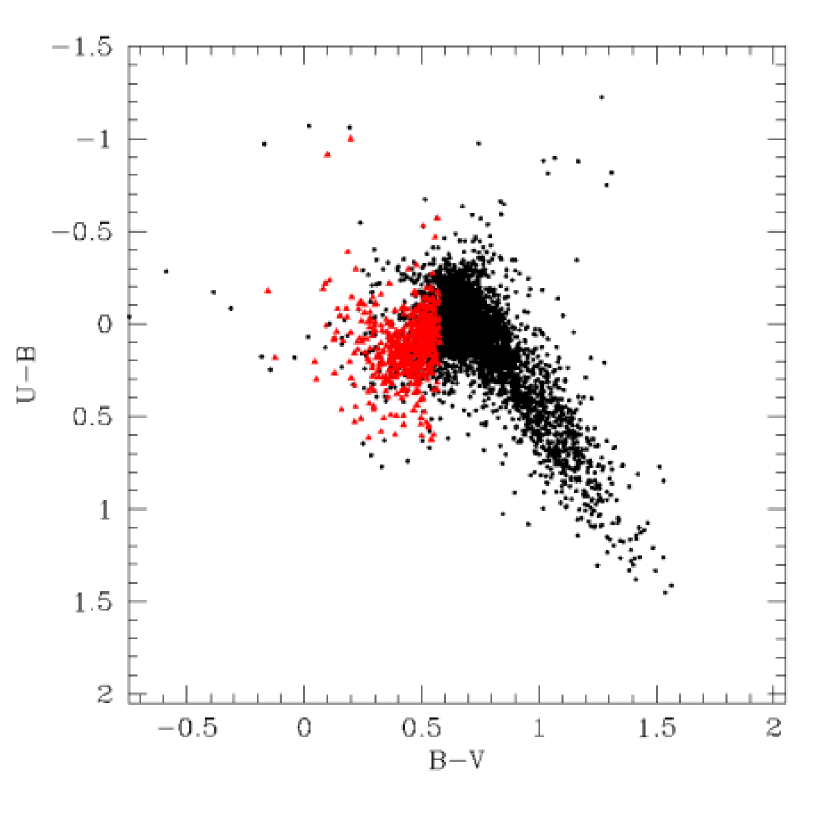
Following Carraro et al. (2007), we exploit the entire filter baseline to put more stringent constraints on the properties of the stellar populations in the Galactic direction under study. We employ the U filter in building the TCD in the (U-B) vs (B-V) plane, which is shown in Fig. 9 for all the detected stars having photometric error lower than 0.1 mag.
It is well known that the position of a star in the TCD depends mostly on its spectral type, and does not depend on its distance. The displacement from the Zero Age Main Sequences (ZAMS) is then caused by its reddening, and, to a minor extent, by its metallicity. This is illustrated in Fig. 10, where ZAMS for dwarf stars from Girardi et al. (2000) are shown for different metallicities.
The effect of interstellar absorption is to produce a displacement from the unreddened ZAMS (solid line) along the reddening vector represented in the bottom of Fig. 10 for a normal extinction law (solid arrow). This normal extinction law - characterized by a total to selective absorption ratio = 3.1 - is found to be valid in many regions of the Milky Way, except for star forming regions. In particular, Moitinho (2001) demonstrated that this law is valid in the TGQ.
The effect of metallicity is only marginally important for stars with spectral types earlier than A0, and becomes sizable for spectral types F-G, increasing the size of the bell shaped feature introduced by the ultraviolet excess (Sandage et al. 1969, Norris et al. 1999). The larger the effect, the lower the metal content of a star. For even later spectral types, the trend is to have the (B-V) colour redder and the (U-B) bluer at decreasing metallicity.
By inspecting Fig. 9, one can immediately recognize two remarkable features.
-
The first one is the presence of a group of young stars (at B-V bluer than 0.5) spread both in B-V and in U-B by different amount of reddening. This corresponds to the high luminosity component of the blue plume visible in all the different CMDs in Figs. 5 to 7.
-
The other one is at the expected location of F and G stars, namely a prominent population of metal poor stars. This population corresponds to the bulk of blue stars visible in the CMDs of Figs. 5 to 7 in the form of a thick MS having the brightest TO at V 18.018.5. No clear indications of a Red Giant Branch (RGB) or RG Clump are visible in the various CMDs, due to the combined effects of variable reddening, metallicity and distance, which altogether concur to spread the stars in the RGB region.

5 The Colour Colour Diagrams: Analysis
In this section we focus on the two prominent features of the TCD shown in Fig. 9 and mentioned in the previous section. To this aim, we have split the stars in different V magnitude bins, and produced the corresponding TCDs. The idea behind this approach is that at increasing V magnitude we are mainly picking up stars with larger reddening and distance, as exhaustively illustrated in Carraro et al. (2007). The various TCDs are shown in Fig. 11.
5.1 The young stellar population
We start by analyzing the different panels in Fig. 11 to characterize the young stellar population. It is straightforward to recognize how early spectral type stars composing the blue plume are mostly evident between V 15 and V 17, with the peak of the distribution in the panel. Here we face a group a young stars with spectral types in the range B5-A0 reddened by E(B-V) = 0.250.10. The typical absolute magnitude MV of these stars is in the range 0.1-0.6, and therefore we estimate them to lie at about 9.8 kpc from the Sun. Having such spectral types, these stars are younger than 100 Myr or so (Carraro et al. 2005, Moitinho et al. 2006). In all the other panels of Fig. 11 there is only marginal evidence of the same early spectral type stellar population leading to the conclusion that this population is located at any distance along the line of sight, but with a clear peak at about 10 kpc.
At 10 kpc and , these young stars perfectly match the distance and position of the Galactic Outer and Local spiral arms (Moitinho et al. 2006, Vázquez et al. 2008). Moreover, we have shown that along this line of sight the Local (Orion arm) is a remarkable structure that stays close to the formal Galactic plane, , for about 6-7 kpc, and then starts bending, following the warping of the disk. At the latitude sampled in this work, the Orion arm is expected to reach the Outer arm. So that what is seen is material located all the way along the Local arm until it reaches the Outer arm, causing the appearance of a stellar over-density. This is a clear demonstration that, although remarkable, the distribution of young BP stars in CMa is that expected from the warped spiral structure of the Galaxy and does not require postulating the presence of an accreted dwarf galaxy in CMa.
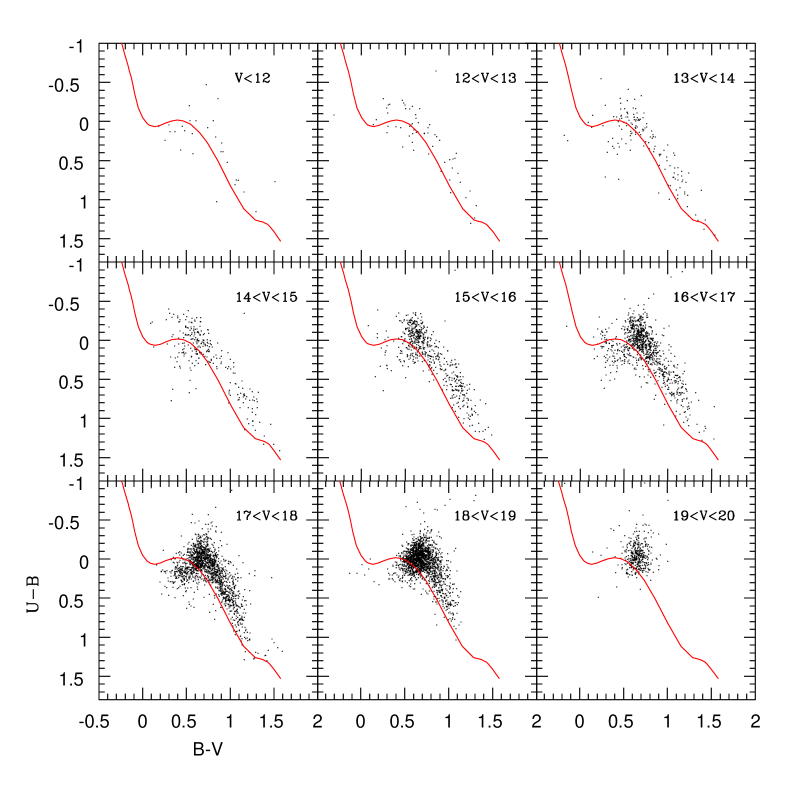
5.2 The older metal poor population
The decomposition of the TCD in magnitude bins, as shown Fig. 11, also allows to better understand the nature of the older stellar population toward the CMa over-density.
The conspicuous broad bell-shaped structure, likely produced by ultraviolet excess, is visible in all the TCDs downward V 15, and appears with increasing importance at increasing magnitude down to the limit of our observations. This morphology suggests that the majority of these stars are F-G dwarfs spanning a variety of metallicities. It is difficult to assign a precise metallicity range, due to photometric errors and different amount of reddening. However, the bulk of these dwarfs may probably span metallicities from about solar (Z=0.019) to much lower than solar (probably down to Z=0.004, see Fig. 10).
It is useful to compare these TCDs with the ones presented by Norris et al. (1999) for metal poor stars. The same bell shape feature as in their Fig. 1c fully supports our interpretation of these stars being mostly dwarf metal poor stars. At such a Galactic latitude, and taking into account the relatively low absorption, we expect to encounter along the line of sight a mix of metal poor stars from the thick disk and from the halo. Comparison of the colour of our (U-B) envelope with the one of Norris et al. (1999; U-B as blue as -0.35, see their Fig. 2), suggests the presence of stars as metal poor as [Fe/H] -2.2 dex.
In addition, the series of TCDs in Fig. 11 also reveals the presence of stars with spectral types later than F, both dwarfs and giants, at any magnitude bin down to V 19. These stars have spectral types from F-G to K and exhibit approximately the same scatter in the different panels, meaning they are affected by the same amount of reddening independently of the magnitude bin. This confirms the results of previous studies indicating that reddening along this line of sight does not change significantly with distance (Fitzgerald 1968, Vázquez et al. 2008), and therefore the spread is mostly due to metallicity.
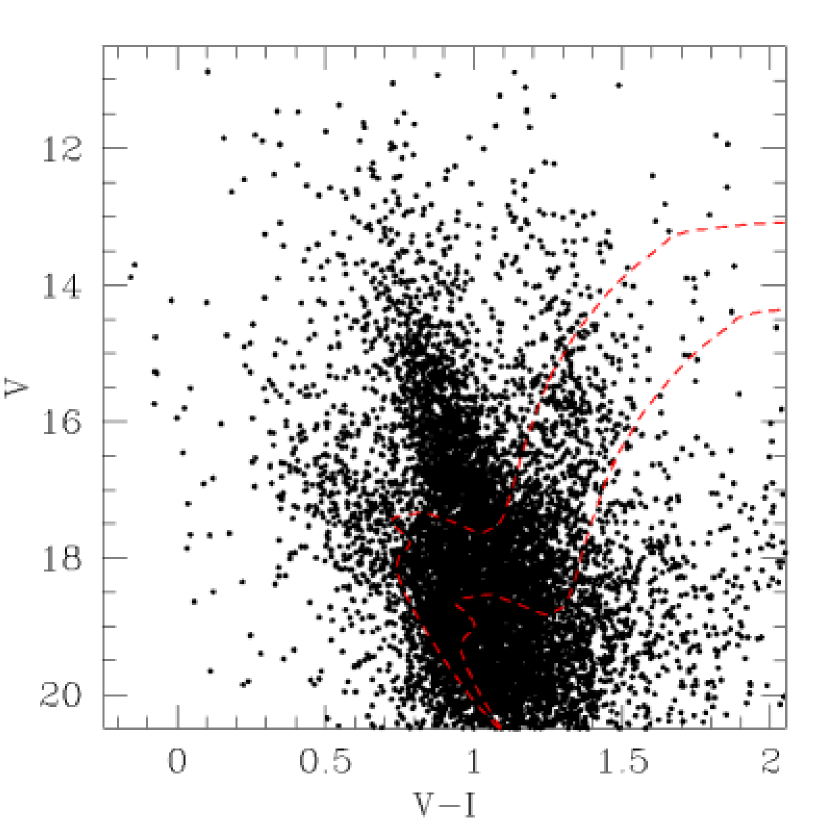
The metal poor population is also an older one, since it corresponds to the bulk of blue dwarf stars fainter than V 18.0 in the CMDs of Fig. 6 and 7. In this part of the CMD one can recognize a TO at V18.018.5, in the form of an abrupt change of the stellar density at about the position where the blue plume merges with the nearby dwarf MS. The shape of this TO provides an estimate of the age of the population and its minimum distance. To this aim we consider a mean metallicity of Z = 0.010, and choose a suitable isochrone with the purpose of guiding the eye and providing constraints on the age and distance which match the shape of the TO the best. A reddening of E(V-I) = 0.18 is adopted as representative of this Galactic direction (see also previous subsection). This value agrees with the maps of Schlegel et al. (1998) and of Amores & Lépine (2007).
In Fig. 12 we superimpose a 6 Gyr isochrone on the V vs V-I CMD (the one where the TO is more visible), which matches the shape of the TO for the adopted metallicity and reddening. This implies a distance modulus (m-M) 14.3, a distance of 6 kpc and a height of 800 pc below the plane. The same isochrone is also plotted for a distance modulus of 15.3 and a higher reddening of E(V-I) = 0.38 (to take into account the larger distance), which corresponds to a distance of 7.5 kpc and a height below the plane of almost 1 kpc. These two lines encompass the bulk of red giant stars, suggesting that the bulk of the population is mostly around this age. By experimenting with a larger set of isochrones, we found acceptable fits with ages of 62 Gyrs and a metallicity range of Z=0.0100.06. As discussed in Carraro et al. (2007), where a field in the direction of the open cluster Auner 1 was studied, these values are fully compatible with the thick disk of the Milky Way (Bensby et al. 2003). The large distance covered by this metal poor population is consistent with a thick disk bending and becoming more distant at increasing height below the Galactic plane.
6 Conclusions
We have presented a photometric analysis in the filters of 3 wide field pointings close to the center of the Canis Major over-density. The goal was to study the stellar populations in this region of the Milky Way, where a putative dwarf galaxy in the act of being cannibalized by the Milky Way, is claimed to exist. The analysis presented in this paper followed a different strategy from previous investigations of the CMa over-density. Instead of studying very large fields in two filters, we have concentrated on a smaller area, but observed in several filters. This approach, frequently employed in the study of star clusters, allowed us to construct several CMDs and the classical (B-V) vs (U-B) TCD, which together constitute a very powerful tool for detecting young stellar populations. As in our previous studies of stellar fields in the TGQ we found evidence of a diffuse young stellar population, as expected from the presence of the Local and Outer Galactic spiral arms (Carraro et al. 2005, Moitinho et al. 2006, Vázquez et al. 2008). Once again, no indication has been found of an ongoing accretion event in this direction of the Galactic disk. In addition, the estimated ranges of distance, age and metallicity of the older metal poor population are consistent with those of thick disk stars at different distances from the Sun. These findings, together with the results of previous papers by us and other authors (Momany et al 2004, 2007), significantly weaken the proposed scenario of a dwarf galaxy in CMa being cannibalized by the Milky Way. Instead, all the observational evidence fits our current knowledge of the Galactic disk. The TGQ is indeed a complicated region due to the warp and the existence of the Local Arm. Only the detailed multicolour analysis we have been conducting in the last few years could provide a clear picture of the structure of the outer disk in the TGQ.
Acknowledgments
This study made use of the SIMBAD and WEBDA databases. A.M. acknowledges support from FCT (Portugal) through grant PDCT/CTE-AST/57128/2004.
References
- (1) Amores, E.B., Lépine, J.R.D., 2007, AJ 133, 1519
- (2) Baume, G., Moitinho, A., Vázquez, R.A., Solivella, G., Carraro, G., Villanova, S., 2006, MNRAS, 367, 1441
- (3) Bellazzini, M., Ibata, R., Martin, N., Irwin, M.J., Lewis, G.F., 2004, MNRAS 354, 1263
- (4) Bellazzini, M., Ibata, R., Martin, N., Lewis, G.F., Conn, B., Irwin, M.J., 2006, MNRAS 366, 865
- (5) Bensby, T., Zenn, A.E., Oey, M.S., Feltzing, S., 2007, ApJ 663, L13
- (6) Carraro G., Vázquez, R.A., Moitinho, A., Baume, G., 2005a, ApJ 630, L153
- (7) Carraro G., Geisler, D., Moitinho, A., Baume, G., Vázquez, R.A., 2005b, A&A, 442, 917
- (8) Carraro G., Moitinho, A., Zoccali, M., Vázquez, R.A., Baume, G., 2007, AJ, 133, 1058
- (9) Dias, W.S., Alessi, B.S., Moitinho, A., Lépine, J.R.D., 2002, A&A 389, 871
- (10) Dinescu, D.I., Martínez-Delgado, D., Girard, T.M., Pen̈arrubia, J., Rix, H.-W., Butler, D., van Altena, W.F., 2005, ApJ 631, L49
- (11) Fitzgeralg, M.P., 1968, AJ 73, 177
- (12) Girardi, L., Bressan, A., Bertelli, G., Chiosi, C., 2000, A&AS, 114, 371
- (13) Janes, K.A., 1991, in Precision Photometry: Astrophysics of the Galaxy, Proceedings of the conference held 3-4 October, 1990 at Union College, Schenectady, NY. Edited by A.G.D. Philip, A.R. Upgren and K.A. Janes. Schenectady, NY: Davis Press, p.233
- (14) de Jong, J.T.A., Butler, D.J. Rix, H.-W., Dolphin, A.E., Martínez-Delgado, D., 2007, ApJ 662, 259
- (15) Landolt, A.U., 1992, AJ 104, 340
- (16) López-Corredoira, M., Momany, Y., Zaggia, S., Cabrear-Lavers, A., 2007 A&A 472, L47
- (17) Martin, N.F., Ibata, R.A., Bellazzini, M., Irwin, M.J., Lewis, G.F., Dehnen, W., 2004, MNRAS 348, 12
- (18) Martínez-Delgado, D., Butler, D.J., Rix, H.W., Franco, V.I., Peñarrubia , J., Alfaro, E.J., Dinescu, D.I., 2005, ApJ 633, 205
- (19) May, J., Alvarez, H., Bronfman, L., 1997, A&A 327, 325
- (20) Moffat, A.F.J., Jackson, P.D., Fitzgerald, M.P., 1979, A&AS 38, 197
- (21) Moitinho, A., 2001, A&A 370, 436
- (22) Moitinho, A., Vázquez, R.A., Carraro, G., Baume, G., Giorgi, E.E., Lyra, W., 2006, MNRAS 368, L77
- (23) Momany, Y., Zaggia, S., Bonifacio, P., Piotto, G., de Angeli, F., Bedin, L.R., Carraro, G., 2004, A&A 421, L29
- (24) Momany, Y., Zaggia, S., Gilmore, G., Piotto, G., Carraro, G., Bedin, L. R., de Angeli, F., 2006, A&A 451, 515
- (25) Norris, J.E., Ryan, S.G., Beers, T.C., 1999, ApJS 123, 639
- (26) Patat, F., Carraro, G., 2001, MNRAS 325, 1591
- (27) Sandage, A., 1969, ApJ 158, 1115
- (28) Schlegel, D. J., Finkbeiner, D. P., Davis, M. 1998, ApJ, 500, 525
- (29) Stetson, P.,B., 1987, PASP 99, 191
- (30) Vázquez, R.A., May, J., Carraro, G., Bronfman, L., Moitinho, A., Baume, G., 2008, ApJ 672, 930