Structural anomalies of fluids:
Origins in second and higher
coordination shells
Abstract
Compressing or cooling a fluid typically enhances its static interparticle correlations. However, there are notable exceptions. Isothermal compression can reduce the translational order of fluids that exhibit anomalous waterlike trends in their thermodynamic and transport properties, while isochoric cooling (or strengthening of attractive interactions) can have a similar effect on fluids of particles with short-range attractions. Recent simulation studies by Yan et al. [Phys. Rev. E 76, 051201 (2007)] on the former type of system and Krekelberg et al. [J. Chem. Phys. 127, 044502 (2007)] on the latter provide examples where such structural anomalies can be related to specific changes in second and more distant coordination shells of the radial distribution function. Here, we confirm the generality of this microscopic picture through analysis, via molecular simulation and integral equation theory, of coordination shell contributions to the two-body excess entropy for several related model fluids which incorporate different levels of molecular resolution. The results suggest that integral equation theory can be an effective and computationally inexpensive first-pass tool for assessing, based on the pair potential alone, whether new model systems are good candidates for exhibiting structural (and hence thermodynamic and transport) anomalies.
I Introduction
A bulk equilibrium fluid is translationally invariant; i.e., its one-particle density, , is constant. Nonetheless, assuming spherically-symmetric interactions, the local density surrounding a reference particle is a function of distance from its center, where is the radial distribution function (RDF) of the fluid.Hansen and McDonald (2006) Although the RDF depends on both the form of the interparticle interactions and the thermodynamic state, some features of its shape are fairly general. For example, the RDF vanishes for less than the effective exclusion diameter of the particles. For larger , it shows an oscillatory decay toward unity with peaks loosely corresponding to coordination “shells”. Away from the critical point, the structure of the RDF typically persists for distances comparable to a few particle diameters, reflecting the short range of the interparticle correlations.
Studies of the liquid state have primarily focused on the particles in the first coordination shell. This is due in part to the important role that nearest neighbors are expected to play in determining many physicochemical properties. For example, both the non-ideal contribution to the equation of state of the hard-sphere fluid (see, e.g., Ref. Löwen, 2000) and the collision frequency in Enskog theories for transport processesChapman and Cowling (1970) scale with the “contact” density , where is the particle diameter. The hard-sphere equation of state is the standard reference system for perturbation theories.Hansen and McDonald (2006) It also accurately predicts how the thermodynamics of “hard-sphere” colloidal suspensions relate to their structure, as has recently been experimentally verified by confocal microscopy.Dullens et al. (2006) Furthermore, analysis of first-shell contributions to hydration structure and thermodynamics helps to understand and make predictions about a wide variety of aqueous solution properties.Némethy and Scheraga (1962); Pratt (1985); Beglov and Roux (1994); Matubayasi et al. (1994); Silverstein et al. (1999); Lockwood and Rossky (1999); Lockwood et al. (2000); Hummer et al. (2000); Paulaitis et al. (2002); Asthagiri et al. (2004); Dill et al. (2005)
Although the second shell of the RDF has received comparatively less attention, there is evidence that it also contains structural information relevant for understanding nontrivial behaviors of liquids. One notable feature is the shoulderTruskett et al. (1998) that it develops near the freezing transition, which in turn becomes a pronounced split peakFinney (1970); Bennett (1972); Rahman et al. (1976); Stillinger and Weber (1984); Hiwatari et al. (1984); Clarke and Wiley (1987); Tsumuraya and Watanabe (1990); Snook et al. (1991); Donev et al. (2005); O’Malley and Snook (2005) in supercooled liquid and glassy states. Analysis of the configurations that give rise to this structural motif indicate that it reflects frustration of icosahedralTsumuraya and Watanabe (1990) and emerging crystallineTruskett et al. (1998); O’Malley and Snook (2005) order in the fluid. Understanding how these these types of structural features connect to relaxation processes of supercooled liquids is an active area of research (see, e.g., Refs. Dzugutov et al., 2002; Jain and de Pablo, 2005; Shintani and Tanaka, 2006; Kawasaki et al., 2007).
In this work, however, we focus on the second and higher coordination shells of the RDF for a different reason: to understand their role in the structural anomalies of fluids. Interparticle correlations of most fluids are enhanced upon (i) compression or (ii) cooling (alternatively, strengthening of interparticle attractions). Nonetheless, there are a few systems of scientific interest that exhibit notably different behaviors. For example, compression induced disordering occurs in water and other fluids with anomalous waterlike trends in their thermodynamic and transport properties.Errington and Debenedetti (2001); Shell et al. (2002); Truskett and Dill (2002); Yan et al. (2005, 2006); de Oliveira et al. (2006a); Mittal et al. (2006a, b); Sharma et al. (2006); de Oliveira et al. (2007a); Agarwal et al. (2007); Agarwal and Chakravarty (2007); Yan et al. (2007a); de Oliveira et al. (2007b) Cooling (or attraction) induced disordering, on the other hand, can occur in fluids of particles with short-range attractive (SRA) interactions,Mittal et al. (2006a); Krekelberg et al. (2007) such as concentrated suspensions of colloids.
These anomalies do not appear to be first-shell effects. Rather, they reflect how structuring in second and more distant coordination shells responds to changes in thermodynamic or system parameters. For example, Yan et al.Yan et al. (2007a) recently demonstrated in an insightful paper how the structural anomaly of the five-site transferable interaction potential (TIP5P) modelMahoney and Jorgensen (2000) for water is quantitatively related to compression induced translational disordering of molecules in the second coordination shell. Similarly, Krekelberg et al.Krekelberg et al. (2007) have shown that the cooling (or attraction) induced structural anomaly of a square-well SRA fluid is due to weakening of second- and higher-shell pair correlations.
The goal here is to study the generality of the above findings. It is known that a number of models, with varying levels of molecular resolution, can qualitatively predict the structural anomalies of the aforementioned systems. Errington and Debenedetti (2001); de Oliveira et al. (2006a); Yan et al. (2007a); Mittal et al. (2006a, b); Krekelberg et al. (2007); Shell et al. (2002); Truskett and Dill (2002); de Oliveira et al. (2007a); Agarwal et al. (2007); Sharma et al. (2006); Agarwal and Chakravarty (2007); de Oliveira et al. (2007b); Yan et al. (2005, 2006) But do the anomalies exhibited by lower resolution models have the same microscopic origins as those of more detailed models? Moreover, can the behavior of the lower resolution models be predicted, at least qualitatively, by integral equation theory? If so, it would suggest that integral equation theory might serve as a valuable first-pass tool in assessing, based on the pair potential alone, whether new model systems might be good candidates for exhibiting structural anomalies.
Furthermore, although the structurally anomalous trends analyzed here are interesting in their own right, there is a more compelling reason to try to understand their origins. In short, they appear to be closely linked to other distinctive dynamic and thermodynamic behaviors. For example, in addition to being “structurally anomalous”, cold liquid water is also “dynamically anomalous” in that its self-diffusivity increases upon isothermal compression and “thermodynamically anomalous” in that its volume increases upon isobaric cooling. Errington and DebenedettiErrington and Debenedetti (2001) first noticed that these particular anomalies form a cascade in the temperature-density plane for the extended simple point charge (SPC/E) modelBerendsen et al. (1987) of water.Errington and Debenedetti (2001) Specifically, the thermodynamic anomaly occurs only for state points that also exhibit the dynamic anomaly. The dynamic anomaly, in turn, is only present for states that also exhibit the structural anomaly. Strong correlations between these three basic types of anomalies have since been documented for a wide variety of model systems with waterlike properties.de Oliveira et al. (2006a); Yan et al. (2007a); Shell et al. (2002); Truskett and Dill (2002); de Oliveira et al. (2007a); Sharma et al. (2006); de Oliveira et al. (2007b); Kumar et al. (2005); Esposito et al. (2006); Netz et al. (2006); Xu et al. (2006); Szortyka and Barbosa (2007)
A similar connection between structural and dynamic anomalies has now also been identified for model SRA fluids.Mittal et al. (2006a); Krekelberg et al. (2007) In those systems, the most commonly studied dynamic anomaly is an increase in self-diffusivity upon cooling (or strengthening of interparticle attractions), which can occur at sufficiently high particle concentrations.Eckert and Bartsch (2002); Pham et al. (2002); Bergenholtz and Fuchs (1999); Fabbian et al. (1999); Dawson et al. (2001); Zaccarelli et al. (2002); Sciortino (2002) Krekelberg et al.Krekelberg et al. (2007) discovered that the self-diffusivity anomaly for a square-well SRA fluid occurs only for state points that also exhibit the cooling (or attraction) induced structural anomaly discussed above. In other words, it appears that SRA fluids can also display a cascade of anomalies qualitatively similar to those of waterlike fluids.
Although structural and dynamic properties of these systems show unusual dependencies on quantities like temperature or density, the correlations between structure and dynamics are often similar to those found in simpler liquids (e.g., the hard-sphere fluid).Mittal et al. (2006a, b); Errington et al. (2006); Sharma et al. (2006); Krekelberg et al. (2007) In fact, it was recently demonstratedErrington et al. (2006) that the cascade of anomalies of one waterlike model system can be semi-quantitatively predicted based only on knowledge of the state dependencies of excess entropy, which measures structural order,Truskett et al. (2000) and quasi-universal excess entropy scalingsRosenfeld (1999, 1977); Dzugutov (1996) for the transport coefficients. All of this suggests that investigations like the present one, which probe the physics of structural anomalies, might also provide insights into dynamic and thermodynamic anomalies as well.
II Methods
We used molecular dynamics simulation and integral equation theory to examine various models from two classes of fluids known to exhibit structural anomalies: those with waterlike properties and those comprising particles with SRA interactions. For the integral equation theory analysis, we numerically solved the Ornstein-Zernike equationOrnstein and Zernike (1914) together with an approximate closure relation using the method of Labik et al.Labík et al. (1985) In the discussion of the models below, we mention the specific closures employed and provide further details about the molecular simulations.
We did not perform a systematic study here to determine which of many possible closure relationsHansen and McDonald (2006) provides the most quantitatively accurate description for each model. Rather, our focus was to explore whether integral equation theory solved with standard closure relations, such as Percus-Yevick (PY)Percus and Yevick (1958) or hypernetted-chain (HNC)van Leeuwen et al. (1959), can in fact qualitatively predict both the structural anomalies and their microscopic origins in the RDF. Molecular simulations of the model systems provide the data necessary to make that basic determination.
II.1 Waterlike fluid models
We investigated two waterlike models: (1) the SPC/E Berendsen et al. (1987) model and (2) a lower resolution “core-softened” de Oliveira et al. (2006b, a) model. We chose the SPC/E model because it represents one of the most commonly studied effective pair potentials for water, and it is known to qualitatively reproduce many of water’s distinctive thermodynamic, dynamic, and structural properties.Errington and Debenedetti (2001) As a result, it provides a reasonable baseline against which to compare simpler, lower resolution models. Details of our molecular dynamics simulations of the SPC/E model are the same as reported in Ref. Mittal et al., 2006a.
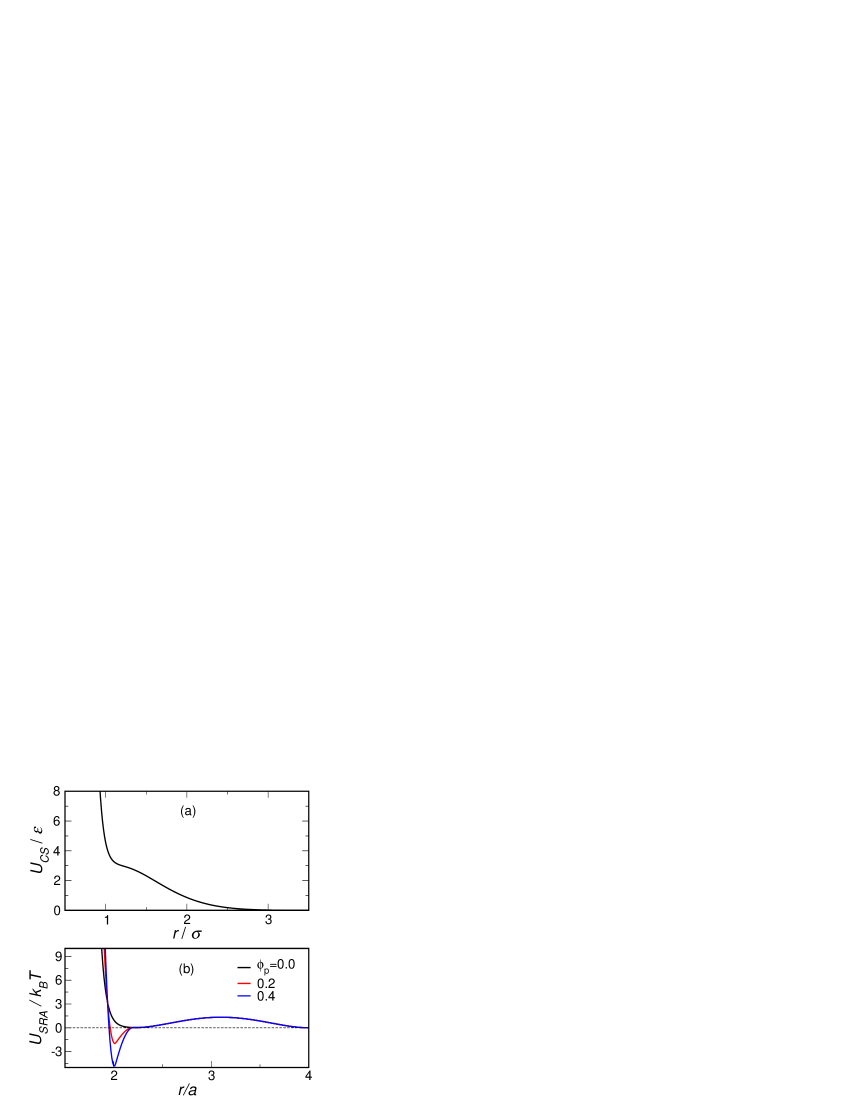
The core-softened modelde Oliveira et al. (2006b, a) that we studied is more schematic. It is defined by the effective pair potential [see Figure 1(a)],
| (1) |
where is the characteristic energy scale. The main idea behind this potential is that it has two different kinds of repulsions that act at different length scales. The harsh repulsion defines the effective hard-core diameter (), while the softer Gaussian repulsion extends to considerably larger distances. The end result is that the average interparticle separation, and hence the density, of this fluid can depend sensitively on both temperature and pressure. The model is similar to cold water in that it favors locally open (low-density) structures at moderate pressure and low temperature, but can collapse to denser structures when compressed or heated enough to overcome the soft Gaussian repulsion. Although this low resolution model does not provide an accurate molecular-level description of water, it does qualitatively reproduce many of its peculiar thermodynamic, structural, and kinetic behaviors.de Oliveira et al. (2006b, a); Mittal et al. (2006b); de Oliveira et al. (2007a)
To compute the properties of the core-softened model, we performed molecular dynamics simulations in the microcanonical ensemble using identical particles of mass . We used the velocity-Verlet technique for integrating the equations of motion with a time step of . For the integral equation theory analysis, we employed the HNC closure. We chose the HNC approximation because of its ability to describe the structure of another fluid with a soft Gaussian repulsion, the Gaussian-core model.Louis et al. (2000) We investigated both the SPC/E and core-softened models over a wide range of density and temperature, where they are known to exhibit structural anomalies.Errington and Debenedetti (2001); de Oliveira et al. (2006b, a); Mittal et al. (2006b); de Oliveira et al. (2007a)
II.2 SRA fluid models
The first SRA fluid model that we considered qualitatively describes a solution of (explicit) colloidal particles attracted to one another by depletion interactions due to the presence of (implicit) non-adsorbing polymers. The details of the colloidal pair potential are provided in Refs. Puertas et al., 2002 and Puertas et al., 2003, but we discuss some of its main features below. The colloids are spherical and their effective interactions consist of three parts. The first is a steeply repulsive, essentially hard-sphere (HS), contribution , where is the colloid diameter, is Boltzmann’s constant, and is temperature. The second term represents the aforementioned polymer-induced depletion attraction , approximated by the Asakura-OosawaAsakura and Oosawa (1958) potential. The strength of this attraction is proportional to the volume fraction of polymers in solution , while the range is controlled by the radius of gyration of the polymers , set in this case to . A soft repulsion is also added to the effective interparticle potentialPuertas et al. (2002) to prevent fluid-fluid phase separation. Figure 1(b) displays the total colloidal potential for three different polymer concentrations . The details of the molecular dynamics simulations that we performed for this fluid are the same as those reported in Ref. Krekelberg et al., 2006a, with one exception. In the original study, a weakly polydisperse system was investigated. Here, all particles considered had identical radius and mass . The advantage of focusing on a monodisperse system is that the pair correlations are unambiguously described by a single RDF, which facilitates the analysis discussed in the next section. For the integral equation theory of this SRA fluid, we employed the PY closure. The PY approximation is a natural choice here due to its simplicity and its ability to describe the structure of liquids with harshly repulsive, short-range potentials,Hansen and McDonald (2006) (in particular, other SRA fluidsDawson et al. (2001)).
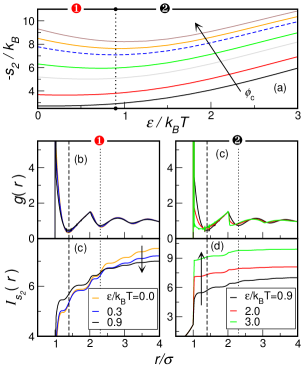
We also considered a simpler model SRA fluid: a system of identical square-well particles with attractive well depth - and width 0.03, where represents the hard-core diameter. This model is similar to others known to exhibit structuralKrekelberg et al. (2007) and dynamic Krekelberg et al. (2007); Zaccarelli et al. (2002) anomalies. We also use the PY closure in our integral equation theory analysis of this fluid for the reasons mentioned above.
II.3 Quantification of structural order
For each of the model fluids, we calculated the state dependencies of ,
| (2) |
where is the translational pair-correlation contributionNettleton and Green (1958); Baranyai and Evans (1989) to the excess entropy and is the number density. We used the orientationally averaged oxygen-oxygen RDF in Eq. 2 for the analysis of SPC/E water. It has been shown that not only quantifies the translational order exhibited by a fluid (the tendency of pairs of particles to adapt preferential separations),Truskett et al. (2000) but it also strongly correlates with the transport coefficients (see, e.g., Refs. Dzugutov, 1996; Mittal et al., 2006a; Krekelberg et al., 2007). Other translational order parameters have also been introduced to study the structure of molecular and colloidal fluids,Truskett et al. (2000); Torquato et al. (2000); Errington and Debenedetti (2001) but these measures are known to correlate strongly with ,Truskett et al. (2000); Errington and Debenedetti (2001) and thus we exclusively use the latter in our analysis.
To understand how the various coordination shells of the RDF contribute to , we also investigated the cumulative order integral , defined asKrekelberg et al. (2007)
| (3) |
Note that as .
Finally, we adopted the following criteria to identify structurally anomalous behavior.
| structural anomalies | (4a) | ||||
| structural anomalies | (4b) | ||||
As indicated in the Introduction, waterlike fluids exhibit structural anomaliesMittal et al. (2006a); Errington et al. (2006) and SRA fluids display structural anomalies.Krekelberg et al. (2007)
III Structural anomalies
III.1 Waterlike fluids
III.1.1 SPC/E water
.
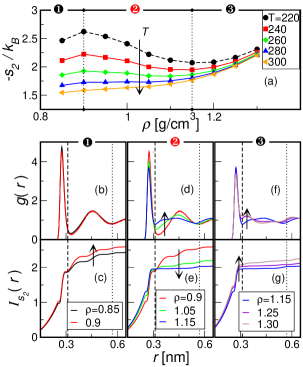
First, we discuss the simulation results for how (i.e., translational order) of the SPC/E water model changes with density . As can be seen in Figure 2(a), SPC/E water displays the structural anomalies of Eq. (4a) over the density range and . To gain insights into the origins of this behavior, we examine the orientationally averaged oxygen-oxygen RDF and as a function of along the isotherm for three different density regions: (1) the initial increase of at low densities [, Figs. 2(b,c)], (2) the anomalous decrease of at intermediate densities [, Figs. 2(d,e)], and (3) the increase of at high densities [, Figs. 2(f,g)].
Compressing the fluid in the lower-density region (1) has relatively little effect on the RDF [Fig. 2(b)], but it does lead to a small net increase in translational order. As can be seen from the behavior of in Fig. 2(c), the changes come primarily from the second shell. The reason is that the coordination number of water (approximately four, reflecting local tetrahedral hydrogen-bonding to nearest neighbors) is insensitive to changes in density over this range.Sciortino et al. (1991) As a result, the increase of is compensated by a slight decrease in the first peak of the RDF, and thus the first-shell contribution to the structural order remains largely unchanged. In the second shell, however, the change in density does not affect the RDF (i.e., the strength of the correlations with the central molecule). This means that compression induced hydrogen-bond bending has allowed more total water molecules into the second shell, which in turn leads to an overall increase in translational order.
On the other hand, further increases in density [region (2), result in a pronounced decrease in , i.e. the -structural anomaly. As can be seen in Fig. 2(d), the main implications of compression for the interparticle correlations are a dramatic flattening of the second coordination shell and an associated shifting inward of these molecules into the interstitial space between the first and second shells. These structural changes are consistent with the earlier simulation observationSciortino et al. (1991) that high local density can force a fifth molecule from the second shell into the periphery of the otherwise four-coordinated first shell. Inspection of [Fig. 2(e)] confirms that the decrease in structural ordering is almost entirely due to reduced correlations between the central and second-shell molecules. In fact, Yan et al. convincingly demonstrated that a similar structural anomaly in TIP5P water can also be attributed to compression induced translational disordering of the second shell.Yan et al. (2007a)
Can these structural changes explain water’s self-diffusity anomaly? Sciortino et al.Sciortino et al. (1991) argued, based on molecular simulation results, that the presence of a fifth molecule in the first coordination shell significantly lowers the barriers for translational and rotational motions of the central water molecule. This suggests that second-shell waters play a central role in water’s increased mobility under compression. Interestingly, since the self-diffusivity of SPC/E water is strongly correlated to over these conditions,Mittal et al. (2006a) one can independently draw the same conclusion from the data in Fig. 2.
Finally, we observe that, at sufficiently high densities [region (3), ], translational order again increases upon compression. This is “normal” behavior for dense liquids, and it simply reflects the fact that smaller volumes force particles to adopt locally ordered (i.e., efficient) packing structures.Truskett et al. (2000); Errington and Debenedetti (2001)
III.1.2 Core-softened model
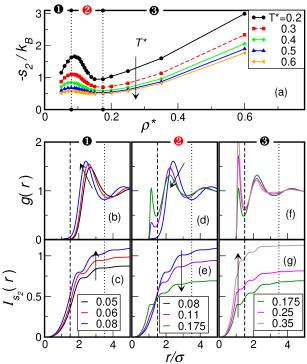
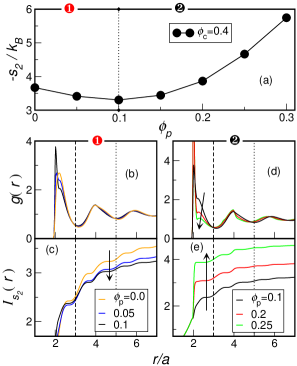
In this section, we investigate how the translational order of the lower resolution, core-softened model of Eq. 1 responds to changes in density. First, we consider the results from the molecular dynamics simulations. One striking feature of the data is that the behavior of as a function of reduced density , displayed in Fig. 3(a), is qualitatively similar to that of SPC/E water [see Fig. 2(a)]. Specifically, the core-softened model also displays -structural anomalies over the density range that become more pronounced at lower temperature.
Clearly, the core-softened model is very different from the SPC/E model in that the former does not provide a molecular description of water, and thus it does not favor the formation of tetrahedrally coordinated hydrogen-bond networks, etc. Nonetheless, as we explain below, the main “microscopic” origins of its density-dependent trends in structural order are basically the same as those for the SPC/E model.
In order to appreciate the similarity between these two models, it is helpful to first notice one difference. In the SPC/E model, the attractive “hydrogen-bond” interactions promote the formation of a first coordination shell, even at relatively low density. In contrast, since there are no attractions in the core-softened model, the Gaussian repulsion prevents the “first” coordination shell (near the hard-core diameter, ) from forming until sufficiently high density (). On the other hand, the “second” coordination shell (against the Gaussian repulsion, ) is present even at low density.
From a qualitative perspective, one might consider each core-softened particle as effectively representing a cluster of water molecules (e.g., a central water molecule and its four nearest neighbors).Yan et al. (2007b) In fact, Yan et al. have recently presented evidence that a mapping of this sort has quantitative merit when one compares, in appropriately reduced form, the behaviors of a core-softened ramp model to TIP5P water.Yan et al. (2007b) When viewed from this perspective, the formation of the first shell in the core-softened model at high density qualitatively corresponds, in the molecular picture, to additional water molecules (5, 6, etc.) penetrating the first shell of an otherwise four-coordinated central water molecule. Once this physical relationship between the two models is recognized, the similarities between their structural properties are easy to understand. To illustrate this, we carried out a structural analysis of the core-softened model identical to that presented above for the SPC/E model.
In particular, we examined the behavior of the RDF and [see Fig. 3(b-g)] for the core-softened model as a function of density along the isotherm for three different density regions: (1) the initial increase of at low densities [, Figs. 3(b,c)], (2) the anomalous decrease of at intermediate densities [, Figs. 3(d,e)], and (3) the increase of at high densities [, Figs. 3(f,g)].
As discussed above, the “first” shell of the RDF is not populated in this model at low density because the core-softened particles themselves loosely represent a central water and its four nearest neighbors. In this view, the initial compression of the core-softened fluid [region (1), ] has an effect that is similar to that seen for SPC/E water. The modest increase in that is observed is due to the increase in density and a minor enhancement of structuring in the second shell ().
Further compression of the core-softened model [region (2), ] leads to an anomalous decrease in structural order [Fig. 3(a)]. Figs. 3(d) and (e) indicate that the disordering is again due to a flattening and shifting inward of the second shell. Moreover, the “first” shell of the core-softened particles begins to emerge, which schematically represents, in the approximate molecular view discussed above, that additional water molecules are effectively penetrating into the four-coordinated first shell.
Similar to SPC/E water, it is known that there is a strong correlation between excess entropy and self-diffusivity for the core-softened model.Mittal et al. (2006b) This information, together with the results shown here, support the view that the self-diffusivity anomaly of the core-softened model is also linked to its density-dependent second-shell structure.
As expected, at higher density [region (3), ], compression leads to an increase in structural order due to simple-liquid-like structuring of particles in the first coordination shell [Figs. 3(f,g)]. In short, the qualitative response to changes in density of the structural order and its coordination-shell contributions for the core-softened model are very similar to those of the more detailed SPC/E water model. This finding is consistent with the recent demonstration that one can approximately map the anomalies of TIP5P water onto those of a similar two-scale ramp potential.Yan et al. (2007b)
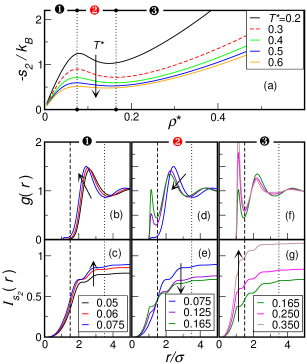
As a final point, we show in Fig. 4 that the integral equation theory of the core-softened model can qualitatively predict all of the trends shown in Fig. 3. The ability of this approach to reproduce the structural features seen in simulations, together with the quasi-universal connection between structure and transport coefficients of liquids,Rosenfeld (1999, 1977); Dzugutov (1996) suggests that integral equation theory might serve as a valuable first-pass tool in assessing whether other model systems represent good candidates for exhibiting static and dynamic anomalies. However, if the intention is to ultimately use it as a quantitatively accurate predictive tool, then more comprehensive investigations of alternative closure relationships, in the spirit of Ref. de Oliveira et al., 2006a, will be necessary.
III.2 SRA fluids
One of the key aspects of short-range attractive (SRA) fluids is that their structurally anomalous behavior occurs as a function of the reduced interparticle attractive strength at constant particle packing fraction , where represents the well depth of the interparticle attraction. In most typical atomic or molecular fluids, one finds that structural order () increases with . SRA fluids are anomalous in that, at sufficiently high values of , the opposite trend can be observed;Krekelberg et al. (2007); Mittal et al. (2006a) i.e., attractions counterintuitively decrease the amount of structural order.
In this section, we briefly discuss how we used molecular simulation and integral equation theory to gain insights into this trend. We accomplished this by exploring the various coordination-shell contributions to for the two model SRA fluids discussed in Section II.2.
III.2.1 Colloid-polymer mixture
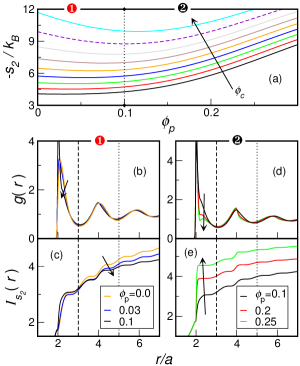
We begin by investigating the behavior of the model colloid-polymer systemPuertas et al. (2002, 2003) by molecular simulation. The effective colloid-colloid pair potential for this model was presented earlier in Fig. 1(b) for several values of polymer packing fraction . Since the reduced well-depth of this potential, , scales as , we analyze structural order below as a function of the latter.
In particular, Fig. 5(a) illustrates how varies as a function of at a particle packing fraction of . As expected for SRA fluids, exhibits a minimum at . In other words, this fluid displays the structural anomaly of Eq. (4b) for . To understand the origins of this trend, we study the RDF and the cumulative order integral as a function of in two qualitatively different regions: (1) the anomalous decrease in at low polymer concentrations (low interparticle attractions), and (2) the “normal” increase of at higher polymer concentrations (higher interparticle attractions).
What specific changes to coordination shell structure explain the attraction induced disordering that occurs at small [region (1), ]? First, note that strengthening interparticle attractions considerably increases but narrows the first peak of the RDF [Fig. 5(b)]. These two effects essentially cancel so that the first-shell contributions to are insensitive to over this range [see Fig. 5(c)]. However, attractions also slightly shift the higher coordination shells of the RDF inward and diminish their overall correlation with the central particle. These latter modifications to the structure of the second and higher coordination shells give rise to the anomalous decrease in the structural order of this system. They are also consistent with behavior observed in the recent Krekelberg et al.Krekelberg et al. (2007) simulations of the square-well SRA fluid discussed in the Introduction. A microscopic interpretation of this trend is that SRA interactions drive weak particle clustering at low (explaining the sharpening and narrowing of the first peak). This clustering, in turn, opens up channels of free volume in the fluid and disrupts the uniform hard-sphere-like packing order in the second and higher coordination shells.Krekelberg et al. (2006b, a); Puertas et al. (2004); Sciortino (2002)
Under conditions where the aforementioned structural anomaly occurs, increases in also increase the mobility of the fluid.Krekelberg et al. (2007) Very similar to the waterlike fluids discussed above, it is known that and self-diffusivity are strongly correlated for the model colloid-particle mixture.Mittal et al. (2006a) As a result, the self-diffusvity anomaly appears to also derive from subtle structuring effects in the second and higher coordination shells.
As one would expect, however, increasing ultimately increases structural order, if the interactions are sufficiently attractive [region (2), ]. The attractions lead to the formation of strongly bonded particle clusters,Krekelberg et al. (2006b, a); Puertas et al. (2004); Sciortino (2002) which is reflected by the increased height of the first peak of the RDF [Fig. 5(d)] and the associated rise in the first-shell contribution to [Fig. 5(e)].
In closing, we test in Figs. 6 and 7 whether integral equation theory is able to qualitatively capture these attraction induced structural changes for both model systems introduced in Section II.2: the colloid-polymer fluid and the square-well fluid, respectively. Comparison of Fig. 6 with Fig. 5 and Fig. 7 with Figure 4 of Ref. Krekelberg et al., 2007 demonstrate that this is indeed the case. The success of these predictions strengthens the case that integral equation theory will be a useful tool in assessing whether future model systems of interest might display structural anomalies.
III.3 Conclusions
Although the structural order of a fluid is usually enhanced by isothermal compression or isochoric cooling, a few notable systems show the opposite behaviors. Specifically, increasing density can disrupt the structure of waterlike fluids, while lowering temperature (or strengthening of attractive interactions) can weaken the correlations of fluids with short-range attractions. The two-body translational contribution to the excess entropy provides a quantitative measure of these changes in structural order. It is a particularly insightful quantity to study because (i) its contributions from the various coordination shells of the radial distribution function can be readily determined, and (ii) it correlates strongly with self-diffusivity, which allows it to provide insights into the dynamic anomalies of these fluids.
Here, we have presented a comprehensive study, by both molecular simulation and integral equation theory, of the coordination shell contributions to the two-body excess entropy for several model systems. These models incorporate different levels of molecular resolution, but all exhibit the aforementioned structural anomalies. The results of this study support the emerging view that the structural anomalies of these fluids can generally be attributed to quantifiable changes in the second and higher coordination shells of the radial distribution function. They also demonstrate that integral equation theory can serve as an effective first-pass tool for assessing, based on the pair potential alone, whether new model systems are good candidates for exhibiting static and dynamic anomalies.
Acknowledgements.
We thank Anatol Malijevsky for providing an efficient code for numerical solution of the integral equation theories analyzed in this work. W.P.K. acknowledges financial support of the National Science Foundation for a Graduate Research Fellowship. T.M.T. acknowledges financial support of the National Science Foundation (CTS 0448721), the David and Lucile Packard Foundation, and the Alfred P. Sloan Foundation. V.G. acknowledges financial support of the National Science Foundation (CTS-0347381) and the Robert A. Welch Foundation. Computer simulations for this study were performed at the Texas Advanced Computing Center (TACC).References
- Hansen and McDonald (2006) J. P. Hansen and I. R. McDonald, Theory of Simple Liquids (Academic, London, 2006), 3rd ed.
- Löwen (2000) H. Löwen, in Statistical Physics and Spatial Statistics, edited by K. R. Mecke and D. Stoyan (Springer, Berlin, 2000), vol. 554 of Lecture Notes in Physics, p. 295.
- Chapman and Cowling (1970) S. Chapman and T. G. Cowling, The Mathematical Theory of Non-uniform Gases (Cambridge University Press, 1970), 3rd ed.
- Dullens et al. (2006) R. P. A. Dullens, D. G. A. L. Aarts, and W. K. Kegel, Proc. Natl. Acad. Sci. USA 103, 529 (2006).
- Némethy and Scheraga (1962) G. Némethy and H. A. Scheraga, J. Chem. Phys. 36, 3401 (1962).
- Pratt (1985) L. R. Pratt, Annu. Rev. Phys. Chem. 36, 433 (1985).
- Beglov and Roux (1994) D. Beglov and B. Roux, J. Chem. Phys. 100, 9050 (1994).
- Matubayasi et al. (1994) N. Matubayasi, L. H. Reed, and R. M. Levy, J. Phys. Chem. 98, 10640 (1994).
- Silverstein et al. (1999) K. A. T. Silverstein, A. D. J. Haymet, and K. A. Dill, J. Chem. Phys. 111, 8000 (1999).
- Lockwood and Rossky (1999) D. M. Lockwood and P. J. Rossky, J. Phys. Chem. B 103, 1982 (1999).
- Lockwood et al. (2000) D. M. Lockwood, P. J. Rossky, and R. M. Levy, J. Phys. Chem. B 104, 4210 (2000).
- Hummer et al. (2000) G. Hummer, S. Garde, A. E. Garcia, and L. R. Pratt, Chem. Phys. 258, 349 (2000).
- Paulaitis et al. (2002) M. E. Paulaitis, L. R. Pratt, and G. D. Rose, Adv. Protein Chem. 62, 283 (2002).
- Asthagiri et al. (2004) D. Asthagiri, L. R. Pratt, M. E. Paulaitis, and S. B. Rempe, J. Am. Chem. Soc. 126, 1285 (2004).
- Dill et al. (2005) K. A. Dill, T. M. Truskett, V. Vlachy, and B. Hribar-Lee, Annu. Rev. Biophys. Biomol. Struct. 34, 173 (2005).
- Truskett et al. (1998) T. M. Truskett, S. Torquato, S. Sastry, P. G. Debenedetti, and F. H. Stillinger, Phys. Rev. E 58, 3083 (1998).
- Finney (1970) J. L. Finney, Proc. R. Soc. London, Ser. A 319, 479 (1970).
- Bennett (1972) C. H. Bennett, J. Appl. Phys. 43, 2727 (1972).
- Rahman et al. (1976) A. Rahman, M. J. Mandell, and J. P. McTague, J. Chem. Phys. 64, 1564 (1976).
- Stillinger and Weber (1984) F. H. Stillinger and T. A. Weber, Science 225, 983 (1984).
- Hiwatari et al. (1984) Y. J. Hiwatari, T. Saito, and A. J. Ueda, J. Chem. Phys. 81, 6044 (1984).
- Clarke and Wiley (1987) A. S. Clarke and J. D. Wiley, Phys. Rev. B 35, 7350 (1987).
- Tsumuraya and Watanabe (1990) K. Tsumuraya and M. S. Watanabe, J. Chem. Phys. 92, 4983 (1990).
- Snook et al. (1991) I. Snook, W. van Megen, and P. Pusey, Phys. Rev. A 43, 6900 (1991).
- Donev et al. (2005) A. Donev, S. Torquato, and F. H. Stillinger, Phys. Rev. E 71, 011105 (2005).
- O’Malley and Snook (2005) B. O’Malley and I. Snook, J. Chem. Phys. 123, 054511 (2005).
- Dzugutov et al. (2002) M. Dzugutov, S. I. Simdyankin, and F. H. M. Zetterling, Phys. Rev. Lett. 89, 195701 (2002).
- Jain and de Pablo (2005) T. S. Jain and J. J. de Pablo, J. Chem. Phys. 122, 174515 (2005).
- Shintani and Tanaka (2006) H. Shintani and H. Tanaka, Nat. Phys. 2, 200 (2006).
- Kawasaki et al. (2007) T. Kawasaki, T. Araki, and H. Tanaka, Phys. Rev. Lett. 99, 215701 (2007).
- Errington and Debenedetti (2001) J. R. Errington and P. G. Debenedetti, Nature 409, 318 (2001).
- Shell et al. (2002) M. S. Shell, P. G. Debenedetti, and A. Z. Panagiotopoulos, Phys. Rev. E 66, 011202 (2002).
- Truskett and Dill (2002) T. M. Truskett and K. A. Dill, J. Phys. Chem. B 106, 11829 (2002).
- Yan et al. (2005) Z. Yan, S. V. Buldyrev, N. Giovambattista, and H. E. Stanley, Phys. Rev. Lett. 95, 130604 (2005).
- Yan et al. (2006) Z. Yan, S. V. Buldyrev, N. Giovambattista, P. G. Debenedetti, and H. E. Stanley, Phys. Rev. E 73, 051204 (2006).
- de Oliveira et al. (2006a) A. B. de Oliveira, P. A. Netz, T. Colla, and M. C. Barbosa, J. Chem. Phys. 125, 124503 (2006a).
- Mittal et al. (2006a) J. Mittal, J. R. Errington, and T. M. Truskett, J. Phys. Chem. B 110, 18147 (2006a).
- Mittal et al. (2006b) J. Mittal, J. R. Errington, and T. M. Truskett, J. Chem. Phys. 125, 076102 (2006b).
- Sharma et al. (2006) R. Sharma, S. N. Chakraborty, and C. Chakravarty, J. Chem. Phys. 125, 204501 (2006).
- de Oliveira et al. (2007a) A. B. de Oliveira, M. C. Barbosa, and P. A. Netz, Physica A 386, 744 (2007a).
- Agarwal et al. (2007) M. Agarwal, R. Sharma, and C. Chakravarty, J. Chem. Phys. 127, 164502 (2007).
- Agarwal and Chakravarty (2007) M. Agarwal and C. Chakravarty, J. Phys. Chem. B 111, 13294 (2007).
- Yan et al. (2007a) Z. Yan, S. V. Buldyrev, P. Kumar, N. Giovambattista, P. G. Debenedetti, and H. E. Stanley, Phys. Rev. E 76, 051201 (2007a).
- de Oliveira et al. (2007b) A. B. de Oliveira, G. Franzese, P. A. Netz, and M. C. Barbosa, J. Chem. Phys. (2007b), in press.
- Krekelberg et al. (2007) W. P. Krekelberg, J. Mittal, V. Ganesan, and T. M. Truskett, J. Chem. Phys. 127, 044502 (2007).
- Mahoney and Jorgensen (2000) M. W. Mahoney and W. L. Jorgensen, J. Chem. Phys. 112, 8910 (2000).
- Berendsen et al. (1987) H. J. C. Berendsen, J. R. Grigera, and T. P. Straatsma, J. Phys. Chem. 91, 6269 (1987).
- Kumar et al. (2005) P. Kumar, S. V. Buldyrev, F. Sciortino, E. Zaccarelli, and H. E. Stanley, Phys. Rev. E 72, 021501 (2005).
- Esposito et al. (2006) R. Esposito, F. Saija, A. M. Saitta, and P. V. Giaquinta, Phys. Rev. E 73, 040502 (2006).
- Netz et al. (2006) P. A. Netz, S. V. Buldyrev, M. C. Barbosa, and H. E. Stanley, Phys. Rev. E 73, 061504 (2006).
- Xu et al. (2006) L. Xu, S. V. Buldyrev, C. A. Angell, and H. E. Stanley, Phys. Rev. E 74, 031108 (2006).
- Szortyka and Barbosa (2007) M. M. Szortyka and M. C. Barbosa, Physica A 380, 27 (2007).
- Eckert and Bartsch (2002) T. Eckert and E. Bartsch, Phys. Rev. Lett. 16, 125701 (2002).
- Pham et al. (2002) K. N. Pham, A. M. Puertas, J. Bergenholtz, S. U. Egelhaaf, A. Moussaïd, P. N. Pusey, A. B. Schofield, M. E. Cates, M. Fuchs, and W. C. K. Poon, Science 296, 104 (2002).
- Bergenholtz and Fuchs (1999) J. Bergenholtz and M. Fuchs, Phys. Rev. E 59, 5706 (1999).
- Fabbian et al. (1999) L. Fabbian, W. Gotze, F. Sciortino, P. Tartaglia, and F. Thiery, Phys. Rev. E 59, R1347 (1999).
- Dawson et al. (2001) K. Dawson, G. Foffi, M. Fuchs, W. Gotze, F. Sciortino, M. Sperl, P. Tartaglia, T. Voigtmann, and E. Zaccarelli, Phys. Rev. E 63, 011401 (2001).
- Zaccarelli et al. (2002) E. Zaccarelli, G. Foffi, K. A. Dawson, S. V. Buldyrev, F. Sciortino, and P. Tartaglia, Phys. Rev. E 66, 041402 (2002).
- Sciortino (2002) F. Sciortino, Nat. Mater. 1, 145 (2002).
- Errington et al. (2006) J. R. Errington, T. M. Truskett, and J. Mittal, J. Chem. Phys. 125, 244502 (2006).
- Truskett et al. (2000) T. M. Truskett, S. Torquato, and P. G. Debenedetti, Phys. Rev. E 62, 993 (2000).
- Rosenfeld (1999) Y. Rosenfeld, J. Phys.: Condens. Matter 11, 5415 (1999).
- Rosenfeld (1977) Y. Rosenfeld, Phys. Rev. A 15, 2545 (1977).
- Dzugutov (1996) M. Dzugutov, Nature 381, 137 (1996).
- Ornstein and Zernike (1914) L. S. Ornstein and F. Zernike, Proc. R. Acad. Sci. Amsterdam 17, 793 (1914).
- Labík et al. (1985) S. Labík, A. Malijevský, and P. Voňka, Mol. Phys. 56, 709 (1985).
- Percus and Yevick (1958) J. K. Percus and G. J. Yevick, Phys. Rev. 110, 1 (1958).
- van Leeuwen et al. (1959) J. M. J. van Leeuwen, J. Groeneveld, and J. de Boer, Physica 25, 792 (1959).
- de Oliveira et al. (2006b) A. B. de Oliveira, P. A. Netz, T. Colla, and M. C. Barbosa, J. Chem. Phys. 124, 084505 (2006b).
- Louis et al. (2000) A. A. Louis, P. G. Bolhuis, and J. P. Hansen, Phys. Rev. E 62, 7961 (2000).
- Puertas et al. (2002) A. M. Puertas, M. Fuchs, and M. E. Cates, Phys. Rev. Lett. 88, 098301 (2002).
- Puertas et al. (2003) A. M. Puertas, M. Fuchs, and M. E. Cates, Phys. Rev. E 67, 031406 (2003).
- Asakura and Oosawa (1958) S. Asakura and F. Oosawa, J. Polym. Sci. Polym. Symp. 33, 183 (1958).
- Krekelberg et al. (2006a) W. P. Krekelberg, V. Ganesan, and T. M. Truskett, J. Phys. Chem. B 110, 5166 (2006a).
- Nettleton and Green (1958) R. E. Nettleton and M. S. Green, J. Chem. Phys. 29, 1365 (1958).
- Baranyai and Evans (1989) A. Baranyai and D. J. Evans, Phys. Rev. A 40, 3817 (1989).
- Torquato et al. (2000) S. Torquato, T. M. Truskett, and P. G. Debenedetti, Phys. Rev. Lett. 84, 2064 (2000).
- Sciortino et al. (1991) F. Sciortino, A. Geiger, and H. E. Stanley, Nature 354, 218 (1991).
- Yan et al. (2007b) Z. Yan, S. V. Buldyrev, P. Kumar, N. Giovambattista, and H. E. Stanley, arXiv:0712.2048v1.
- Krekelberg et al. (2006b) W. P. Krekelberg, V. Ganesan, and T. M. Truskett, J. Chem. Phys. 124, 214502 (2006b).
- Puertas et al. (2004) A. M. Puertas, M. Fuchs, and M. E. Cates, J. Chem. Phys. 121, 2813 (2004).