New Constraints on the Efficiencies of Ram-Pressure Stripping
and the Tidal Disruption of Satellite Galaxies
Abstract
Using data from the Sloan Digital Sky Survey (SDSS) it has recently been shown that the red fraction of satellite galaxies increases with stellar mass. Semi-analytical models, however, predict red satellite fractions that are independent of stellar mass, and much higher than observed. It has been argued that this discrepancy owes to the fact that the models assume that satellite galaxies are instantaneously stripped of their hot gas reservoirs at the moment they are accreted into a bigger halo. In this letter we show that the fraction of red satellites can be brought in better agreement with the data by simply decreasing this stripping efficiency. However, this also results in a red fraction of massive centrals that is much too low. This owes to the fact that the massive centrals now accrete satellite galaxies that are bluer and more gas-rich. However, if a significant fraction of low mass satellite galaxies is tidally disrupted before being accreted by their central host galaxy, as suggested by recent studies, the red fractions of both centrals and satellites can be reproduced reasonably well. A problem remains with the red fraction of centrals of intermediate mass, which is likely to reflect an oversimplified treatment of AGN feedback.
Subject headings:
galaxies: general – galaxies: formation – intergalactic medium1. Introduction
Recently it has become clear that semi-analytical models for galaxy formation predict red satellite fractions that are much too high (Weinmann et al. 2006; Baldry et al. 2006). It has been argued that this owes to an oversimplified treatment of ram-pressure stripping (Gunn & Gott 1972) of the hot gaseous halos of satellite galaxies. In all semi-analytical models it is assumed that the entire hot gas reservoir of a galaxy is instantaneously stripped the moment it is accreted into a larger halo (i.e., the moment it becomes a satellite galaxy).
Although this was originally motivated by the fact that the vast majority of (faint) satellite galaxies in clusters are red and deficient in cold gas (e.g., Binggeli, Tammann & Sandage 1987), detailed analytical and hydrodynamical simulations have shown that the typical time scale for this stripping process (sometimes called ‘strangulation’) ranges from Gyr to 10 Gyr (e.g., Balsara, Livio & O’Dea 1994; Mori & Burkert 2000; Bekki, Couch & Shioya 2002; Mayer et al. 2006; McCarthy et al. 2008).
In this letter we study the impact of a prolonged strangulation on the colors of satellite and central galaxies as function of stellar mass. To that extent we implement a new recipe for ram pressure stripping of hot gaseous halos of satellite galaxies in a semi-analytical model for galaxy formation, and compare the red fractions of central and satellite galaxies to data obtained from a SDSS galaxy group catalogue.
2. Semi-Analytical Model
In order to model the colors of central and satellite galaxies we use the semi-analytical model of galaxy formation of Kang et al. (2005) and Kang, Jing & Silk (2006; hereafter K06), and we refer the reader to these two papers for details. Briefly, dark matter merger trees are extracted from a high resolution -body simulation (with subhalos resolved, Jing & Suto 2002) and populated with galaxies following a semi-analytical description. Galaxies are assumed to form at the centers of their dark matter halos, using recipes for cooling, star formation, super-nova feedback, radio-mode AGN feedback, and spheroid formation that are all very similar to those of Croton et al. (2006). When a dark matter halo with its associated ‘central’ galaxy is accreted by a larger halo, and thus becomes a subhalo, its central galaxy becomes a ‘satellite’ galaxy. The orbital evolution of satellite galaxies is tracked using the orbital evolution of its corresponding subhalo, up to the point where the subhalo is dissolved in the simulation. From that point on the satellite galaxy (now called an ‘orphan galaxy’) is merged with the central galaxy in the host halo after a dynamical friction time computed using the standard Chandrasekhar prescription. Throughout this paper, we adopt the same model parameters as in K06, for which the model reproduces the present-day luminosity function, and yields a bimodal color distribution in reasonable agreement with the data (see below). The only changes we make here regard the treatment of the stripping of hot gas around satellite galaxies.
In the standard model it is assumed that the hot gas associated with a halo is instantaneously stripped as soon as the halo is accreted by a larger halo (i.e., as soon as it becomes a subhalo). However, hydrodynamic simulations indicate that the ram-pressure stripping of the hot gas is not instantaneous, and may even not be complete after as much as 10 Gyr. Although the characteristic time scale of this stripping process varies from one simulation to the other, and ranges from Gyr to 10 Gyr (see §1), all simulations suggest that the stripping rate is approximately constant. Motivated by these findings we model the rate at which the subhalo is stripped of its hot gas as
| (1) |
Here is the hot halo gas mass of the satellite at accretion, is the characteristic time scale for stripping, and is the fraction of hot gas left after one characteristic time scale. In addition to being stripped, the hot gas reservoir of a satellite galaxy also decreases due to cooling. In order to compute the cooling rate of the hot gas associated with a satellite galaxy, we assume that the cooling radius and cooling time of the hot gas remain fixed at their values at the time of accretion. We also assume that the hot gas remains associated with the orphan galaxy even after its subhalo is dissolved in the N-body simulation (we will discuss this in §3). Finally, we ignore any potential dependency of or on the satellite mass, the host halo mass, the orbit of the subhalo, or the density distribution of the hot gas associated with the host halo. These assumptions are certainly oversimplified. However, the main aim of this paper is not to give the most accurate description of the rate at which the hot gas of satellite galaxies is stripped, but merely to investigate how changes in and impact on the colors of central and satellite galaxies.
3. results
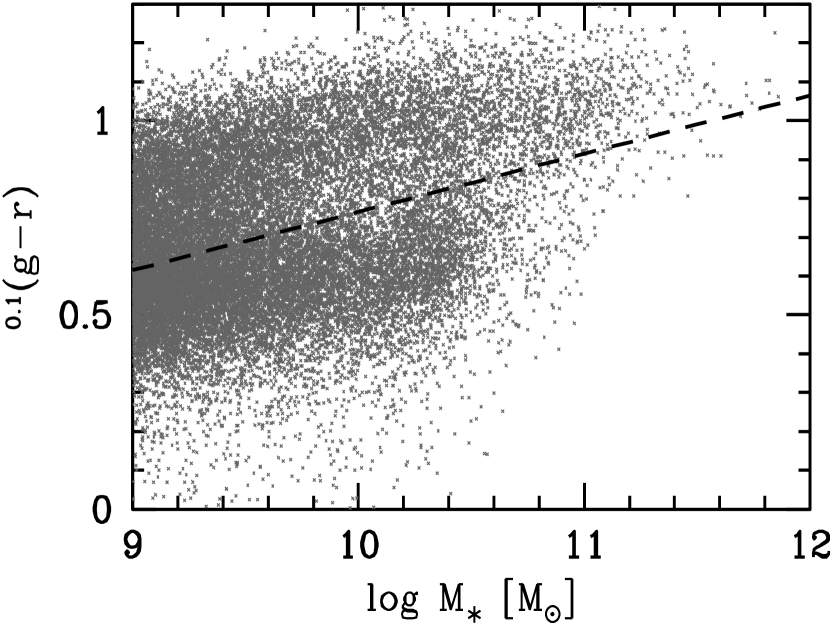
In a recent paper, van den Bosch et al. (2007; hereafter vdB07) used the SDSS galaxy group catalogue of Yang et al. (2007) to determine the red fractions of central and satellite galaxies as function of their stellar masses. Here central galaxies have been defined as the most massive group members (in terms of their stellar masses), while satellite galaxies are all group members that are not centrals. Using the fact that the color-stellar mass relation of SDSS galaxies is clearly bimodal, vdB07 split the galaxies in blue and red populations using the stellar-mass dependent cut,
| (2) |
Here is the color -corrected to redshift , and is the stellar mass computed using the relation between stellar mass-to-light ratio and color of Bell et al. (2003; eq. [2] in Yang et al. 2007).
For our model galaxies, we compute the colors using the stellar population synthesis code of Bruzual & Charlot (2003) for a Salpeter IMF111We have verified that our results are not sensitive to the choice of the IMF.. In order to model the photometric errors in the SDSS, we add a random, Gaussian error of 0.05 magn to both the and -band magnitudes of our model galaxies. Finally, for each model galaxy we compute the ‘observed’ stellar mass using the same relation between stellar mass-to-light ratio and color as used for the data. The color-stellar mass relation thus obtained for our fiducial model (with , corresponding to instantaneous stripping of the hot gas) is shown in Fig. 1. It clearly shows a bimodal color distribution, with a red sequence that extends to more massive galaxies than the blue sequence. This owes mainly to our inclusion of AGN feedback (see also Croton et al. 2006 and Bower et al. 2006), and is in good, qualitative agreement with the data (cf. Fig. 7 in vdB07). Upon closer inspection, though, we find that the colors of the red sequence and the bimodality scale are magn redder than for the SDSS. It is unclear at present what the origin of this color offset is. In order to limit its impact on our analysis, we split our model galaxies in red and blue populations using eq. (2) but with a zero-point that is magn redder (indicated by the dashed line in Fig. 1)

Fig.2 compares the red fractions, , of centrals (left-hand panel) and satellites (right-hand panel) as function of ‘observed’ stellar mass obtained from our fiducial, instantaneous stripping model (solid line) with the results of vdB07 (open symbols). Note that this model predicts a red satellite fraction that is , almost independent of stellar mass, and in clear disagreement with the data. As demonstrated in Weinmann et al. (2006) and Baldry et al. (2006) the semi-analytical models of Croton et al. (2006) and Bower et al. (2006), which also assume instantaneous stripping of the hot gas, suffer from exactly the same problem. As for the centrals, the model roughly predicts the correct red fraction at the massive end, which is mainly due to the inclusion of radio-model AGN feedback. However, for centrals with , the red fraction predicted by the model is a poor match to the data. At the low mass end (), it is upwards and inconsistent with the data. These low-mass galaxies are too red because the cold gas are consumed rapidly in their earlier, low-mass progenitors. Observational work (Kennicutt 1998) shows that stars form efficiently only in galaxies with surface density higher than a threshold, so star formation should be more inefficient in low-mass progenitors, but this process is ignored in our model. Another disagreement is seen at , where model galaxies are too blue. We will discuss this in §4 and in this section we focus on the model predictions at the massive end ().
As discussed in §1, the over-prediction of red satellites could be due to the inaccurate treatment of hot gas stripping from satellite galaxies. To test this, we now consider models with less efficient stripping. Seen from eq.(1) that this can be obtained by increasing or , and both are found to have similar trends on model predictions. Here we show only results by changing . The dotted and dashed lines in Fig. 2 show the results obtained using eq. (1) with and Gyr and 10 Gyr, respectively. The effects of a prolonged stripping are twofold. First of all, as expected, it reduces the red fraction of satellite galaxies. Note that there is relatively little difference between the models with Gyr and 10 Gyr, and that neither model can reproduce the detailed stellar mass dependence of observed. Secondly, both models predict a much lower red fraction among the most massive central galaxies, ruining the good agreement achieved with the fiducial model. This owes to the fact that the central galaxies now ‘accrete’ more blue satellite galaxies with significant amounts of fresh cold gas which triggers a starburst in the central galaxy. In principle, we could improve the fit of the red fraction of the satellites at the low mass end by making and/or depend on the stellar mass of the satellite galaxy, but this would only worsen the red fraction of the (massive) centrals. Furthermore, since the massive centrals are now too blue (on average), the red fraction of the massive satellites (which were centrals before they were accreted) is now also too low. Clearly, simply prolonging the stripping of the hot gas of satellite galaxies creates more problems than it solves.

How can we prevent the massive galaxies from becoming too blue? Clearly, we need to prevent the (massive) central galaxies from accreting orphan galaxies that are too blue and that have significant amounts of cold gas. As a first attempt we assume that a satellite galaxy is completely stripped of its hot gas once it becomes an orphan galaxy (i.e., when its subhalo in the numerical simulation dissolves). The resulting red fractions are shown as solid lines in the upper panels of Fig.3. A comparison with the dotted lines in Fig. 2 shows that this has little impact on the red fractions. If we assume, however, that the satellite is also stripped of its cold gas once it becomes an orphan we obtain the results shown by the dashed lines in Fig.3. Although in good agreement with the data at the massive end, we don’t consider this model very physical.
Recently, a number of studies have argued that the lack of evolution in the massive end of the galaxy stellar mass function, and the presence of a significant amount of intra-cluster light, suggest that a significant fraction of satellite galaxies is (tidally) disrupted before it has the chance of being accreted by its central host galaxy (e.g. Mihos et al. 2005; Zibetti et al. 2005; Monaco et al. 2006; Conroy, Wechsler & Kravtsov 2007). The lower panels of Fig.3 show the red fractions obtained if we assume that a certain fraction of satellite galaxies is tidally disrupted once they become orphans. The solid lines correspond to a model in which 50 percent of all orphans with a stellar mass are tidally disrupted. This model yields red satellite fractions that are in good agreement with the data, without causing a serious under-prediction of the red fraction of massive centrals. For comparison, the dashed lines correspond to a model in which 50% of all orphan galaxies are tidally disrupted, independent of their stellar mass. This causes a drastic under-prediction of the red fractions of massive centrals and satellites, which owes to fact that the number of major mergers experienced by a central galaxy is effectively reduced by a factor two. Consequently, the majority of massive centrals are now disk dominated and the associated AGN feedback (assumed to be proportional to the mass of the spheroid, see K06) is not sufficiently efficient to suppress the cooling of hot gas.
4. Conclusions
We have used a semi-analytical model of galaxy formation to study the fractions of red centrals and satellites as functions of their stellar mass. In agreement with Weinmann et al. (2006) and Baldry et al. (2007) we find that the models severely over-predict the red fraction of satellite galaxies. This owes to an oversimplified treatment of ram-pressure stripping of the hot gas associated with satellite galaxies. In particular, all semi-analytical models assume that the hot gas reservoir of a galaxy is instantaneously stripped the moment it is accreted into a bigger halo (i.e., the moment it becomes a satellite galaxy). We have demonstrated that the fractions of red satellites can be brought in better agreement with the data, if the efficiency of this stripping process is significantly reduced. However, the implication is that massive centrals also become bluer to the extent that their red fraction is much too low. This owes to the fact that the satellite galaxies that are accreted by the centrals are now bluer and more gas rich. This problem can be prevented if roughly half of all satellite galaxies with a stellar mass are tidally disrupted prior to being accreted by the central host galaxy. This is in qualitative agreement with the lack of evolution in the massive end of the galaxy stellar mass function, and with the presence of a significant amount of intra-cluster light.
All models presented here predict a red fraction of central galaxies with that is significantly too low. As shown by Baldry et al. (2006), the semi-analytical model of Croton et al. (2006) suffers from exactly the same problem, while the model of Bower et al. (2006) seems to be in better agreement with the data. The main difference between the model of Bower et al. and those presented here and in Croton et al. is the way in which the efficiency of AGN feedback scales with galaxy properties. In fact, for galaxies with , QSO activities are commonly seen across cosmic time, and it has been shown that QSO wind can also quench their star formation (e.g., Di Matteo, Springel & Hernquist 2005). As already eluded to in Weinmann et al. (2006), it thus seems that the red fractions of central galaxies as function of their stellar mass yield important constraints on the efficiency of AGN feedback (or any other mechanism that can quench the star formation in central galaxies, e.g., Birnboim, Dekel & Neistein 2007). Although a study of radio AGN or QSO feedback is beyond the scope of this paper, we emphasize that a modification of the red fraction of central galaxies will also modify that of the satellites. After all, the former are the direct progenitors of the latter. In particular, a model that would predict a higher red fraction of centrals with requires an even lower efficiency of ram pressure stripping of the hot gas of satellites than obtained here.
References
- Baldry et al. (2006) Baldry, I.K., Balogh, M.L., Bower, R.G., Glazebrook, K., Nichol, R.C., Bamford, S.P., & Budavari T., 2006, MNRAS, 373, 469
- Balsara et al. (1994) Balsara, D., Livio, M., & O,Dea, C.P., 1994, ApJ, 437, 83
- Bekki et al. (2002) Bekki, K., Couch, W.J., & Shioya, Y., 2002, ApJ, 577, 651
- Bell et al. (2003) Bell, E.F., McIntosh, D.H., Katz, N.,& Weinberg, M.D., 2003, ApJS, 149, 289
- Binggeli et al. (1987) Binggeli, B., Tammann, G.A., & Sandage, A., 1987, AJ, 94, 251
- Birnboim et al. (2007) Birnboim, Y., Dekel, A.,& Neistein, E., 2007, MNRAS, 380, 339
- Bower et al. (2006) Bower, R.G., Benson, A.J., Maldon, R., Helly, J.C., Frenk, C.S., Baugh, C.M., Cole, S., & Lacey, C.G.,2006, MNRAS, 370, 645
- Bruzual et al. (2003) Bruzual, G., & Charlot, S., 2003, MNRAS, 344, 1000
- Conroy et al. (2007) Conroy, C., Wechsler, R.H., & Kravtsov, A.V., 2007, ApJ, 668, 826
- Croton et al. (2006) Croton, D.J., et al., 2006, MNRAS, 365, 11
- Di Matteo et al. (2005) Di Matteo, T., Springel, V., & Hernquist, L., 2005, Nature, 433, 604
- Gunn & Gott (1972) Gunn, J.E., & Gott, J.R.I., 1972, ApJ, 176, 1
- Jing et al. (2002) Jing, Y.P., & Suto, Y., 2002, ApJ, 574, 538
- Kang et al. (2005) Kang, X., Jing, Y.P., Mo, H.J, & Börner, G., 2005, ApJ, 631, 21
- Kang et al. (2006) Kang, X., Jing, Y.P., & Silk, J., 2006, ApJ, 648, 820 (K06)
- Kennicutt (1998) Kennictt, R. C., 1998, ApJ, 498, 541
- Mayer et al. (2006) Mayer, L., Mastropietro, C., Wadsley, J., Stadel, J., & Moore, B., 2006, MNRAS, 369, 1021
- McCarthy et al. (2007) McCarthy, I.G., Frenk, C.S., Font, A.S., Lacey, C.G., Bower, R.G., Mitchell, N.L., Balogh, M.L., & Theuns, T., 2008, MNRAS, 383, 593
- Mihos et al. (2005) Mihos, J.C., Harding, P., Feldmeier, J.,& Morrison, H., 2005, ApJ, 631L, 41
- Monaco et al. (2006) Monaco, P., Murante, G., Borgani, S., & Fontanot, F., 2006, ApJ, 652L, 89
- Mori & Burkert (2000) Mori, M., & Burkert, A., 2000, ApJ, 538, 559
- Springel et al. (2001) Springel, V., White, S.D.M., Tormen, G., & Kauffmann, G., 2001, MNRAS, 328, 726
- Yang et al. (2007) Yang, X., Mo, H.J., van den Bosch, F.C., Pasquali, A., Li,C., & Barden, M., 2007, ApJ, 671, 153
- van den Bosch et al. (2007) van den Bosch, F.C., et al., preprint, (arXiv:0710.3164) (vdB07)
- Weinmann et al. (2006) Weinmann, S.M., van den Bosch, F.C., Yang, X., Mo, H.J., Croton, D.J., & Moore, B., 2006, MNRAS, 372, 1161
- Zibetti et al. (2005) Zibetti, S., White, S.D.M., Schneider, D.P., & Brinkmann, J., 2005, MNRAS, 358, 949