Metallicity Effects on Dust Properties in Starbursting Galaxies
Abstract
We present infrared observations of 66 starburst galaxies over a wide range of oxygen abundances, to measure how metallicity affects their dust properties. The data include imaging and spectroscopy from the Spitzer Space Telescope, supplemented by groundbased near-infrared imaging. We confirm a strong correlation of aromatic emission with metallicity, with a threshold at a metallicity [] 8. The large scatter in both the metallicity and radiation hardness dependence of this behavior implies that it is not due to a single effect, but to some combination. We show that the far-infrared color temperature of the large dust grains increases towards lower metallicity, peaking at a metallicity of 8 before turning over. We compute dust masses and compare them to HI masses from the literature to derive the gas to dust ratio, which increases by nearly 3 orders of magnitude between solar metallicity and a metallicity of 8, below which it flattens out. The abrupt change in aromatic emission at mid-infrared wavelengths thus appears to be reflected in the far-infrared properties, indicating that metallicity changes affect the composition of the full range of dust grain sizes that dominate the infrared emission. In addition, we find that the ratio L(8 µm)/L(TIR), important for calibrating 24 µm measurements of high redshift galaxies, increases slightly as the metallicity decreases from solar to 50% of solar, and then decreases by an order of magnitude with further decreases in metallicity. Although the great majority of galaxies show similar patterns of behavior as described above, there are three exceptions, SBS 0335-052E, Haro 11, and SHOC 391. Their infrared SEDs are dominated energetically by the mid-IR near 24 µm rather than by the µm region. In addition, they have very weak near infrared outputs and their SEDs are dominated by emission by dust at wavelengths as short as 1.8 µm. The latter behavior indicates that the dominant star forming episodes in them are extremely young. The component of the ISM responsible for the usual far infrared emission appears either to be missing, or inefficiently heated, in these three galaxies.
Subject headings:
galaxies: ISM—infrared: galaxies1. Introduction
One of the early discoveries of infrared astronomy was the substantial infrared output of star forming galaxies (Kleinmann & Low, 1970). It quickly became apparent that the infrared emission was ubiquitous and represented a substantial portion of the bolometric output associated with recent star formation, since most of the ultraviolet and optical emission of the young stars is absorbed and re-emitted in the infrared (Rieke & Low, 1972; Rieke & Lebofsky, 1979; Soifer et al., 1987). Since then, this phenomenon has been studied extensively (as summarized in many reviews, e.g., Telesco (1988); Moorwood (1996); Sanders & Mirabel (1996); Kennicutt (1998); Genzel & Cesarsky (2000); Sauvage et al. (2005); Lagache et al. (2005)). To first order, this work has established that the overall properties of the best-studied star-forming and infrared-luminous galaxies are dependent on two parameters: age and luminosity. Thus, the spectral energy distributions have been fitted with templates that vary primarily with luminosity (e.g., Devriendt et al. (1999); Chary & Elbaz (2001); Dale & Helou (2002)), and stellar population synthesis models demonstrate how the characteristics of the galaxy evolve with the age of the dominant star-forming episode (e.g., Rieke et al. (1993); Leitherer & Heckman (1995); Engelbracht et al. (1998)).
The initial studies of infrared galaxies were largely confined to relatively luminous, massive, and hence metal-rich examples. Indications that metal-poor low-luminosity galaxies might behave differently were found in the extensive mid-infrared spectroscopic survey by Roche et al. (1991). With improvements in sensitivity and sophistication of mid and far infrared instrumentation, it has become apparent that metallicity - and the accompanying changes in the hardness of the UV radiation field - constitutes a third critical parameter influencing the overall infrared properties of star-forming galaxies. The most dramatic dependence applies to the mid-IR aromatic features (sometimes termed ”PAH” features). In high metallicity galaxies, these features are quite similar in strength and other properties (Roche et al., 1991; Dale et al., 2007). Spectra obtained with the Infrared Space Observatory (ISO) showed that they are significantly weaker in a number of low-metallicity galaxies (Thuan et al., 1999; Madden, 2000; Galliano et al., 2003, 2005). Observations with Spitzer have confirmed this trend and indicated that there is a fairly sharp transition in the relative aromatic feature strength near a metallicity of (Houck et al., 2004; Engelbracht et al., 2005; Wu et al., 2006; Madden et al., 2006).
Is the change in aromatic feature characteristics a direct result of the low metallicity, or is the fundamental effect due to the increased hardness of the interstellar UV radiation field in low metallicity environments? Is the change confined to the aromatic carriers, or do other components of the interstellar dust undergo changes also? With the sensitivity of Spitzer, it is possible to explore these questions. In this paper, we describe infrared measurements of a sample of 66 star-forming galaxies over a very wide range of oxygen abundances (which we treat as measurements of the total metallicities), . We find systematic changes in the behavior of the far-infrared color temperatures and in the dust masses near the same metallicity where the aromatic feature strength appears to change. Thus, near this metallicity, there may be a general change in dust properties over the full range of sizes and compositions that contribute to the observed infrared emission.
In addition to providing insights to the composition and behavior of the interstellar dust, an understanding of galaxy behavior with metallicity is necessary to interpret infrared observations of galaxies at high redshift, where their metallicities are observed to be lower (by up to a factor of order two) than locally (Liang et al., 2004; Mouhcine et al., 2006; Rupke et al., 2007). Since our study includes this range in the overall context of infrared behavior with metallicity, we can compare with the observed infrared properties at high redshift. We find evidence for an increase in L(8 µm)/L(TIR) with decreasing metallicity down to half solar. This effect would result in overestimates of L(TIR) based on observations at 24 µm of galaxies at z 2, consistent with the bias reported by Rigby et al. (2007) in studies of luminous galaxies near this redshift.
Our discussion begins in §2 by describing the sample, how the data were reduced, and how the photometric and spectroscopic measurements were made. We describe basic properties of the galaxies in §3, including spectral energy distributions (SEDs) and luminosities. §4 describes the effects of metallicity on the galaxy infrared properties. The paper is summarized in §6.
2. Sample and Data Reduction
The sample includes well-known starbursting or star-forming galaxies from the literature, which cover as wide a range of metallicities as possible. This includes I Zw 18, which for decades since its identification as a low-metallicity galaxy (Searle & Sargent, 1972) remained the lowest metallicity star-forming galaxy known, only having been supplanted in that role recently by SBS 0335-052W (Izotov et al., 2005) and DDO 68 (Izotov & Thuan, 2007). Large, metal-rich starburst galaxies like NGC 2903 and NGC 5236 (M83) are also included. The metallicity range in between is more-or-less evenly sampled, with special emphasis placed on galaxies with metallicities below 8.1 (throughout this paper, we quote metallicities as oxygen abundances in units of 111The solar oxygen abundance on this scale is 8.7 (Allende Prieto et al., 2001)., which we sometimes abbreviate as “Z”), which, as discussed in §1, is a critical metallicity for the aromatic emission in the MIR. We also gathered as many galaxies as we could find in the range below a metallicity of 7.6, where galaxies are most likely to be dominated by an unevolved stellar population (Izotov & Thuan, 1999). The list of sample galaxies and their metallicities and distances is provided in Table Metallicity Effects on Dust Properties in Starbursting Galaxies. All metallicities in this paper were computed by us, using the sources indicated in the table, to ensure they lie on the same scale. Our new values are similar to those in the literature, with a mean difference of 0 and a DISPERSIon of 0.1 dex, and our new values eliminated a few significant outliers: the largest difference, Tol 2138-405, is 0.41 dex higher than the literature value. Any new distances quoted in this paper have been computed using the redshift from the NASA Extragalactic Database (NED), the Hubble flow model of Mould et al. (2000), and H km/s/Mpc. Left out of the sample were galaxies with well-known Active Galactic Nuclei (AGN).
For each galaxy in the sample, we performed imaging in the 7 photometric bands provided by the Infrared Array Camera (IRAC; Fazio et al., 2004) and Multiband Imaging Photometer for Spitzer (MIPS; Rieke et al., 2004) instruments on the Spitzer Space Telescope (Werner et al., 2004). We supplement these measurements with near-infrared (NIR) imaging in the J, H, and Ks bands from the literature or new measurements using the infrared camera at the Steward Observatory Bok Telescope. The resulting suite of imaging covers the µm range. For 43 of the targets, we also obtained (or retrieved from the Spitzer archive) spectra over the µm range with Spitzer’s Infrared Spectrograph (IRS; Houck et al., 2004).
2.1. Reduction of Imaging Data
The MIPS data (24 µm, 70 µm, and 160 µm) were generally obtained using the “photometry” mode, in which a standard set of dithered images are obtained (with 14, 10, and 2 images per cycle at 24 µm, 70 µm, and 160 µm, respectively) resulting in a full-coverage field-of-view of ′. For most sources, we obtained 2, 2, and 4 cycles of 3, 10, and 10 second images at 24 µm, 70 µm, and 160 µm, respectively, while half as many cycles were obtained for the brightest ( Jy) targets. The one exception is the large, nearby galaxy M83, which was observed twice in the medium-rate scan map mode, but for which the reduction of the data was equivalent to the photometry observations. The data were reduced using version 3.06 of the MIPS Data Analysis Tool (DAT; Gordon et al., 2005), which performs all the steps (slope fitting, calibration, and mosaicking) needed to produce an image of the target. We applied the techniques for removal of low-level artifacts and the flux calibration as described by Engelbracht et al. (2007); Gordon et al. (2007); Stansberry et al. (2007) at 24 µm, 70 µm, and 160 µm, respectively.
The IRAC observations generally consisted of 4 dithered 30-second images in each of 4 bands (3.6 µm, 4.5 µm, 5.8 µm, and 8.0 µm). The data were fully reduced by the Spitzer Science Center (SSC) pipeline.
The new NIR data presented here were obtained using the camera at the Steward Observatory Bok Telescope, over several runs between 2000 and 2006. The typical observing sequence consists of 32, 32, and 48 dithered exposures 30, 30, and 20 seconds in length in the J, H, and Ks bands, respectively. The data were reduced in a standard way, by subtracting a dark image, applying a custom flat field (made from each object’s data, after masking out the source), subtracting the background, then shifting and averaging the data to make a single mosaic image for each target and band. The flux calibration was determined using stars in the field that were also measured by the 2 Micron All Sky Survey (2MASS; Skrutskie et al., 2006).
2.2. Photometry
Aperture photometry was performed on the imaging data using the “imexam” and “imstat” tasks in the Image Reduction and Analysis Facility (IRAF)222IRAF is distributed by the National Optical Astronomy Observatories, which are operated by the Association of Universities for Research in Astronomy, Inc., under cooperative agreement with the National Science Foundation.. We sized the apertures to encompass the obvious (meaning visible above the noise level) emission from each galaxy. We measured the noise in each image by computing sigma for the Gaussian that best fit the histogram of pixels in the background. We estimated confusion noise due to background galaxies by assuming the noise levels are 0.056, 3.2, and 45 mJy at 24, 70, and 160 µm, respectively (Dole et al., 2004). (For this sample, this term is only significant at 160 µm, being greater than 50% of other noise sources for the faint and/or diffuse targets DDO 187, HS 0822+3542, SBS 1102+606, Tol 1214-277, UGCA 292, and UM 461). We converted this to a per-pixel uncertainty, assuming a source beam 2 pixels in radius. The noise appropriate to the aperture used to measure each galaxy (due both to photon noise and confusion) was then added in quadrature to the calibration uncertainty for each band: 2% (NIR; Cohen et al., 2003), 3% (IRAC; Reach et al., 2005), 2% (24 µm; Engelbracht et al., 2007), 5% (70 µm; Gordon et al., 2007), and 12% (160 µm; Stansberry et al., 2007).
The local background level was subtracted from each measurement, typically by measuring the counts in an annular region around the source. For galaxies with low radial symmetry (i.e., edge-on galaxies or diffuse dwarfs without a well-defined center), we measured the background in a rectangular region off the galaxy, of similar size to the aperture used to measure the galaxy. The IRAC images in bands 1 and 2 typically contain many foreground stars. For any galaxy so extended ( or more) that an annular measurement would not reflect accurately this stellar contribution, we measured the “background” (which includes a Galactic foreground) off the source, in an aperture with a size identical to the one used to measure the source.
We applied aperture corrections to the IRAC and MIPS measurements to make them reflect the global flux density of each target. The aperture corrections were generally 10% or less, except for the correction to surface brightness in the IRAC 5.8 µm and 8.0 µm bands (25%; Reach et al., 2005) and in the smallest apertures for the MIPS measurements, where the corrections were as large as 17%, 51%, and 82% at 24 µm, 70 µm, and 160 µm, respectively. As the color corrections for red sources (in the Spitzer bands) approach 10%, we also applied color corrections to the IRAC and MIPS measurements, which we determined by computing the power-law index that fit the data for the band in question and the next longest band (except at 160 µm, where used the 70/160 µm ratio) and then interpolating in the color-correction tables supplied in each instrument handbook. The galaxies are well-resolved in the NIR data and have colors similar to stars, so aperture and color corrections are small and none were applied.
We present the aperture-corrected, color-corrected photometry in Tables 2 and Metallicity Effects on Dust Properties in Starbursting Galaxies, where we have converted the NIR magnitudes to Jy using the zero points from Cohen et al. (2003).
The coordinates of some of the galaxies in this sample (especially the faint, low-metallicity ones) available in NED are often uncertain by several arcseconds. Furthermore, for any galaxy, the peak infrared position can differ from that measured at optical wavelengths due to extinction. As a convenience for the reader, we provide coordinates measured in the shortest wavelength (and therefore highest angular resolution) Spitzer band, 3.6 µm, in Table 4. Most of the galaxies have an obvious central peak for which we measured the centroid, but a few nearby galaxies have no obvious infrared peak and the value we report is derived from ellipse fitting, as indicated in the table.
2.3. Reduction of Spectral Data
The spectral data were reduced using the S14 version of the SSC pipeline. We used the automated extractions, which treat every target like a point source. This is appropriate for many of the low-metallicity galaxies, which tend to be compact (and thus have small angular extent in this sample). For extended sources, the mismatch of the slit sizes results in offsets between spectral segments extracted from different slits. We compensate for this by applying multiplicative corrections to all the spectral segments, forcing them to match where they overlap (and taking the longest-wavelength segment, LL1, as the baseline). The typical corrections for compact sources are small, only 2%, but can range up to a factor 2.5 for extended targets.
2.4. Measurements of Spectral Features
3. Results
3.1. Spectral Energy Distributions
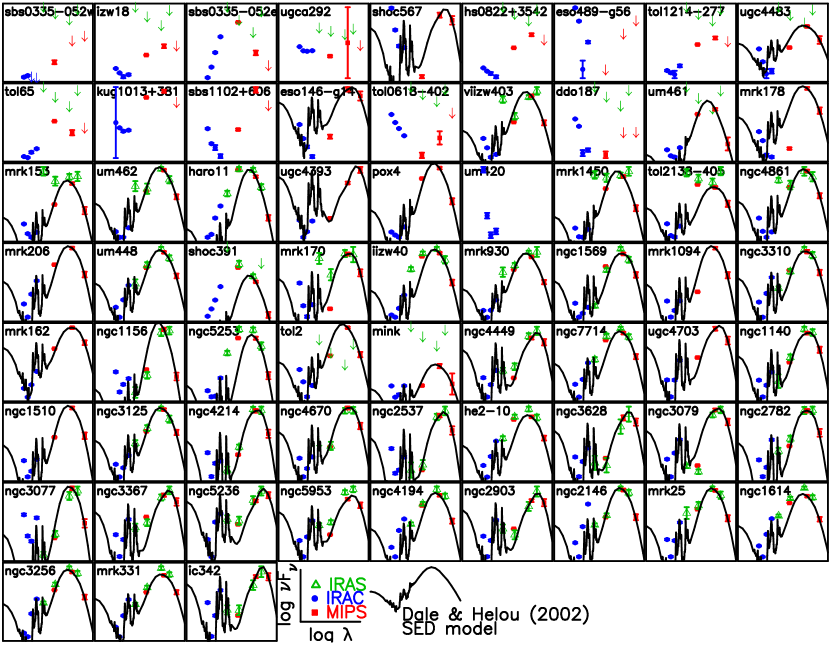
We have plotted the infrared SED of each galaxy in Figure 1. Where both 70 µm and 160 µm measurements are available, we have fit a SED model from Dale & Helou (2002) to the data. The models generally fit the high-metallicity galaxies well, but provide a less good fit at low metallicities. The fitting also shows that the suite of aromatic emission features in the MIR becomes weaker at low metallicity, relative to the FIR emission. This behavior is the primary cause of the reduction in fit quality at low metallicity.
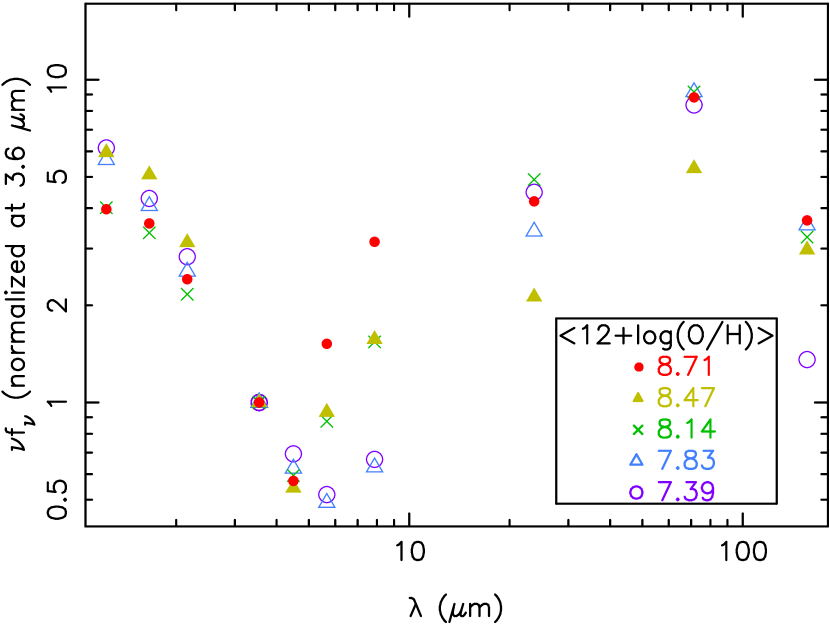
In fact, except in the mid-IR, the SEDs of energetically star-forming galaxies do not vary much between 1 µm and 180 µm. This result is illustrated in another way in Figure 2, where we have plotted galaxy SEDs averaged in bins of similar metallicities and normalized at 3.6 µm, which traces predominantly the stellar population. There is little scatter between 1 µm and 5 µm (e.g., the K-band fluxes vary by 15%), where the SEDs are dominated by starlight. This wavelength range traces the Rayleigh-Jeans tail of most stellar SEDs and is only lightly affected by extinction, and thus the shape of this part of the spectrum is insensitive to the details of the stellar population. In the FIR, the SED shapes are also very similar, indicating the dust must be at a similar temperature distribution. The small scatter also indicates that the ratio of stellar to dust luminosity does not vary substantially. The scatter goes up dramatically in the MIR, particularly the 5.8 µm and 8.0 µm bands, which contain strong contributions from the aromatic emission features. In this wavelength regime, the aromatic features are systematically weak in low-metallicity galaxies (Engelbracht et al., 2005), which is also reflected in the photometry shown here.
3.2. Infrared Luminosity
The similarity of the SEDs allows accurate determination of the total infrared luminosities, even with sparsely sampled SEDs. We compare two ways to compute infrared luminosities. One approach is to compute the “total infrared” (TIR) luminosity, using MIPS measurements and the formula given by Dale & Helou (2002). This approach provides µm dust luminosities based on a set of SED templates. We compare the results using the formula to those obtained by integrating the SEDs directly. For each galaxy, we numerically integrate the dust emission from µm as follows: We interpolate linearly the stellar-subtracted measurements (from Table 6) between 4.5 µm and 160 µm. The dust luminosity in the shortest-wavelength IRAC band (3.6 µm) is both small and poorly determined (see § 4.2), so we simply assume the emission goes linearly to 0 from 4.5 µm to 3 µm. At long wavelengths, we assume the emission goes as a blackbody (modified by a emissivity) between 160 µm and 1100 µm. The results are given in Table 8, where we can see the two approaches give very similar results.
4. Trends with Metallicity
4.1. Behavior with L(H)/L(TIR)
L(H) and L(TIR) are two star formation indicators; L(H) can be taken as a measure of the relatively unobscured star formation, while L(TIR) is a reflection of the obscured portion (e.g., Pérez-González et al. (2006)). The overall similarity of the SEDs in the NIR/MIR region independent of the relative amounts of obscured and unobscured star formation is illustrated in Figure 3. We plot the wavelength at which the dust emission begins to dominate over the stellar emission, which we refer to as the “transition” wavelength, against the ratio of H to infrared luminosity. We compute the transition wavelength from the SED by fitting a parabola to the photometric data around the local minimum in the MIR where the Rayleigh-Jeans tail of the stellar population is dropping and the dust emission starts to climb. Below an H to TIR ratio of 1%, most of the galaxies have a transition wavelength within 10% of 4.5 µm. The scatter goes up modestly at higher ratios, with a transition near 6 µm for many cases. We show below that galaxies with high ratios also have low metallicity.
Figure 3 also shows the behavior of L(H)/L(TIR) with metallicity. There is a strong trend of decreasing obscuration with decreasing metallicity. Star formation rates are often calculated using a relation between L(TIR) and L(H) due to Kennicutt (1998), with the tie to the star formation rate through H. We show this relation as a dashed line in the figure. The assumed relation appears to be a reasonable average. Where L(TIR) is dominant (toward high metallicity), it can be a valid star formation indicator despite the relation in the figure, since the unobscured star formation is a small fraction of the total. However, as the metallicity decreases, the relation between star formation and L(TIR) will depart from the Kennicutt relation and L(TIR) will eventually cease to be useful by itself to determine star formation rates (see, e.g., Pérez-González et al. (2006); Calzetti et al. (2007); Kennicutt et al. (2007)).
4.2. Stellar Photosphere Contribution to the MIR Bands
Global measurements of galaxies in the Spitzer bands all contain some contribution from stellar photospheres, a contribution which must be taken into account when measuring emission by dust. This contribution decreases with wavelength, both absolutely as stars are fainter and proportionally as emission by the dust becomes brighter. As we shall show, this contribution varies widely from galaxy to galaxy and can be significant, especially in the IRAC bands where it can be tens of percent.
We have measured the stellar contribution to our photometric measurements by characterizing the stellar component in the NIR, specifically the 2 to 4 µm range. This wavelength regime strikes a balance between short wavelengths, which can be heavily affected by extinction and details of the star formation history and long wavelengths, which can contain significant contributions from the dust component we are trying to measure.
We use population synthesis models to scale to longer wavelengths the stellar emission measured at shorter wavelengths. We have confirmed that the shapes of the SEDs predicted by two commonly-used population synthesis models, Starburst99 (Leitherer et al., 1999) and PEGASE (Fioc & Rocca-Volmerange, 1997) are very similar beyond 2 µm and hardly vary with age after 5 to 15 Myr, depending on metallicity. Thus, our results are not sensitive to choice of age or model within this parameter range and so we simply adopt 100 Myr Starburst99 models as our fiducial stellar SEDs.
The wavebands available to us in the µm range are Ks and IRAC band 1 at 3.6 µm. The stellar fraction computed from either of these bands is subject to different systematic uncertainties. IRAC band 1 will possibly be affected by emission in the 3.3µm feature, plus it is more likely to be affected by very hot dust than the Ks band. However, the Ks band is more affected by extinction and sensitivity issues in the available observations - it is more difficult to recover flux from faint extended sources. We estimate the systematic error on our scaling by predicted stellar fluxes from both. The stellar fluxes scaled from IRAC band 1 tend to be higher than from the K band, by an average of 45% in our sample. We find that we can improve the agreement by correcting for extinction, which we measure using the extinction law of Rieke & Lebofsky (1985) (assuming a simple foreground screen) and the difference between the modeled and observed JKs color. This correction improves the agreement between the predicted stellar fluxes, to 30% on average. In the absence of a clear reason to prefer predictions from one band over the other, we adopt the average of the 3.6 µm and extinction-corrected Ks predictions as the stellar fraction and use the difference between the predicted values as an indication of the systematic uncertainty. The scale factors we used are presented in Table 5, while the stellar-subtracted fluxes are presented in Table 6.
In Figure 4, we plot the average stellar fraction in the 3 longest IRAC bands (4.5 µm, 5.8 µm, and 8.0 µm) in bins of increasing metallicity. The upper bin edges are 7.6, 8.1, 8.3, 8.6, and 9.0, and were chosen to sample interesting physical regimes and to maintain a statistically useful () number of galaxies in each bin. The bin center is taken to be the average metallicity of the galaxies in the bin, and the value and uncertainty of each bin are the mean and root-mean-square, respectively, of the stellar fractions of the galaxies in that bin. Two trends are most evident: the stellar fraction decreases with wavelength (as expected) and, at the longer wavelengths, with metallicity. Except for a dip around a metallicity of 8, due to most of the galaxies with unusual SEDs (see § 5) landing in this bin, the stellar fraction at 4.5 µm is independent of Z, at a value of %, but at 8.0 µm, a strong trend is observed as the fraction decreases from 30% at the lowest metallicity to 4% around solar metallicity.
4.3. Dust Temperatures
We compute color temperatures for various infrared bands assuming the emission follows a blackbody curve with an emissivity proportional to . Separate temperatures were determined for flux ratios at µm, µm, and µm by computing the temperature of the modified blackbody curve that fit the ratio. Uncertainties on the temperatures reflecting the photometric uncertainties were computed via a Monte Carlo approach. The results are tabulated in Table 10.
The color temperature of the two longest bands (at 100 µm and 160 µm) should be most similar to the equilibrium temperature of the dominant dust component, as those bands are expected to have little contribution from stochastic heating (cf. Popescu et al., 2000; Galliano et al., 2005). We find that the color temperature that includes 70 µm data is generally the same within the uncertainties, indicating that, for these galaxies, the 70 µm band is also dominated by emission from dust in thermal equilibrium. We can therefore use the 70/160 µm ratio to compute dust temperatures with some physical significance. Finally, as expected, the 24/70 µm temperature is very much higher, due to the contributions at 24 µm from transiently-heated grains and equilibrium emission from small regions with very warm dust (e.g., Draine et al., 2007).
We plot the 70/160 µm color temperature as a function of metallicity in Figure 5. We find that, above a metallicity of , dust temperature is inversely correlated with metallicity, rising from 22 K near solar metallicity to 35 K near a metallicity of 8. Below that metallicity, the curve turns over, as the dust becomes cooler again.
4.4. Dust Masses
We compute dust masses using the standard formula and the absorption coefficients from Li & Draine (2001). We use the 70/160 µm color temperature from Table 10. The results are presented in Table 11.
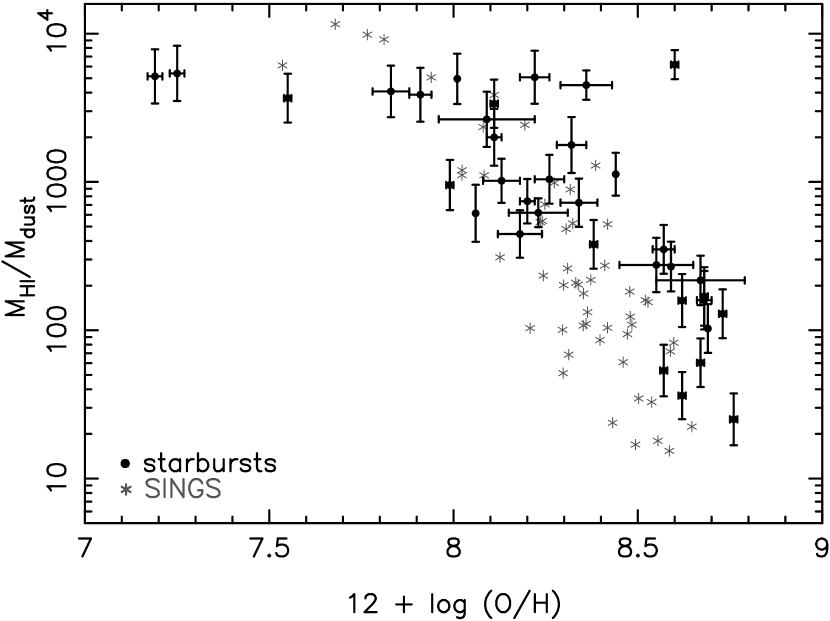
We compare the dust masses to HI masses compiled from the literature. The HI masses and references are summarized in Table Metallicity Effects on Dust Properties in Starbursting Galaxies. The ratio of “HI gas” (hereafter, “gas”) to dust mass as a function of metallicity is plotted in Figure 6. Between solar metallicity to a metallicity of 8, there is a steep rise, roughly as Z-2.5, in the ratio, or equivalently a steep decline in the dust mass. At lower metallicity, the gas/dust ratio flattens out.
In the same plot, we also show measurements of SINGS galaxies from Draine et al. (2007), where we have adopted their atomic gas masses333Note that we have ignored the molecular component of the gas for this calculation, the fraction of which is generally above average (e.g., Sauty et al., 2003) for the SINGS galaxies; enough to push the total gas to dust ratio over 100. but, to ensure we are comparing similar quantities, have recomputed the dust masses using the prescription above. Recomputing the dust masses makes little difference in this plot, as our dust masses are within a factor of 2 lower, on average, than those computed by Draine et al. (2007). At moderate (Z ) metallicity and below, we find similar gas/dust ratios for the galaxies discussed in this paper as for SINGS. Above that metallicity, the SINGS galaxies are offset below and/or to the left of the starburst galaxies in this plot. This is largely due to a difference in gas composition between the two samples, since the gas in the SINGS galaxies has a higher molecular fraction than the starbursts. The addition of the molecular gas to the gas mass will tend to move the SINGS galaxies closer to the starbursts in this plot.
4.5. Aromatic Features
Because many low metallicity galaxies are at or below the limit for high quality IRS spectra, in Engelbracht et al. (2005) we introduced a photometric approach to determining aromatic feature strength. Here, we update that approach and test it against the larger sample of spectra now available. We compute a photometric equivalent of the 7.7 µm aromatic complex (referred to hereafter as the 8 µm band) using a logarithmic interpolation of the stellar-subtracted 4.5 µm and 24 µm bands to estimate the 8 µm continuum, and the 8.0 µm band to trace the feature. The equation is:
where is the bandwidth of IRAC band 4, Hz, is the speed of light, and is 7.87 µm.
We compare the photometric measurement to the one derived directly from the spectra (ignoring equivalent widths below 1 µm as unreliable) and plot the results in Figure 7. We see that there is a correlation between the photometric and spectroscopic measurements, confirming the conclusion in Engelbracht et al. (2005) for a reduction in the relative aromatic strength with reduced metallicity, particularly below a metallicity of 8.
Another way to prove the behavior of the aromatic features is to average spectra to achieve higher signal to noise. We have binned the spectra in metallicity and plotted the average spectra in Figure 8. The continuum slopes do not depend strongly on metallicity, but the emission features do. In particular, the aromatic features steadily weaken with decreasing metallicity. However, within the signal to noise of the averaged spectra, there is no substantial change in the relative aromatic feature strengths - all of the transitions appear to weaken together. Also, the ionization levels increase, most obviously traced by the [S IV][S III], [Ne III][Ne II], and [Ar III][Ar II] ratios.
To explore what parameter affects the strength of the aromatic features, we plot the equivalent widths (EWs) vs radiation field hardness and metallicity (for galaxies with spectra only) in Figure 9. We characterize the radiation field with a radiation hardness index, RHI, which is a combination of the [Ne III][Ne II] and [S IV][S III] ratios and provides a more sensitive indicator of the hardness of the radiation field than either ratio alone. Because the radiation hardness is judged from the IRS spectra, the measurements refer to similar regions in the galaxies (with, for example, only weak dependence on extinction). There are global trends in both plots that indicate a dependence of aromatic feature strength on both parameters. There is nonetheless substantial scatter (of an order of magnitude) in feature EW for a given radiation field. At the same time, there is substantial scatter (of an order of magnitude also) in the feature EW between metallicities of 7.9 and 8.4. The large level of scatter suggests that neither parameter alone controls the feature strength. This issue will be discussed further by Gordon et al. (2008, in preparation).
4.6. Behavior of L(8 µm)/L(TIR)
Spitzer measurements of infrared excesses in high-redshift galaxies are often reported for only the 24 µm band, because of its small beam (and hence low level of confusion noise) and high sensitivity. Between , the aromatic features in the 8 µm region lie in the MIPS 24 µm band and enhance the detection of star forming galaxies. However, over this redshift range the star formation rates are then based on deriving L(TIR) from L(8 µm), so any systematic change in the relationship in these quantities from templates based on local galaxies will have implications for the calibration of the 24 µm data in terms of star formation. Rigby et al. (2007, in prep.) summarize indications for a systematic shift in L(8 µm)/L(TIR) for ULIRGs at z 2, away from values typical of local ULIRGs and toward the values typical of lower-luminosity local galaxies. They suggest this change may be due to lower metallicity in the high-z ULIRGs, which implies a substantial reduction in the amount of dust (see above) and hence a reduction in the optical depth of the star forming regions.
This suggestion can be tested with the current sample. Figure 10 shows the ratio L(8 µm) / L(TIR) as a function of metallicity. This ratio increases slightly from solar to solar metallicity and then falls toward lower metallicity, with increasing scatter. It appears that the metallicities of luminous galaxies are reduced by a factor of 1.5 - 2 relative to local analogs (Liang et al., 2004; Mouhcine et al., 2006; Rupke et al., 2007). Therefore, the behavior in Figure 10 is qualitatively consistent with the reported change at z 2. Making a more quantitative comparison is not feasible because: 1.) the metallicity measurements at high redshift are subject to substantial errors; and 2.) our sample includes few galaxies with the large optical depths typical of local ULIRGs.
5. Mid-Infrared Peaked SEDs
A major finding of this study is that the great majority of infrared-active star-forming galaxies of widely different characteristics (morphology, metallicity, etc.) have very similar behavior in the near, mid, and far infrared, with the exception of the strength of their aromatic features. The aromatic feature behavior also follows a trend controlled by the hardness of the radiation field and probably also influenced by the metallicity (beyond the effect of metallicity on the radiation field). In all these cases, the bulk of the total infrared luminosity (L(TIR)) is emitted in the far infrared, and the near infrared samples emission from a luminous population of cool, evolved stars.
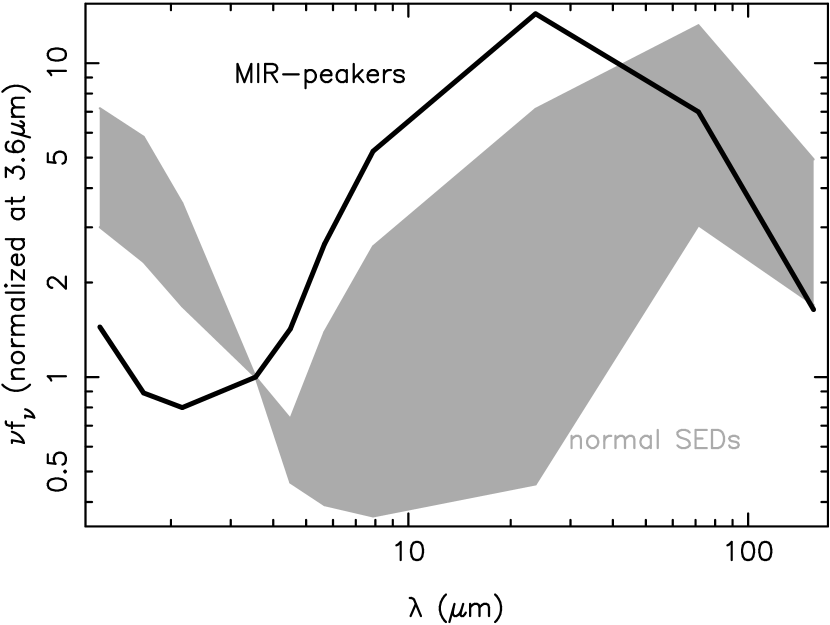
Three galaxies (SBS 0335-052E, Haro 11, and SHOC 391) depart markedly from these trends, with 24 µm flux densities within a factor of two of those at 70 µm and very weak output in the near infrared. The latter two show the anomalous mid-to-far infrared behavior also in the IRAS data (e.g., Shupe et al., 1998; Schmitt et al., 2006), but it is confirmed here. The Spitzer data make the important addition of using a sufficiently small beam at 24 µm to associate the strong flux at that wavelength positively with the galaxies. We refer to these galaxies as Mid-IR Peakers (MIRPs), for which L(TIR) is dominated by the mid infrared. Figure 11 compares the average behavior of these galaxies with the range of SEDs of the other galaxies in this sample, to emphasize the dramatic difference. The behavior of MIRPs falls outside the parameter range usually explored in constructing infrared SED templates. Their aromatic feature equivalent widths are small, but within the trends for galaxies of similar metallicity. Similarly, their fine structure line ratios imply relatively hot radiation fields but are not very different from other galaxies of similar metallicity. Neither are their optical emission line characteristics particularly distinctive (e.g., Guseva et al. 2006 and references therein). These galaxies also have relatively weak outputs in the near infrared. The star/dust transition wavelengths in them are near 2 µm (see Figure 3). Thus, we have determined the stellar fraction in the J and H bands rather than K and 3.6 µm since from the SED shape these former bands are expected to be dominated by star light while still being relatively insensitive to extinction. Any additional uncertainties incurred by this procedure have a negligible effect on the dust properties, since the stellar fractions in the longer wavelength infrared bands are only a few percent at most.
Another well-studied galaxy with some similarities is II Zw 40, with a relatively strong 24 µm output and a weak near infrared one. This galaxy also shows little CO first overtone absorption at 2.3 µm, indicating minimal contribution to its weak near infrared output from evolved stars (Vanzi et al., 1996). Starburst modeling shows that the characteristics of II Zw 40 can be explained only if it is the site of a very recent starburst, with age 4 Myr. There is a very rapid growth of NIR stellar luminosity beyond this age that quickly contradicts the observational constraints (Vanzi et al., 1996) Since the ratio of near infrared stellar luminosity to L(TIR) is similar for the MIRPs as that in II Zw 40, a similar situation must prevail for them. This sort of situation has been found previously for other low-luminosity, low-metallicity galaxies (e.g., Thompson et al., 2006). However, it is interesting that the MIRPs have luminosity up into the LIRG range (1.4 1011 L⊙ for Haro 11).
However, the youth of the starbursts in these galaxies does not necessarily explain their unique infrared SEDs. Indeed, there are a few other examples with similarly extreme IR SEDs, but not the extreme low-luminosities in the near infrared (Tol 65). The warm SEDs might be explained by the presence of AGN, but there is as yet no other evidence in favor of this hypothesis. It is difficult to take a standard model of the ISM and change the properties of the star-forming regions in a galaxy in a way that produces such extreme SEDs (see Dale & Helou 2002, Fig. 3 and accompanying discussion). It seems likely instead that the component of the ISM responsible for the very far infrared/submm output is either largely missing, or that for some reason it is not efficiently heated.
6. Summary and Conclusions
We present new infrared images and spectra, both from the Spitzer Space Telescope and from the ground, for a sample of 66 star-forming galaxies. The sample spans a wide range of metallicities, from the lowest known in a star-forming galaxy to near solar. The imaging covers the range from 1 µm to 180 µm, while the spectra cover 5 µm to 40 µm. These observations represent the first detections of dust emission from some of the lowest metallicity star-forming galaxies known, including the current record holder SBS 0335-052W.
We perform photometry on the images to compute spectral energy distributions (SEDs). We demonstrate that, with a few exceptions, the SEDs of the galaxies are very similar in the near infrared, where they are dominated by stellar emission, and the far infrared, where they are dominated by emission from dust in thermal equilibrium. The transition from stellar to dust emission occurs around 4.5 µm, with little scatter for galaxies with a metallicity [] above 8. The scatter in this transition wavelength increases considerably at low metallicities. The SEDs exhibit a strong metallicity dependence in the mid infrared, largely due to changes in the strength of the aromatic features.
We use a variety of simple models to derive the fraction of emission due to stars in the mid infrared, particularly in the IRAC bands at 4.5 µm, 5.8 µm, and 8.0 µm. While this fraction is a relatively constant 70% at 4.5 µm, it has a strong dependence on metallicity at 8.0 µm, where it ranges from 4% in metal-rich galaxies to 30% in the lowest-metallicity galaxies, reflecting the lower dust content and weak aromatics in these galaxies.
We confirm previous evidence for a substantial reduction in aromatic feature strengths below , and also with increased radiation hardness. The scatter in the aromatic EWs against both metallicity and radiation hardness implies that this reduction is not controlled by a single parameter, but probably by some combination of effects.
We compute dust properties (temperature and mass) for each galaxy. We find an anticorrelation between dust temperature and metallicity, with equilibrium dust temperatures of K near solar metallicity up to 40 K at low metallicity 8, and then falling temperatures with further reductions in metallicity. The derived dust masses span over 8 orders of magnitude, from one-tenth of a solar mass to over 50 million solar masses. They exhibit a very steep dependence on metallicity, as Z-2.5 down to Z 8 but have a much weaker dependence for Z 8. The change in dust behavior in terms of aromatics, far infrared color temperature, and dust/gas mass ratio all near Z = 8 indicates that there near this metallicity there is a general modification of all components of the interstellar dust that dominate the infrared emission.
We show that the ratio L(8 µm)/L(TIR) increases with decreasing metallicity from solar to about 50% solar and then decreases with further reductions in Z. This behavior is important for interpretation of 24 µm measurements of star forming galaxies at redshifts z 2, since the signals for them are dominated by aromatic emission and it is likely that they have lower metallicity than is typical of local template galaxies.
We find 3 galaxies, SBS 0335-052E, Haro 11, and SHOC 391, that have anomalous far infrared spectral energy distributions, with weak emission near 70 µm and an SED that is dominated energetically by the mid-IR near 24 µm. In addition, they have weak stellar outputs in the near infrared and are dominated by dust emission down to wavelengths as short as 2 µm. This latter behavior indicates that they are the sites of very young dominant star forming episodes. Their metallicities tend to be low, but not different from other galaxies with behavior much more similar to the majority of infrared-active galaxies. It appears that the dust responsible for the far infrared emission in most galaxies is either absent, or not efficiently heated in these three objects. They are interesting targets for further study since they represent an extreme state of the ISM.
References
- Allende Prieto et al. (2001) Allende Prieto, C., Lambert, D. L., & Asplund, M. 2001, ApJ, 556, L63
- Bergvall & Östlin (2002) Bergvall, N., & Östlin, G. 2002, A&A, 390, 891
- Cairós et al. (2003) Cairós, L. M., Caon, N., Papaderos, P., Noeske, K., Vílchez, J. M., Lorenzo, B. G., & Muñoz-Tuñón, C. 2003, ApJ, 593, 312
- Calzetti et al. (2007) Calzetti, D., et al. 2007, ApJ, 666, 870
- Casasola et al. (2004) Casasola, V., Bettoni, D., & Gelletta, G., 2004, A&A, 422, 941
- Chary & Elbaz (2001) Chary, R., & Elbaz, D. 2001, ApJ, 556, 562
- Cohen et al. (2003) Cohen, M., Wheaton, W. A., & Megeath, S. T. 2003, AJ, 126, 1090
- Croft et al. (2006) Croft, S., et al. 2006, ApJ, 647, 1040
- Dale & Helou (2002) Dale, D. A., & Helou, G. 2002, ApJ, 576, 159
- Dale et al. (2007) Dale, D. A., et al., accepted to ApJ
- Devriendt et al. (1999) Devriendt, J. E. G., Guiderdoni, B., & Sadat, R. 1999, å, 350, 381
- Dole et al. (2004) Dole, H., et al. 2004, ApJS, 154, 93
- Draine et al. (2007) Draine, B. T., et al. 2007, ApJ, 663, 866
- Ekholm et al. (2000) Ekholm, T., Lanoix, P., Teerikorpi, P., Fouqué, P., & Paturel, G. 2000, A&A, 355, 835
- Engelbracht et al. (1998) Engelbracht, C. W., Rieke, M. J., Rieke, G. H., Kelly, D. M., & Achtermann, J. M. 1998, ApJ, 505, 639
- Engelbracht et al. (2005) Engelbracht, C. W., Gordon, K. D., Rieke, G. H., Werner, M. W., Dale, D. A., & Latter, W. B. 2005, ApJ, 628, L29
- Engelbracht et al. (2007) Engelbracht, C. W., et al. 2007, PASP, 119, 994
- Fabbiano et al. (1990) Fabbiano, G., Heckman, T., & Keel, W. C. 1990, ApJ, 355, 442
- Fazio et al. (2004) Fazio, G. G., et al. 2004, ApJS, 154, 10
- Fioc & Rocca-Volmerange (1997) Fioc, M., & Rocca-Volmerange, B. 1997, A&A, 326, 950
- Fricke et al. (2001) Fricke, K. J., Izotov, Y. I., Papaderos, P., Guseva, N. G., & Thuan, T. X. 2001, AJ, 121, 169
- Galliano et al. (2003) Galliano, F., Madden, S. C., Jones, A. P., Wilson, C. D., Bernard, J.-P., & Le Peintre, F. 2003, å, 407, 159
- Galliano et al. (2005) Galliano, F., Madden, S. C., Jones, A. P., Wilson, C. D., & Bernard, J.-P. 2005, A&A, 434, 867
- Garnett (1992) Garnett, D. R. 1992, AJ, 103, 1330
- Genzel & Cesarsky (2000) Genzel, R., & Cesarsky, C. J. 2000, ARA&A, 38, 761
- Gil de Paz et al. (2003) Gil de Paz, A., Madore, B. F., & Pevunova, O. 2003, ApJS, 147, 29
- Gonzalez-Delgado et al. (1995) Gonzalez-Delgado, R. M., Perez, E., Diaz, A. I., Garcia-Vargas, M. L., Terlevich, E., & Vilchez, J. M. 1995, ApJ, 439, 604
- Gordon et al. (2005) Gordon, K. D., et al. 2005, PASP, 117, 503
- Gordon et al. (2007) Gordon, K. D., et al. 2007, PASP, 119, 1019
- Guseva et al. (2000) Guseva, N. G., Izotov, Y. I., & Thuan, T. X. 2000, ApJ, 531, 776
- Guseva et al. (2007) Guseva, N. G., Izotov, Y. I., Papaderos, P., & Fricke, K. J. 2007, A&A, 464, 885
- Hadfield & Crowther (2006) Hadfield, L. J., & Crowther, P. A. 2006, MNRAS, 368, 1822
- Hattori et al. (2004) Hattori, T., et al. 2004, AJ, 127, 736
- Hoopes et al. (2001) Hoopes, C. G., Walterbos, R. A. M., & Bothun, G. D. 2001, ApJ, 559, 878
- Houck et al. (2004) Houck, J. R., et al. 2004a, ApJS, 154, 18
- Huchtmeier et al. (2005) Huchtmeier, W. K., Krishna, G., & Petrosian, A. 2005, A&A, 434, 887
- Hunt et al. (2003) Hunt, L. K., Thuan, T. X., & Izotov, Y. I. 2003, ApJ, 588, 281
- Izotov et al. (1994) Izotov, Y. I., Thuan, T. X., & Lipovetsky, V. A. 1994, ApJ, 435, 647
- Izotov et al. (1997) Izotov, Y. I., Foltz, C. B., Green, R. F., Guseva, N. G., & Thuan, T. X. 1997, ApJ, 487, L37
- Izotov & Thuan (1998) Izotov, Y. I., & Thuan, T. X. 1998, ApJ, 500, 188
- Izotov & Thuan (1999) Izotov, Y. I., & Thuan, T. X. 1999, ApJ, 511, 639
- Izotov et al. (1999b) Izotov, Y. I., Chaffee, F. H., Foltz, C. B., Green, R. F., Guseva, N. G., & Thuan, T. X. 1999, ApJ, 527, 757
- Izotov et al. (2001) Izotov, Y. I., Chaffee, F. H., & Green, R. F. 2001, ApJ, 562, 727
- Izotov & Thuan (2004) Izotov, Y. I., & Thuan, T. X. 2004, ApJ, 602, 200
- Izotov et al. (2004) Izotov, Y. I., Papaderos, P., Guseva, N. G., Fricke, K. J., & Thuan, T. X. 2004, A&A, 421, 539
- Izotov et al. (2005) Izotov, Y. I., Thuan, T. X., & Guseva, N. G. 2005, ApJ, 632, 210
- Izotov et al. (2006) Izotov, Y. I., Stasińska, G., Meynet, G., Guseva, N. G., & Thuan, T. X. 2006, A&A, 448, 955
- Izotov & Thuan (2007) Izotov, Y. I., & Thuan, T. X. 2007, ApJ, 665, 1115
- James et al. (2004) James, P. A., et al. 2004, A&A, 414, 23
- Jarrett et al. (2003) Jarrett, T. H., Chester, T., Cutri, R., Schneider, S. E., & Huchra, J. P. 2003, AJ, 125, 525
- Karachentsev et al. (2004) Karachentsev, I. D., Karachentseva, V. E., Huchtmeier, W. K., & Makarov, D. I. 2004, AJ, 127, 2031
- Karachentsev (2005) Karachentsev, I. D. 2005, AJ, 129, 178
- Kennicutt et al. (1987) Kennicutt, R. C., Jr., Roettiger, K. A., Keel, W. C., van der Hulst, J. M., & Hummel, E. 1987, AJ, 93, 1011
- Kennicutt (1998) Kennicutt, R. C., Jr. 1998, ARA&A, 36, 189
- Kennicutt et al. (2007) Kennicutt, R. C., Jr., et al. 2007, ArXiv e-prints, 708, arXiv:0708.0922
- Kleinmann & Low (1970) Kleinmann, D. E., & Low, F. J. 1970, ApJ, 159, L165
- Kniazev & Pustil’Nik (1998) Kniazev, A. Y., & Pustil’Nik, S. A. 1998, Bull. Special Astrophys. Obs., 46, 23
- Kniazev et al. (2000) Kniazev, A. Y., et al. 2000, A&A, 357, 101
- Kniazev et al. (2003) Kniazev, A. Y., Grebel, E. K., Hao, L., Strauss, M. A., Brinkmann, J., & Fukugita, M. 2003, ApJ, 593, L73
- Kniazev et al. (2004) Kniazev, A. Y., Pustilnik, S. A., Grebel, E. K., Lee, H., & Pramskij, A. G. 2004, ApJS, 153, 429
- Kobulnicky & Skillman (1996) Kobulnicky, H. A., & Skillman, E. D. 1996, ApJ, 471, 211
- Kobulnicky et al. (1997a) Kobulnicky, H. A., Skillman, E. D., Roy, J.-R., Walsh, J. R., & Rosa, M. R. 1997, ApJ, 477, 679
- Kobulnicky & Skillman (1997b) Kobulnicky, H. A., & Skillman, E. D. 1997, ApJ, 489, 636
- Kobulnicky et al. (1999) Kobulnicky, H. A., Kennicutt, R. C., Jr., & Pizagno, J. L. 1999, ApJ, 514, 544
- Kong & Cheng (1999) Kong, X., & Cheng, F. Z. 1999, A&A, 351, 477
- Kong & Cheng (2002) Kong, X., & Cheng, F. Z. 2002, A&A, 389, 845
- Kunth & Östlin (2000) Kunth, D., & Östlin, G. 2000, A&A Rev., 10, 1
- Lagache et al. (2005) Lagache, G., Puget, J.-L., & Dole, H. 2005, ARA&A, 43, 727
- Lee et al. (2003) Lee, H., McCall, M. L., Kingsburgh, R. L., Ross, R., & Stevenson, C. C. 2003, AJ, 125, 146
- Lehnert & Heckman (1995) Lehnert, M. D., & Heckman, T. M. 1995, ApJS, 97, 89
- Leitherer & Heckman (1995) Leitherer, C. & Heckman, T. M. 1995, ApJS, 96, 9
- Leitherer et al. (1999) Leitherer, C., et al. 1999, ApJS, 123, 3
- Liang et al. (2004) Liang, Y. C., Hammer, F., Flores, H., Elbaz, D., Marcillac, D., & Cesarsky, C. J. 2004, å, 423, 867
- Li & Draine (2001) Li, A., & Draine, B. T. 2001, ApJ, 554, 778
- Lípari et al. (2000) Lípari, S., Díaz, R., Taniguchi, Y., Terlevich, R., Dottori, H., & Carranza, G. 2000, AJ, 120, 645
- Lisenfeld & Ferrara (1998) Lisenfeld, U., & Ferrara, A. 1998, ApJ, 496, 145
- Madden (2000) Madden, S. C. 2000, New Astronomy Review, 44, 249
- Madden et al. (2006) Madden, S. C., Galliano, F., Jones, A. P., & Sauvage, M. 2006, A&A, 446, 877
- Masegosa et al. (1994) Masegosa, J., Moles, M., & Campos-Aguilar, A. 1994, ApJ, 420, 576
- McCall et al. (1985) McCall, M. L., Rybski, P. M., & Shields, G. A. 1985, ApJS, 57, 1
- Méndez et al. (1999) Méndez, D. I., Cairós, L. M., Esteban, C., & Vílchez, J. M. 1999, AJ, 117, 1688
- Meurer et al. (2006) Meurer, G. R., et al. 2006, ApJS, 165, 307
- Moorwood (1996) Moorwood, A. F. M. 1996, Sp. Sci. Rev., 77, 303
- Mouhcine et al. (2006) Mouhcine, M., Bamford, S. P., Aragón-Salamanca, A., Nakamura, O., & Milvang-Jensen, B. 2006, MNRAS, 369, 891
- Mould et al. (2000) Mould, J. R., et al. 2000, ApJ, 545, 547
- Moustakas & Kennicutt (2006) Moustakas, J., & Kennicutt, R. C., Jr. 2006, ApJ, 651, 155
- Noeske et al. (2003) Noeske, K. G., Papaderos, P., Cairós, L. M., & Fricke, K. J. 2003, A&A, 410, 481
- Nagao et al. (2006) Nagao, T., Maiolino, R., & Marconi, A. 2006, A&A, 459, 85
- Östlin (2000) Östlin, G. 2000, ApJ, 535, L99
- Ott et al. (2005) Ott, J., Walter, F., & Brinks, E. 2005, MNRAS, 358, 1453
- Papaderos et al. (2006) Papaderos, P., Izotov, Y. I., Guseva, N. G., Thuan, T. X., & Fricke, K. J. 2006, A&A, 454, 119
- Pastoriza et al. (1993) Pastoriza, M. G., Dottori, H. A., Terlevich, E., Terlevich, R., & Diaz, A. I. 1993, MNRAS, 260, 177
- Paturel et al. (2003) Paturel, G., Theureau, G., Bottinelli, L., Gougenheim, L., Courdreau-Durand, N., Hallet, N., & Petit, C. 2003, A&A, 412, 57
- Pérez-González et al. (2006) Pérez-González, P. et al. 2006, ApJ, 648, 987
- Pettini & Pagel (2004) Pettini, M., & Pagel, B. E. J. 2004, MNRAS, 348, L59
- Pilyugin et al. (2004) Pilyugin, L. S., Vílchez, J. M., & Contini, T. 2004, A&A, 425, 849
- Pilyugin & Thuan (2005) Pilyugin, L. S., & Thuan, T. X. 2005, ApJ, 631, 231
- Pilyugin et al. (2006) Pilyugin, L. S., Thuan, T. X., & Vílchez, J. M. 2006, MNRAS, 367, 1139
- Popescu et al. (2000) Popescu, C. C., Misiriotis, A., Kylafis, N. D., Tuffs, R. J., & Fischera, J. 2000, A&A, 362, 138
- Pustilnik et al. (2003) Pustilnik, S. A., Kniazev, A. Y., Pramskij, A. G., Ugryumov, A. V., & Masegosa, J. 2003, A&A, 409, 917
- Pustilnik et al. (2004) Pustilnik, S. A., Pramskij, A. G., & Kniazev, A. Y. 2004, A&A, 425, 51
- Pustilnik & Martin (2007) Pustilnik, S. A., & Martin, J.-M. 2007, A&A, 464, 859
- Raimann et al. (2000) Raimann, D., Storchi-Bergmann, T., Bica, E., Melnick, J., & Schmitt, H. 2000, MNRAS, 316, 559
- Reach et al. (2005) Reach, W. T., et al. 2005, PASP, 117, 978
- Rieke & Low (1972) Rieke, G. H., & Low, F. J. 1972, ApJ, 176, L95
- Rieke & Lebofsky (1979) Rieke, G. H., & Lebofsky, M. J. 1979, ARA&A, 17, 477
- Rieke & Lebofsky (1985) Rieke, G. H., & Lebofsky, M. J. 1985, ApJ, 288, 618
- Rieke et al. (1993) Rieke, G. H., Loken, K., Rieke, M. J., & Tamblyn, P. 1993, ApJ, 412, 99
- Rieke et al. (2004) Rieke, G. H., et al. 2004, ApJS, 154, 25
- Roche et al. (1991) Roche, P. F., Aitken, D. K., Smith, C. H., & Ward, M. J. 1991, MNRAS, 248, 606
- Roennback & Bergvall (1995) Roennback, J., & Bergvall, N. 1995, A&A, 302, 353
- Rupke et al. (2007) Rupke, D. S. N., Veilleux, S., & Baker, A. J. 2007, astro-ph/0708.1766
- Sanders & Mirabel (1996) Sanders, D. B., & Mirabel, I. F. 1996, ARA&A, 34, 749
- Sauty et al. (2003) Sauty, S., et al. 2003, A&A, 411, 381
- Sauvage et al. (2005) Sauvage, M., Tuffs, R. J., & Popescu, C. C. 2005, Space Science Reviews, 119, 313
- Schmitt et al. (2006) Schmitt, H. R., Calzetti, D., Armus, L., Giavalisco, M., Heckman, T. M., Kennicutt, R. C., Jr., Leitherer, C., & Meurer, G. R. 2006, ApJS, 164, 52
- Searle & Sargent (1972) Searle, L., & Sargent, W. L. W. 1972, ApJ, 173, 25
- Shaw & Dufour (1995) Shaw, R. A., & Dufour, R. J. 1995, PASP, 107, 896
- Shi et al. (2005) Shi, F., Kong, X., Li, C., & Cheng, F. Z. 2005, A&A, 437, 849
- Shupe et al. (1998) Shupe, D. L., Fang, F., Hacking, P. B., & Huchra, J. P. 1998, ApJ, 501, 597
- Skillman et al. (1994) Skillman, E. D., Televich, R. J., Kennicutt, R. C., Jr., Garnett, D. R., & Terlevich, E. 1994, ApJ, 431, 172
- Skillman et al. (1989) Skillman, E. D., Kennicutt, R. C., & Hodge, P. W. 1989, ApJ, 347, 875
- Skillman & Kennicutt (1993) Skillman, E. D., & Kennicutt, R. C., Jr. 1993, ApJ, 411, 655
- Skillman et al. (1998) Skillman, E. D., Terlevich, E., & Terlevich, R. 1998, Space Science Reviews, 84, 105
- Skrutskie et al. (2006) Skrutskie, M. F., et al. 2006, AJ, 131, 1163
- Smith et al. (2007) Smith, J.-D. T., et al. accepted to ApJ
- Soifer et al. (1987) Soifer, B. T., Neugebauer, G., & Houck, J. R. 1987, ARA&A, 25, 187
- Stansberry et al. (2007) Stansberry, J. A., et al. 2007, PASP, 119, 1038
- Storchi-Bergmann et al. (1994) Storchi-Bergmann, T., Calzetti, D., & Kinney, A. L. 1994, ApJ, 429, 572
- Storchi-Bergmann et al. (1995) Storchi-Bergmann, T., Kinney, A. L., & Challis, P. 1995, ApJS, 98, 103
- Swaters et al. (2002) Swaters, R. A., van Albada, T. S., van der Hulst, J. M., & Sancisi, R. 2002, A&A, 390, 829
- Telesco (1988) Telesco, C. M. 1988, ARA&A, 26, 343
- Thompson et al. (2006) Thompson, R. I., Sauvage, M., Kennicutt, R. C., Jr., Engelbracht, C. W., & Vanzi, L. 2006, ApJ, 638, 176
- Thuan & Martin (1981) Thuan, T. X., & Martin, G. E. 1981, ApJ, 247, 823
- Thuan et al. (1999) Thuan, T. X., Sauvage, M., & Madden, S. 1999, ApJ, 516, 783
- Thuan et al. (2004) Thuan, T. X., Hibbard, J. E., & L(é)vrier, F. 2004, AJ, 128, 617
- Thuan & Izotov (2005) Thuan, T. X., & Izotov, Y. I. 2005, ApJS, 161, 240
- Tully et al. (2006) Tully, R. B., et al. 2006, AJ, 132, 729
- Vacca & Conti (1992) Vacca, W. D., & Conti, P. S. 1992, ApJ, 401, 543
- van Breugel et al. (1985) van Breugel, W., Filippenko, A. V., Heckman, T., & Miley, G. 1985, ApJ, 293, 83
- van Zee et al. (1997) van Zee, L., Haynes, M. P., & Salzer, J. J. 1997, AJ, 114, 2479
- van Zee et al. (1998) van Zee, L., Skillman, E. D., & Salzer, J. J. 1998, AJ, 116, 1186
- van Zee (2000) van Zee, L. 2000, AJ, 119, 2757
- van Zee & Haynes (2006) van Zee, L., & Haynes, M. P. 2006, ApJ, 636, 214
- Vanzi et al. (1996) Vanzi, L., Rieke, G. H., Martin, C. L., & Shields, J. C. 1996, ApJ, 466, 150
- Vanzi et al. (2000) Vanzi, L., Hunt, L. K., Thuan, T. X., & Izotov, Y. I. 2000, A&A, 363, 493
- Werner et al. (2004) Werner, M. W., et al. 2004, ApJS, 154, 1
- Wu et al. (2006) Wu, Y., Charmandaris, V., Hao, L., Brandl, B. R., Bernard-Salas, J., Spoon, H. W., & Houck, J. R. 2006, ApJ, 639, 157
- Young et al. (2003) Young, L. M., van Zee, L., Lo, K. Y., Dohm-Palmer, R. C., & Beierle, M. E. 2003, ApJ, 592, 111
- Zamorano & Rego (1986) Zamorano, J., & Rego, M. 1986, A&A, 170, 31
| Galaxy | aaUnless otherwise noted, oxygen abundances have been derived using the direct, electron-temperature () method applied to individual H II regions (e.g., Skillman et al., 1998). The electron temperature in the O++ zone was derived using the [O III] /[O III] ratios published in the references listed. The O+ temperature was predicted using the relation given by Garnett (1992), and the total oxygen abundance was subsequently computed as using the electron density derived from the [S II] doublet ratio (Shaw & Dufour, 1995). When multiple abundance estimates were available, we adopted the mean and the standard deviation of all the measurements as the final metallicity and error, assuming a minimum uncertainty of dex in the method. | unc. | ref. | (Mpc)bbSee §2 for details about how distances for the sample were computed. | unc. | ref. |
|---|---|---|---|---|---|---|
| SBS 0335-052 W | 1,2 | 47 | ||||
| I Zw 18 | 3,4,5,6,7 | 48 | ||||
| SBS 0335-052 E | 2,8 | 47 | ||||
| UGCA 292 | 9,10 | 49 | ||||
| SHOC 567 | 6 | 47 | ||||
| HS 0822+3542 | 3,11,12 | 50 | ||||
| ESO 489-G56 | 13 | 49 | ||||
| Tol 1214-277 | 14,15,16,17 | 47 | ||||
| UGC 4483 | 10,18,19 | 51 | ||||
| Tol 65 | 15,16,17 | 47 | ||||
| KUG 1013+381 | ccEmission-line fluxes for these objects were not given; therefore, we adopted the published oxygen abundances and errors. | 20 | 47 | |||
| SBS 1102+606 | ccEmission-line fluxes for these objects were not given; therefore, we adopted the published oxygen abundances and errors. | 21 | 47 | |||
| ESO 146-G14 | 13 | 47 | ||||
| Tol 0618-402 | 22 | 47 | ||||
| VII Zw 403 | 4 | 51 | ||||
| DDO 187 | 23,24 | 52 | ||||
| UM 461 | 3,6,8,15 | 47 | ||||
| Mrk 153 | 3 | 47 | ||||
| Mrk 178 | 25 | 47 | ||||
| UM 462 | 3,6,8,15 | 47 | ||||
| Haro 11 | 26 | 47 | ||||
| UGC 4393 | 6 | 47 | ||||
| Pox 4 | 15 | 47 | ||||
| UM 420 | 8 | 47 | ||||
| Mrk 1450 | 18 | 47 | ||||
| NGC 4861 | 4 | 47 | ||||
| Tol 2138-405 | 15 | 47 | ||||
| Mrk 206 | 6 | 47 | ||||
| UM 448 | 6,8 | 47 | ||||
| SHOC 391 | 3,6,15 | 47 | ||||
| Mrk 170 | 3 | 47 | ||||
| II Zw 40 | 25 | 53 | ||||
| Mrk 930 | 8 | 47 | ||||
| NGC 1569 | 27 | 49 | ||||
| Mrk 1094 | 28 | 47 | ||||
| NGC 3310 | 29 | 54 | ||||
| NGC 1156 | eeFor these objects no individual H ii regions have been observed; therefore, we applied the same methodology described in the preceeding footnote to the integrated emission-line fluxes published by Moustakas & Kennicutt (2006). | 30 | 49 | |||
| Mrk 162 | 8 | 47 | ||||
| NGC 5253 | 31,32 | 51 | ||||
| Minkowski’s Object | ddUnfortunately, the auroral [O iii] line in these objects was not detected; therefore, to estimate the oxygen abundance we use two different strong-line calibrations empirically tied to the electron temperature abundance scale. For high-excitation H ii regions we use the Pilyugin & Thuan (2005) calibration of ([O ii] [O iii] H, and for low-excitation H ii regions we use the Pettini & Pagel (2004) calibration of ([O iii] /H)/([N ii] /H). We adopt [O iii]/([O ii]+[O iii]) as the boundary between low- and high-excitation H ii regions (Pilyugin & Thuan, 2005), and assume a minimum uncertainty of dex in either method. | 33,34 | 47 | |||
| Tol 2 | 22 | 47 | ||||
| NGC 4449 | ddUnfortunately, the auroral [O iii] line in these objects was not detected; therefore, to estimate the oxygen abundance we use two different strong-line calibrations empirically tied to the electron temperature abundance scale. For high-excitation H ii regions we use the Pilyugin & Thuan (2005) calibration of ([O ii] [O iii] H, and for low-excitation H ii regions we use the Pettini & Pagel (2004) calibration of ([O iii] /H)/([N ii] /H). We adopt [O iii]/([O ii]+[O iii]) as the boundary between low- and high-excitation H ii regions (Pilyugin & Thuan, 2005), and assume a minimum uncertainty of dex in either method. | 35 | 51 | |||
| NGC 7714 | 36 | 47 | ||||
| UGC 4703 | ddUnfortunately, the auroral [O iii] line in these objects was not detected; therefore, to estimate the oxygen abundance we use two different strong-line calibrations empirically tied to the electron temperature abundance scale. For high-excitation H ii regions we use the Pilyugin & Thuan (2005) calibration of ([O ii] [O iii] H, and for low-excitation H ii regions we use the Pettini & Pagel (2004) calibration of ([O iii] /H)/([N ii] /H). We adopt [O iii]/([O ii]+[O iii]) as the boundary between low- and high-excitation H ii regions (Pilyugin & Thuan, 2005), and assume a minimum uncertainty of dex in either method. | 37 | 47 | |||
| NGC 1140 | 38 | 47 | ||||
| NGC 1510 | ddUnfortunately, the auroral [O iii] line in these objects was not detected; therefore, to estimate the oxygen abundance we use two different strong-line calibrations empirically tied to the electron temperature abundance scale. For high-excitation H ii regions we use the Pilyugin & Thuan (2005) calibration of ([O ii] [O iii] H, and for low-excitation H ii regions we use the Pettini & Pagel (2004) calibration of ([O iii] /H)/([N ii] /H). We adopt [O iii]/([O ii]+[O iii]) as the boundary between low- and high-excitation H ii regions (Pilyugin & Thuan, 2005), and assume a minimum uncertainty of dex in either method. | 39 | 47 | |||
| NGC 3125 | 32,40 | 53 | ||||
| NGC 4214 | 41 | 49 | ||||
| NGC 4670 | eeFor these objects no individual H ii regions have been observed; therefore, we applied the same methodology described in the preceeding footnote to the integrated emission-line fluxes published by Moustakas & Kennicutt (2006). | 30 | 47 | |||
| NGC 2537 | eeFor these objects no individual H ii regions have been observed; therefore, we applied the same methodology described in the preceeding footnote to the integrated emission-line fluxes published by Moustakas & Kennicutt (2006). | 30 | 49 | |||
| He 2-10 | ddUnfortunately, the auroral [O iii] line in these objects was not detected; therefore, to estimate the oxygen abundance we use two different strong-line calibrations empirically tied to the electron temperature abundance scale. For high-excitation H ii regions we use the Pilyugin & Thuan (2005) calibration of ([O ii] [O iii] H, and for low-excitation H ii regions we use the Pettini & Pagel (2004) calibration of ([O iii] /H)/([N ii] /H). We adopt [O iii]/([O ii]+[O iii]) as the boundary between low- and high-excitation H ii regions (Pilyugin & Thuan, 2005), and assume a minimum uncertainty of dex in either method. | 32 | 53 | |||
| NGC 3079 | eeFor these objects no individual H ii regions have been observed; therefore, we applied the same methodology described in the preceeding footnote to the integrated emission-line fluxes published by Moustakas & Kennicutt (2006). | 30 | 47 | |||
| NGC 3628 | eeFor these objects no individual H ii regions have been observed; therefore, we applied the same methodology described in the preceeding footnote to the integrated emission-line fluxes published by Moustakas & Kennicutt (2006). | 30 | 55 | |||
| NGC 2782 | eeFor these objects no individual H ii regions have been observed; therefore, we applied the same methodology described in the preceeding footnote to the integrated emission-line fluxes published by Moustakas & Kennicutt (2006). | 30 | 47 | |||
| NGC 3077 | eeFor these objects no individual H ii regions have been observed; therefore, we applied the same methodology described in the preceeding footnote to the integrated emission-line fluxes published by Moustakas & Kennicutt (2006). | 30 | 51 | |||
| NGC 5236 | ccEmission-line fluxes for these objects were not given; therefore, we adopted the published oxygen abundances and errors. | 42 | 51 | |||
| NGC 3367 | eeFor these objects no individual H ii regions have been observed; therefore, we applied the same methodology described in the preceeding footnote to the integrated emission-line fluxes published by Moustakas & Kennicutt (2006). | 30 | 47 | |||
| NGC 5953 | eeFor these objects no individual H ii regions have been observed; therefore, we applied the same methodology described in the preceeding footnote to the integrated emission-line fluxes published by Moustakas & Kennicutt (2006). | 30 | 47 | |||
| NGC 4194 | ddUnfortunately, the auroral [O iii] line in these objects was not detected; therefore, to estimate the oxygen abundance we use two different strong-line calibrations empirically tied to the electron temperature abundance scale. For high-excitation H ii regions we use the Pilyugin & Thuan (2005) calibration of ([O ii] [O iii] H, and for low-excitation H ii regions we use the Pettini & Pagel (2004) calibration of ([O iii] /H)/([N ii] /H). We adopt [O iii]/([O ii]+[O iii]) as the boundary between low- and high-excitation H ii regions (Pilyugin & Thuan, 2005), and assume a minimum uncertainty of dex in either method. | 37 | 47 | |||
| NGC 2146 | eeFor these objects no individual H ii regions have been observed; therefore, we applied the same methodology described in the preceeding footnote to the integrated emission-line fluxes published by Moustakas & Kennicutt (2006). | 30 | 47 | |||
| NGC 2903 | ccEmission-line fluxes for these objects were not given; therefore, we adopted the published oxygen abundances and errors. | 42 | 49 | |||
| Mrk 25 | ddUnfortunately, the auroral [O iii] line in these objects was not detected; therefore, to estimate the oxygen abundance we use two different strong-line calibrations empirically tied to the electron temperature abundance scale. For high-excitation H ii regions we use the Pilyugin & Thuan (2005) calibration of ([O ii] [O iii] H, and for low-excitation H ii regions we use the Pettini & Pagel (2004) calibration of ([O iii] /H)/([N ii] /H). We adopt [O iii]/([O ii]+[O iii]) as the boundary between low- and high-excitation H ii regions (Pilyugin & Thuan, 2005), and assume a minimum uncertainty of dex in either method. | 43 | 47 | |||
| NGC 1614 | eeFor these objects no individual H ii regions have been observed; therefore, we applied the same methodology described in the preceeding footnote to the integrated emission-line fluxes published by Moustakas & Kennicutt (2006). | 30 | 53 | |||
| NGC 3256 | ddUnfortunately, the auroral [O iii] line in these objects was not detected; therefore, to estimate the oxygen abundance we use two different strong-line calibrations empirically tied to the electron temperature abundance scale. For high-excitation H ii regions we use the Pilyugin & Thuan (2005) calibration of ([O ii] [O iii] H, and for low-excitation H ii regions we use the Pettini & Pagel (2004) calibration of ([O iii] /H)/([N ii] /H). We adopt [O iii]/([O ii]+[O iii]) as the boundary between low- and high-excitation H ii regions (Pilyugin & Thuan, 2005), and assume a minimum uncertainty of dex in either method. | 44,45 | 47 | |||
| Mrk 331 | eeFor these objects no individual H ii regions have been observed; therefore, we applied the same methodology described in the preceeding footnote to the integrated emission-line fluxes published by Moustakas & Kennicutt (2006). | 30 | 47 | |||
| IC 342 | ccEmission-line fluxes for these objects were not given; therefore, we adopted the published oxygen abundances and errors. | 46 | 51 |
References. — (1) Izotov et al. (2005); (2) Papaderos et al. (2006); (3) Izotov et al. (2006); (4) Izotov et al. (1997); (5) Izotov et al. (1999b); (6) Kniazev et al. (2004); (7) Skillman & Kennicutt (1993); (8) Izotov & Thuan (1998); (9) van Zee (2000); (10) van Zee & Haynes (2006); (11) Kniazev et al. (2000); (12) Pustilnik et al. (2003); (13) Roennback & Bergvall (1995); (14) Fricke et al. (2001); (15) Guseva et al. (2007); (16) Izotov et al. (2001); (17) Izotov et al. (2004); (18) Izotov et al. (1994); (19) Skillman et al. (1994); (20) Kniazev & Pustil’Nik (1998); (21) Kniazev et al. (2003); (22) Masegosa et al. (1994); (23) Lee et al. (2003); (24) van Zee et al. (1997); (25) Guseva et al. (2000); (26) Bergvall & Östlin (2002); (27) Kobulnicky et al. (1997a); (28) Méndez et al. (1999); (29) Pastoriza et al. (1993); (30) this paper; (31) Kobulnicky & Skillman (1997b); (32) Kobulnicky et al. (1999); (33) Croft et al. (2006); (34) van Breugel et al. (1985); (35) McCall et al. (1985); (36) Gonzalez-Delgado et al. (1995); (37) Kong & Cheng (2002); (38) Izotov & Thuan (2004); (39) Raimann et al. (2000); (40) Hadfield & Crowther (2006); (41) Kobulnicky & Skillman (1996); (42) Pilyugin et al. (2006); (43) Kong & Cheng (1999); (44) Lípari et al. (2000); (45) Storchi-Bergmann et al. (1995); (46) Pilyugin et al. (2004).;(47) this paper; (48) Östlin (2000); (49) Karachentsev et al. (2004); (50) Pustilnik et al. (2003); (51) Karachentsev (2005); (52) Tully et al. (2006); (53) Vacca & Conti (1992); (54) HYPERLEDA (Oct. 2007); (55) Ekholm et al. (2000).
| Galaxy | (Jy) | (Jy) | (Jy) | (Jy) | (Jy) | (Jy) | (Jy) |
|---|---|---|---|---|---|---|---|
| SBS 0335-052W | 2.34E51.86E6 | 3.47E52.62E6 | 3.78E5 | 4.65E5 | 6.93E41.46E4 | 1.75E2 | 6.06E2 |
| I Zw 18 | 3.75E41.24E5 | 3.51E41.24E5 | 3.42E43.83E5 | 5.48E43.74E5 | 6.29E32.27E4 | 3.49E24.79E3 | 7.68E2 |
| SBS 0335-052E | 7.61E42.34E5 | 1.63E34.93E5 | 4.23E31.32E4 | 1.29E23.89E4 | 7.93E21.59E3 | 5.24E26.38E3 | 6.06E2 |
| UGCA 292 | 6.86E42.19E5 | 3.95E41.63E5 | 4.59E45.62E5 | 7.11E47.23E5 | 7.51E41.49E4 | 2.98E22.81E+1 | 3.75E2 |
| SHOC 567 | 7.40E32.22E4 | 4.65E31.40E4 | 3.50E31.26E4 | 4.63E31.43E4 | 5.48E32.92E4 | 1.19E19.83E3 | 2.20E13.22E2 |
| HS 0822+3542 | 9.50E53.71E6 | 8.89E53.49E6 | 9.17E51.27E5 | 9.36E51.32E5 | 4.02E31.83E4 | 4.05E25.59E3 | 5.43E2 |
| ESO 489-G56 | 1.26E33.91E5 | 8.24E42.68E5 | 9.41E55.19E5 | 5.09E43.31E5 | 3.84E4 | 6.84E3 | 2.88E2 |
| Tol 1214-277 | 7.71E55.56E6 | 7.98E57.13E6 | 8.59E53.50E5 | 2.63E43.41E5 | 5.57E32.20E4 | 3.06E24.46E3 | 4.74E2 |
| UGC 4483 | 9.07E43.14E5 | 4.09E42.44E5 | 2.00E48.77E5 | 3.40E47.08E5 | 6.70E33.50E4 | 1.09E17.40E3 | 8.13E22.93E2 |
| Tol 65 | 2.87E49.97E6 | 3.40E41.22E5 | 6.04E44.25E5 | 1.05E34.95E5 | 1.86E23.95E4 | 2.69E24.89E3 | 7.83E2 |
| KUG 1013+381 | 5.19E44.70E3 | 4.67E41.49E5 | 4.74E43.30E5 | 7.01E43.63E5 | 1.78E23.91E4 | 8.04E28.01E3 | 8.43E2 |
| SBS 1102+606 | 3.91E41.23E5 | 2.59E49.38E6 | 2.75E43.16E5 | 2.63E42.32E5 | 2.51E31.05E4 | 4.24E25.43E3 | 4.65E2 |
| ESO 146-G14 | 9.43E42.86E5 | 6.09E41.92E5 | 5.18E43.46E5 | 4.50E43.29E5 | 3.51E33.52E4 | 1.02E11.14E2 | 1.62E13.97E2 |
| Tol 0618-402 | 2.33E37.01E5 | 1.46E34.42E5 | 1.09E34.22E5 | 8.04E43.37E5 | 4.39E41.19E4 | 6.10E34.74E3 | 1.14E1 |
| VII Zw 403 | 2.58E37.81E5 | 2.00E36.22E5 | 1.53E37.08E5 | 2.47E38.82E5 | 4.11E21.39E3 | 4.93E12.62E2 | 2.60E13.72E2 |
| DDO 187 | 3.11E39.54E5 | 2.43E37.69E5 | 5.25E41.16E4 | 8.93E41.09E4 | 1.96E34.76E4 | 2.52E2 | 5.61E2 |
| UM 461 | 6.79E42.07E5 | 6.06E41.94E5 | 7.06E43.96E5 | 1.70E36.05E5 | 3.55E27.29E4 | 1.41E11.02E2 | 4.19E21.91E2 |
| Mrk 178 | 9.87E42.99E5 | 7.87E42.43E5 | 4.68E43.68E5 | 5.91E43.45E5 | 2.76E31.58E4 | 1.85E11.25E2 | 1.28E12.32E2 |
| Mrk 153 | 1.80E35.42E5 | 1.44E34.35E5 | 1.53E35.35E5 | 2.69E38.35E5 | 3.02E26.31E4 | 2.45E11.37E2 | 1.49E12.78E2 |
| UM 462 | 2.52E37.56E5 | 2.42E37.30E5 | 3.08E39.83E5 | 6.75E32.06E4 | 1.20E12.41E3 | 1.00E+05.12E2 | 6.01E17.70E2 |
| Haro 11 | 2.26E26.78E4 | 3.22E29.67E4 | 7.89E22.37E3 | 1.79E15.36E3 | 2.36E+04.73E2 | 5.36E+02.68E1 | 2.19E+02.65E1 |
| UGC 4393 | 1.13E23.40E4 | 7.24E32.18E4 | 1.14E23.46E4 | 2.43E27.30E4 | 8.14E21.74E3 | 1.01E+05.30E2 | 3.70E+04.72E1 |
| POX 4 | 1.90E35.78E5 | 2.10E36.44E5 | 2.42E38.97E5 | 5.26E31.67E4 | 1.31E12.65E3 | 6.21E13.24E2 | 3.19E14.60E2 |
| UM 420 | 1.69E25.07E4 | 1.31E23.93E4 | 1.34E24.11E4 | 1.94E25.84E4 | |||
| Mrk 1450 | 1.17E33.53E5 | 9.61E42.92E5 | 1.18E34.55E5 | 2.46E37.68E5 | 5.72E21.16E3 | 3.19E11.69E2 | 1.40E12.30E2 |
| Tol 2138-405 | 1.17E33.56E5 | 7.85E42.47E5 | 9.15E44.88E5 | 2.29E37.77E5 | 6.48E21.30E3 | 1.66E11.08E2 | 1.50E12.76E2 |
| NGC 4861 | 1.36E24.09E4 | 9.59E32.89E4 | 9.31E33.06E4 | 1.64E24.99E4 | 3.57E17.64E3 | 2.20E+01.11E1 | 1.61E+01.96E1 |
| Mrk 206 | 6.65E32.00E4 | 4.94E31.48E4 | 1.58E24.75E4 | 3.77E21.13E3 | 2.19E14.37E3 | 1.29E+06.50E2 | 9.64E11.17E1 |
| UM 448 | 1.45E24.34E4 | 1.14E23.43E4 | 3.30E29.90E4 | 9.21E22.76E3 | 6.44E11.29E2 | 4.04E+02.03E1 | 2.85E+03.45E1 |
| SHOC 391 | 4.62E31.38E4 | 8.46E32.54E4 | 1.68E25.06E4 | 4.62E21.39E3 | 3.68E17.37E3 | 5.37E12.85E2 | 2.17E13.50E2 |
| Mrk 170 | 7.46E32.25E4 | 4.33E31.32E4 | 3.76E31.63E4 | 7.87E32.59E4 | 2.06E25.59E4 | 4.08E12.14E2 | 4.67E15.94E2 |
| II Zw 40 | 1.60E24.81E4 | 1.83E25.51E4 | 3.47E21.05E3 | 8.93E22.68E3 | 1.60E+03.20E2 | 5.58E+02.80E1 | 3.14E+04.31E1 |
| Mrk 930 | 2.72E38.18E5 | 2.32E36.97E5 | 4.38E31.34E4 | 1.10E23.32E4 | 1.87E13.74E3 | 1.15E+05.82E2 | 5.98E17.59E2 |
| NGC 1569 | 2.87E18.61E3 | 2.07E16.22E3 | 3.05E19.17E3 | 5.39E11.62E2 | 8.51E+01.70E1 | 4.26E+12.13E+0 | 3.97E+14.76E+0 |
| Mrk 1094 | 6.57E31.97E4 | 4.56E31.38E4 | 7.38E32.34E4 | 1.47E24.45E4 | 6.20E21.28E3 | 9.63E14.92E2 | 7.62E19.61E2 |
| NGC 3310 | 2.00E16.01E3 | 1.36E14.07E3 | 4.57E11.37E2 | 1.23E+03.70E2 | 4.99E+01.00E1 | 3.23E+12.38E+0bbThis object nearly fills the field of view at 70 µm; based on a comparison of different background subtraction techniques, we have increased the uncertainty by 5%. | 2.98E+13.58E+0 |
| Mrk 162 | 3.76E31.13E4 | 3.10E39.32E5 | 7.13E32.16E4 | 1.90E25.70E4 | 1.73E13.47E3 | 1.44E+07.26E2 | 1.52E+01.85E1 |
| NGC 1156 | 9.21E22.76E3 | 6.29E21.89E3 | 1.00E13.01E3 | 1.66E14.98E3 | 6.61E11.32E2 | 6.82E+03.43E1 | 3.51E+04.29E1 |
| NGC 5253 | 2.55E17.64E3 | 2.67E18.02E3 | 3.42E11.03E2 | 8.42E12.52E2 | 8.87E+01.77E1 | 2.66E+11.33E+0 | 1.80E+12.17E+0 |
| Tol 2 | 5.72E31.72E4 | 3.91E31.19E4 | 2.32E31.12E4 | 5.68E31.88E4 | 7.59E21.57E3 | 9.35E14.74E2 | 5.31E17.55E2 |
| Minkowski’s Obj. | 5.43E41.75E5 | 3.31E41.26E5 | 4.87E44.02E5 | 1.21E35.34E5 | 3.69E31.81E4 | 3.94E25.76E3 | 2.70E22.65E2aaThis object is blended with NGC 541 at 160 µm; the error bar has been increased accordingly. |
| NGC 4449 | 4.93E11.48E2 | 3.17E19.50E3 | 6.15E11.85E2 | 1.42E+04.27E2 | 3.27E+06.55E2 | 4.02E+12.01E+0 | 7.60E+19.12E+0 |
| NGC 7714 | 4.97E21.49E3 | 3.57E21.07E3 | 9.85E22.96E3 | 2.86E18.57E3 | 2.36E+04.71E2 | 9.73E+04.88E1 | 7.48E+08.99E1 |
| UGC 4703 | 1.92E35.77E5 | 1.36E34.14E5 | 3.06E31.00E4 | 8.38E32.55E4 | 2.76E25.78E4 | 2.25E11.56E2 | 3.27E14.60E2 |
| NGC 1140 | 2.99E28.97E4 | 2.04E26.12E4 | 3.96E21.20E3 | 9.02E22.71E3 | 3.88E17.82E3 | 3.43E+01.72E1 | 4.05E+04.87E1 |
| NGC 1510 | 8.45E32.54E4 | 5.94E31.78E4 | 9.18E32.77E4 | 1.97E25.91E4 | 1.32E12.65E3 | 1.16E+05.85E2 | 9.19E11.15E1 |
| NGC 3125 | 2.49E27.49E4 | 1.81E25.44E4 | 3.41E21.03E3 | 8.16E22.45E3 | 7.08E11.42E2 | 5.55E+02.78E1 | 4.44E+05.49E1 |
| NGC 4214 | 3.12E19.37E3 | 2.02E16.05E3 | 3.69E11.11E2 | 5.48E11.65E2 | 1.97E+03.95E2 | 2.04E+11.02E+0 | 2.34E+12.82E+0 |
| NGC 4670 | 2.90E28.69E4 | 1.90E25.70E4 | 3.21E29.71E4 | 6.73E22.02E3 | 2.88E16.07E3 | 3.47E+01.74E1 | 4.00E+04.81E1 |
| NGC 2537 | 8.08E22.43E3 | 5.16E21.55E3 | 7.11E22.14E3 | 1.42E14.25E3 | 2.99E16.09E3 | 4.04E+02.03E1 | 5.85E+07.03E1 |
| He 2-10 | 9.74E22.92E3 | 7.19E22.16E3 | 2.38E17.16E3 | 6.80E12.04E2 | 5.68E+01.14E1 | 1.94E+19.69E1 | 1.55E+11.86E+0 |
| NGC 3628 | 1.09E+03.26E2 | 7.32E12.20E2 | 1.50E+04.50E2 | 3.24E+09.71E2 | 7.00E+01.40E1 | 7.71E+16.67E+0ccBased on a comparison to the 24 µm image, % of the 70 µm light falls outside the field of view; the measurement and uncertainty have been revised accordingly. | 1.47E+21.77E+1 |
| NGC 3079 | 5.61E11.68E2 | 3.84E11.15E2 | 1.11E+03.34E2 | 2.47E+07.40E2 | 3.00E+06.04E2 | 6.37E+13.19E+0 | 9.13E+11.10E+1 |
| NGC 2782 | 1.15E13.44E3 | 8.74E22.62E3 | 1.46E14.38E3 | 4.69E11.41E2 | 1.17E+02.34E2 | 1.03E+15.16E1 | 1.15E+11.42E+0 |
| NGC 3077 | 4.96E11.49E2 | 3.56E11.07E2 | 3.91E11.18E2 | 1.01E+03.02E2 | 1.79E+03.62E2 | 2.01E+11.01E+0 | 1.73E+12.08E+0 |
| NGC 3367 | 1.15E13.44E3 | 7.46E22.24E3 | 1.58E14.75E3 | 4.07E11.22E2 | 1.32E+02.65E2 | 7.77E+03.89E1 | 1.38E+11.66E+0 |
| NGC 5236 | 3.56E+01.07E1 | 2.32E+06.97E2 | 1.10E+13.29E1 | 2.10E+16.31E1 | 4.22E+18.43E1 | 3.12E+21.56E+1 | 8.48E+21.02E+2 |
| NGC 5953 | 8.72E22.62E3 | 5.78E21.74E3 | 1.61E14.84E3 | 4.30E11.29E2 | 7.37E11.47E2 | 9.18E+04.59E1 | 1.57E+11.88E+0 |
| NGC 4194 | 9.48E22.84E3 | 7.89E22.37E3 | 3.20E19.62E3 | 7.39E12.22E2 | 4.07E+08.15E2 | 1.91E+19.53E1 | 1.33E+11.59E+0 |
| NGC 2903 | 1.13E+03.39E2 | 7.13E12.14E2 | 1.56E+04.69E2 | 4.34E+01.30E1 | 9.69E+01.94E1 | 7.64E+13.83E+0 | 1.56E+22.03E+1ddBased on a comparison to the 70 µm image, % of the 160 µm light falls outside the field of view; the measurement and uncertainty have been revised accordingly. |
| NGC 2146 | 9.53E12.86E2 | 7.05E12.11E2 | 2.83E+08.49E2 | 9.37E+02.81E1 | 1.70E+13.41E1 | 1.46E+27.29E+0 | 1.12E+21.35E+1 |
| Mrk 25 | 1.04E23.11E4 | 6.81E32.04E4 | 1.59E24.79E4 | 4.42E21.33E3 | 2.21E14.43E3 | 1.37E+06.92E2 | 1.03E+01.28E1 |
| NGC 1614 | 1.03E13.09E3 | 7.56E22.27E3 | 2.93E18.81E3 | 8.87E12.66E2 | 5.89E+01.18E1 | 2.48E+11.24E+0 | 1.71E+12.05E+0 |
| NGC 3256 | 2.54E17.63E3 | 2.71E18.12E3 | 9.98E13.00E2 | 2.74E+08.22E2 | 1.26E+12.52E1 | 8.73E+14.37E+0 | 5.94E+17.13E+0 |
| Mrk 331 | 4.81E21.44E3 | 3.66E21.10E3 | 1.40E14.20E3 | 4.56E11.37E2 | 2.02E+04.05E2 | 1.48E+17.41E1 | 1.32E+11.59E+0 |
| IC 342 | 8.79E+02.64E1 | 3.78E+01.13E1 | 9.25E+02.77E1 | 2.88E+18.63E1 | 3.89E+17.78E1 | 4.04E+22.02E+1 | 8.78E+21.05E+2 |
Note. — The uncertanties listed in the table are the root-sum-square of the scatter in the counts (taken from the data), the calibration uncertainties (cf. Reach et al. (2005), Engelbracht et al. (2007), Gordon et al. (2007), and Stansberry et al. (2007)), and confusion noise (Dole et al., 2004), while upper limits indicate galaxies that were not detected.
| J | H | Ks | ref. | |||||
|---|---|---|---|---|---|---|---|---|
| Galaxy | (Jy) | (Jy) | (Jy) | (Jy) | (Jy) | (Jy) | (Jy) | |
| SBS 0335-052W | 7.70E51.03E5 | 6.96E59.36E6 | 5.30E57.13E6 | 1 | 8.52E2 | 9.18E2 | 1.21E1 | 5.67E1 |
| I Zw 18 | 7.49E47.97E5 | 6.40E46.88E5 | 5.20E45.65E5 | 2 | 8.52E2 | 9.18E2 | 1.21E1 | 5.67E1 |
| SBS 0335-052E | 4.95E45.20E5 | 3.75E43.96E5 | 4.49E44.73E5 | 1 | 8.52E2 | 9.18E2 | 1.21E1 | 5.67E1 |
| UGCA 292 | 2.10E32.37E4 | 2.04E32.35E4 | 1.53E33.01E4 | 3 | 8.52E2 | 9.18E2 | 1.21E1 | 5.67E1 |
| SHOC 567 | 2.28E22.32E3 | 2.48E22.53E3 | 1.71E21.74E3 | 4 | ||||
| HS 0822+3542 | 1.54E41.90E5 | 3.36E43.87E5 | 1.56E42.56E5 | 5 | 8.52E2 | 9.18E2 | 1.21E1 | 5.67E1 |
| ESO 489-G56 | 1.93E31.97E4 | 1.70E31.75E4 | 1.24E31.28E4 | 6 | ||||
| Tol 1214-277 | 1.73E41.76E5 | 1.28E41.30E5 | 9.91E51.01E5 | 7 | 8.52E2 | 9.18E2 | 1.21E1 | 5.67E1 |
| UGC 4483 | 2.20E32.33E4 | 9.43E41.16E4 | 3.11E33.86E4 | 8 | 8.52E2 | 9.18E2 | 1.21E1 | 5.67E1 |
| Tol 65 | 3.82E43.88E5 | 3.09E43.15E5 | 2.68E42.73E5 | 7 | 8.52E2 | 9.18E2 | 1.21E1 | 5.67E1 |
| KUG 1013+381 | 4.23E47.49E5 | 2.16E42.20E5 | 3.91E48.46E5 | 9 | ||||
| SBS 1102+606 | 8.29E48.98E5 | 1.07E31.17E4 | 8.02E49.14E5 | 10 | ||||
| ESO 146-G14 | 6.96E48.73E5 | 5.28E41.00E4 | 6.20E46.31E5 | 9 | ||||
| Tol 0618-402 | 4.31E35.36E4 | 5.84E37.52E4 | 4.06E36.64E4 | 9 | 8.52E2 | 9.18E2 | 1.21E1 | 5.67E1 |
| VII Zw 403 | 4.31E34.39E4 | 3.89E34.01E4 | 2.97E33.08E4 | 11 | 6.80E21.27E2 | 5.87E21.13E2 | 3.87E14.41E2 | 8.96E11.97E1 |
| DDO 187 | 5.13E35.42E4 | 6.70E37.10E4 | 3.91E34.89E4 | 12 | 8.52E2 | 9.18E2 | 1.21E1 | 5.67E1 |
| UM 461 | 2.03E32.09E4 | 1.49E31.55E4 | 1.27E31.35E4 | 13 | 8.52E2 | 9.18E2 | 1.21E1 | 5.67E1 |
| Mrk 178 | 4.68E47.11E5 | 3.68E46.76E5 | 6.03E46.14E5 | 9 | ||||
| Mrk 153 | 4.64E35.59E4 | 4.27E35.91E4 | 3.63E35.07E4 | 14 | 7.35E21.65E2 | 9.59E22.24E2 | 2.82E14.17E2 | 4.80E11.18E1 |
| UM 462 | 7.49E37.87E4 | 7.28E37.54E4 | 5.45E35.74E4 | 15 | 7.77E22.13E2 | 1.43E13.99E2 | 8.96E18.87E2 | 8.86E11.72E1 |
| Haro 11 | 1.23E21.28E3 | 1.25E21.34E3 | 1.34E21.49E3 | 16 | 4.53E15.46E2 | 2.55E+02.36E1 | 5.94E+05.48E1 | 4.91E+06.41E1 |
| UGC 4393 | 1.58E21.60E3 | 1.67E21.70E3 | 2.86E22.91E3 | 17 | ||||
| POX 4 | 3.65E33.95E4 | 3.52E34.42E4 | 2.33E32.83E4 | 18 | ||||
| UM 420 | 3.42E23.48E3 | 4.77E24.86E3 | 2.09E22.13E3 | 19 | ||||
| Mrk 1450 | 3.69E33.80E4 | 1.54E31.63E4 | 1.91E32.12E4 | 20 | 5.77E21.19E2 | 1.04E12.39E2 | 2.82E14.15E2 | 5.75E11.41E1 |
| Tol 2138-405 | 2.06E33.09E4 | 2.50E34.07E4 | 2.42E34.35E4 | 9 | 6.17E21.33E2 | 9.39E22.17E2 | 1.85E14.08E2 | 5.62E11.39E1 |
| NGC 4861 | 1.68E21.88E3 | 1.40E21.82E3 | 1.31E21.83E3 | 9 | 2.46E12.75E2 | 4.13E18.75E2 | 1.82E+03.85E1 | 2.39E+05.46E1 |
| Mrk 206 | 1.07E21.09E3 | 1.35E21.38E3 | 1.15E21.17E3 | 10 | ||||
| UM 448 | 1.92E22.02E3 | 2.22E22.39E3 | 1.94E22.19E3 | 9 | 1.51E13.55E2 | 7.77E11.08E1 | 4.01E+03.97E1 | 4.30E+06.12E1 |
| SHOC 391 | 1.45E31.55E4 | 9.51E41.23E4 | 1.28E31.66E4 | 21 | 5.34E1 | 4.65E18.12E2 | 5.97E16.81E2 | 1.91E+0 |
| Mrk 170 | 7.56E37.78E4 | 7.15E37.61E4 | 6.03E36.40E4 | 22 | 5.90E21.22E2 | 7.01E21.49E2 | 3.49E14.55E2 | 5.62E11.69E1 |
| II Zw 40 | 1.51E21.54E3 | 2.10E22.16E3 | 2.03E22.10E3 | 23 | 4.47E14.60E2 | 1.94E+01.79E1 | 5.72E+05.66E1 | 5.75E+01.07E+0 |
| Mrk 930 | 3.52E33.61E4 | 4.64E34.77E4 | 3.53E33.64E4 | 10 | 8.12E22.46E2 | 2.49E13.67E2 | 1.26E+01.24E1 | 2.15E+07.09E1 |
| NGC 1569 | 4.73E14.86E2 | 5.47E15.68E2 | 4.79E14.97E2 | 9 | 8.72E16.81E2 | 7.73E+06.23E1 | 4.40E+13.55E+0 | 4.71E+15.90E+0 |
| Mrk 1094 | 1.14E21.16E3 | 1.22E21.24E3 | 9.12E39.31E4 | 13 | ||||
| NGC 3310 | 2.48E12.53E2 | 2.90E12.98E2 | 2.31E12.38E2 | 9 | 1.20E+01.03E1 | 5.00E+05.31E1 | 2.99E+13.18E+0 | 3.92E+15.33E+0 |
| Mrk 162 | 4.43E34.85E4 | 4.68E35.45E4 | 4.09E34.97E4 | 9 | ||||
| NGC 1156 | 1.14E11.17E2 | 1.31E11.35E2 | 1.01E11.05E2 | 9 | 1.66E12.94E2 | 5.84E16.21E2 | 5.20E+05.94E1 | 9.20E+01.15E+0 |
| NGC 5253 | 3.79E13.93E2 | 4.15E14.36E2 | 3.34E13.63E2 | 9 | 2.81E+01.99E1 | 1.23E+11.05E+0 | 2.90E+12.34E+0 | 2.91E+13.64E+0 |
| Tol 2 | 1.14E21.27E3 | 1.06E21.30E3 | 6.86E31.06E3 | 9 | 8.52E2 | 9.18E2 | 1.21E1 | 5.67E1 |
| Minkowski’s Obj. | 3.33E43.72E5 | 3.68E44.27E5 | 3.50E44.31E5 | 5 | 8.52E2 | 9.18E2 | 1.21E1 | 5.67E1 |
| NGC 4449 | 9.17E19.54E2 | 1.07E+01.13E1 | 8.40E19.08E2 | 9 | 2.14E+02.30E1 | 5.15E+06.55E1 | 3.63E+13.95E+0 | 7.30E+11.13E+1 |
| NGC 7714 | 7.84E28.08E3 | 8.92E29.35E3 | 8.32E28.72E3 | 9 | 5.06E15.66E2 | 2.97E+03.39E1 | 1.01E+17.18E1 | 1.15E+11.44E+0 |
| UGC 4703 | 6.29E36.98E4 | 5.42E36.25E4 | 3.95E34.71E4 | 9 | ||||
| NGC 1140 | 4.90E25.11E3 | 5.73E26.09E3 | 4.17E24.59E3 | 9 | 9.73E22.76E2 | 4.91E15.60E2 | 3.34E+03.08E1 | 4.92E+06.41E1 |
| NGC 1510 | 3.33E23.50E3 | 4.35E24.70E3 | 2.91E23.48E3 | 9 | ||||
| NGC 3125 | 4.51E24.73E3 | 4.72E25.12E3 | 4.13E24.66E3 | 9 | 2.12E13.14E2 | 8.62E11.20E1 | 4.87E+04.50E1 | 5.11E+08.70E1 |
| NGC 4214 | 5.23E15.47E2 | 6.11E16.61E2 | 4.57E15.09E2 | 9 | 6.46E16.66E2 | 2.58E+01.88E1 | 1.79E+11.25E+0 | 2.90E+13.19E+0 |
| NGC 4670 | 4.77E24.94E3 | 5.18E25.51E3 | 4.57E24.99E3 | 9 | 1.64E1 | 3.16E14.95E2 | 2.64E+02.82E1 | 4.47E+05.60E1 |
| NGC 2537 | 1.67E11.73E2 | 1.83E11.91E2 | 1.49E11.58E2 | 9 | 1.51E13.53E2 | 3.64E15.06E2 | 3.27E+03.01E1 | 6.45E+08.08E1 |
| He 2-10 | 1.78E11.82E2 | 2.01E12.07E2 | 1.68E11.75E2 | 9 | 1.18E+01.32E1 | 6.78E+07.21E1 | 2.34E+12.86E+0 | 2.63E+13.91E+0 |
| NGC 3628 | 2.16E+02.23E1 | 2.87E+02.99E1 | 2.49E+02.59E1 | 9 | 3.05E+07.77E1 | 5.89E+01.54E+0 | 4.90E+11.27E+1 | 1.22E+23.33E+1 |
| NGC 3079 | 6.71E16.89E2 | 9.00E19.29E2 | 8.32E18.60E2 | 9 | 1.49E+01.06E1 | 2.55E+02.20E1 | 4.49E+14.14E+0 | 8.92E+11.08E+1 |
| NGC 2782 | 1.93E11.98E2 | 2.30E12.36E2 | 1.89E11.95E2 | 9 | 5.08E15.24E2 | 1.54E+01.52E1 | 8.72E+09.93E1 | 1.46E+11.76E+0 |
| NGC 3077 | 9.01E19.20E2 | 9.78E11.01E1 | 8.02E18.31E2 | 9 | 5.80E14.54E2 | 2.09E+01.79E1 | 1.38E+11.57E+0 | 2.64E+13.09E+0 |
| NGC 3367 | 1.99E12.05E2 | 2.30E12.40E2 | 2.09E12.19E2 | 9 | 4.85E15.86E2 | 1.17E+01.25E1 | 6.07E+06.00E1 | 1.26E+11.58E+0 |
| NGC 5236 | 9.69E+09.97E1 | 1.15E+11.19E+0 | 9.47E+09.88E1 | 9 | 2.61E+14.12E+0 | 5.12E+18.48E+0 | 2.69E+24.45E+1 | 6.39E+21.19E+2 |
| NGC 5953 | 1.72E11.76E2 | 2.14E12.22E2 | 1.45E11.49E2 | 9 | 5.42E15.11E2 | 1.27E+01.17E1 | 1.01E+19.30E1 | 1.90E+12.30E+0 |
| NGC 4194 | 8.92E29.15E3 | 1.09E11.13E2 | 9.38E29.74E3 | 9 | 9.01E17.04E2 | 4.61E+03.97E1 | 2.09E+12.91E+0 | 2.59E+13.03E+0 |
| NGC 2903 | 2.65E+02.71E1 | 3.01E+03.10E1 | 2.56E+02.64E1 | 9 | 4.92E+07.77E1 | 8.34E+01.38E+0 | 5.27E+18.72E+0 | 1.46E+22.72E+1 |
| NGC 2146 | 8.14E18.39E2 | 1.10E+01.14E1 | 1.00E+01.04E1 | 9 | 6.41E+04.10E1 | 1.93E+11.55E+0 | 1.30E+21.05E+1 | 1.84E+22.22E+1 |
| Mrk 25 | 2.10E22.19E3 | 2.39E22.51E3 | 2.05E22.23E3 | 9 | 9.65E22.46E2 | 2.68E13.97E2 | 1.22E+01.13E1 | 1.59E+02.36E1 |
| NGC 1614 | 8.92E29.13E3 | 1.13E11.16E2 | 1.09E11.12E2 | 9 | 1.56E+01.10E1 | 7.76E+06.68E1 | 3.12E+12.52E+0 | 3.25E+13.81E+0 |
| NGC 3256 | 3.24E13.31E2 | 4.19E14.30E2 | 3.84E13.96E2 | 9 | 3.50E+02.47E1 | 1.72E+11.59E+0 | 8.75E+18.06E+0 | 1.15E+21.39E+1 |
| Mrk 331 | 5.68E25.84E3 | 7.22E27.48E3 | 7.45E27.78E3 | 9 | 5.37E15.07E2 | 2.73E+02.71E1 | 1.81E+11.79E+0 | 2.16E+12.70E+0 |
| IC 342 | 8.68E+09.12E1 | 1.01E+11.10E+0 | 1.00E+11.08E+0 | 9 | 2.35E+13.72E+0 | 4.86E+18.04E+0 | 2.59E+24.28E+1 | 6.62E+21.23E+2 |
Note. — The uncertainties are derived from the fluctuations in the counts or from the quoted sources and are combined in quadrature with a 10% uncertainty on the conversion to global flux (cf. Jarrett et al., 2003), while the upper limits indicate no source was detected.
References. — (1) Vanzi et al. (2000); (2) Hunt et al. (2003); (3) this paper (45”x37” aperture); (4) this paper (26” aperture); (5) this paper (10” aperture); (6) this paper (34”x31” aperture); (7) Noeske et al. (2003); (8) this paper (45” aperture); (9) 2MASS (Jarrett et al. (2003)); (10) this paper (13” aperture); (11) this paper (37”x45” aperture); (12) this paper (80”x80” aperture); (13) this paper (20” aperture); (14) 2MASS (this paper, 30” aper.); (15) Cairós et al. (2003); (16) 2MASS (this paper, 15” aper.); (17) this paper (30” aperture); (18) this paper (32” aper.); (19) this paper (29” aperture); (20) 2MASS (this paper, 20” aper.); (21) 2MASS (this paper, 15” aper.); (22) 2MASS (this paper, 40” aper.); (23) 2MASS (this paper, 49”x49” aper.).
| Galaxy | R.A. | DEC. |
|---|---|---|
| SBS 0335-052W | 03:37:38.4 | -05:02:37.0 |
| I Zw 18 | 09:34:02.1 | 55:14:27.9 |
| SBS 0335-052E | 03:37:44.1 | -05:02:40.3 |
| UGCA 292 | 12:38:39.8 | 32:45:52.0 |
| SHOC 567 | 17:19:42.1 | 61:18:51.7 |
| HS 0822+3542 | 08:25:55.5 | 35:32:31.9 |
| ESO 489-G56aaCoordinates refer to the center of an ellipse fit to the outermost isotope at least above the noise level, or about 0.04 MJy/sr. | 06:26:17.6 | -26:15:56.8 |
| Tol 1214-277 | 12:17:17.1 | -28:02:31.8 |
| UGC 4483 | 08:37:03.0 | 69:46:51.1 |
| Tol 65 | 12:25:46.4 | -36:14:00.2 |
| KUG 1013+381 | 10:16:24.5 | 37:54:46.8 |
| SBS 1102+606 | 11:05:52.5 | 60:22:28.1 |
| ESO 146-G14 | 22:12:59.8 | -62:04:06.6 |
| Tol 0618-402 | 06:20:02.6 | -40:18:08.2 |
| VII Zw 403aaCoordinates refer to the center of an ellipse fit to the outermost isotope at least above the noise level, or about 0.04 MJy/sr. | 11:27:57.9 | 78:59:38.0 |
| DDO 187aaCoordinates refer to the center of an ellipse fit to the outermost isotope at least above the noise level, or about 0.04 MJy/sr. | 14:15:57.2 | 23:03:21.5 |
| UM 461 | 11:51:33.3 | -02:22:21.7 |
| Mrk 178 | 11:33:28.9 | 49:14:21.5 |
| Mrk 153 | 10:49:04.9 | 52:20:07.3 |
| UM 462 | 11:52:37.2 | -02:28:10.2 |
| Haro 11 | 00:36:52.5 | -33:33:16.8 |
| UGC 4393aaCoordinates refer to the center of an ellipse fit to the outermost isotope at least above the noise level, or about 0.04 MJy/sr. | 08:26:04.7 | 45:58:05.9 |
| POX 4 | 11:51:11.5 | -20:35:58.7 |
| UM 420 | 02:20:54.5 | 00:33:24.2 |
| Mrk 1450 | 11:38:35.7 | 57:52:27.4 |
| Tol 2138-405 | 21:41:21.8 | -40:19:05.9 |
| NGC 4861 | 12:59:00.3 | 34:50:43.8 |
| Mrk 206 | 12:24:17.0 | 67:26:23.9 |
| UM 448 | 11:42:12.2 | 00:20:04.3 |
| SHOC 391 | 12:53:06.0 | -03:12:58.7 |
| Mrk 170 | 11:26:50.6 | 64:08:11.7 |
| II Zw 40 | 05:55:42.6 | 03:23:31.8 |
| Mrk 930 | 23:31:58.6 | 28:56:50.1 |
| NGC 1569 | 04:30:49.1 | 64:50:52.7 |
| Mrk 1094 | 05:10:48.1 | -02:40:54.1 |
| NGC 3310 | 10:38:45.8 | 53:30:12.3 |
| Mrk 162 | 11:05:08.3 | 44:44:51.2 |
| NGC 1156 | 02:59:41.3 | 25:14:15.0 |
| NGC 5253 | 13:39:56.0 | -31:38:24.2 |
| Tol 2 | 09:59:21.2 | -28:08:01.3 |
| Minkowski’s Obj. | 01:25:47.3 | -01:22:19.2 |
| NGC 4449 | 12:28:11.1 | 44:05:37.3 |
| NGC 7714 | 23:36:14.1 | 02:09:18.2 |
| UGC 4703 | 08:58:29.8 | 06:19:16.6 |
| NGC 1140 | 02:54:33.5 | -10:01:41.6 |
| NGC 1510 | 04:03:32.7 | -43:24:00.1 |
| NGC 3125 | 10:06:33.3 | -29:56:07.0 |
| NGC 4214aaCoordinates refer to the center of an ellipse fit to the outermost isotope at least above the noise level, or about 0.04 MJy/sr. | 12:15:39.5 | 36:19:35.4 |
| NGC 4670 | 12:45:17.2 | 27:07:31.8 |
| NGC 2537 | 08:13:13.2 | 45:59:40.5 |
| He 2-10 | 08:36:15.2 | -26:24:34.2 |
| NGC 3628 | 11:20:17.0 | 13:35:20.0 |
| NGC 3079 | 10:01:57.8 | 55:40:47.5 |
| NGC 2782 | 09:14:05.1 | 40:06:49.2 |
| NGC 3077 | 10:03:19.1 | 68:44:01.0 |
| NGC 3367 | 10:46:35.0 | 13:45:02.8 |
| NGC 5236 | 13:37:00.6 | -29:51:57.1 |
| NGC 5953 | 15:34:32.4 | 15:11:37.5 |
| NGC 4194 | 12:14:09.7 | 54:31:35.5 |
| NGC 2903 | 09:32:10.2 | 21:30:05.9 |
| NGC 2146 | 06:18:37.7 | 78:21:24.4 |
| Mrk 25 | 10:03:51.9 | 59:26:10.2 |
| NGC 1614 | 04:34:00.1 | -08:34:44.9 |
| NGC 3256 | 10:27:51.3 | -43:54:14.0 |
| Mrk 331 | 23:51:26.8 | 20:35:10.6 |
| IC 342 | 03:46:48.4 | 68:05:46.7 |
| Band | Z | Z | |||
|---|---|---|---|---|---|
| J | |||||
| H | |||||
| K | |||||
| IRAC1 | |||||
| IRAC2 | |||||
| IRAC3 | |||||
| IRAC4 | |||||
| MIPS1 | |||||
| MIPS2 | |||||
| MIPS3 |
| Galaxy | (Jy) | (Jy) | (Jy) | (Jy) | (Jy) | (Jy) | (Jy) |
|---|---|---|---|---|---|---|---|
| SBS 0335-052W | 2.34E51.86E6 | 1.94E51.81E6 | 3.78E5 | 4.65E5 | 6.92E41.46E4 | 1.75E2 | 6.06E2 |
| I Zw 18 | 3.75E41.24E5 | 1.58E43.49E5 | 2.09E44.92E5 | 4.71E49.01E5 | 6.28E32.27E4 | 3.49E24.79E3 | 7.68E2 |
| SBS 0335-052EaaStellar flux scaled from J and H bands, as described in § 4.2 | 7.61E42.34E5 | 1.50E33.07E4 | 4.14E38.56E4 | 1.28E22.70E3 | 7.93E21.59E3 | 5.24E26.38E3 | 6.06E2 |
| UGCA 292 | 6.86E42.19E5 | 1.18E4 | 1.47E41.96E5 | 5.40E46.12E5 | 7.25E41.44E4 | 2.98E22.81E+1 | 3.75E2 |
| SHOC 567 | 7.40E32.22E4 | 1.39E3 | 9.99E4 | 2.69E31.97E4 | 5.20E32.78E4 | 1.19E19.83E3 | 2.20E13.22E2 |
| HS 0822+3542 | 9.50E53.71E6 | 2.93E51.95E6 | 4.95E57.33E6 | 7.02E51.05E5 | 4.02E31.83E4 | 4.05E25.59E3 | 5.43E2 |
| ESO 489-G56 | 1.26E33.91E5 | 2.55E49.66E5 | 9.03E4 | 2.95E41.14E4 | 3.84E4 | 6.84E3 | 2.88E2 |
| Tol 1214-277 | 7.71E55.56E6 | 4.31E51.28E5 | 6.10E53.00E5 | 2.49E47.45E5 | 5.57E32.20E4 | 3.06E24.46E3 | 4.74E2 |
| UGC 4483 | 9.07E43.14E5 | 1.72E3 | 1.56E3 | 2.04E4 | 6.64E33.48E4 | 1.09E17.40E3 | 8.13E22.93E2 |
| Tol 65 | 2.87E49.97E6 | 2.07E48.01E5 | 5.13E41.88E4 | 1.00E33.86E4 | 1.86E23.95E4 | 2.69E24.89E3 | 7.83E2 |
| KUG 1013+381 | 5.19E44.70E3 | 2.29E49.90E5 | 3.13E41.40E4 | 6.10E42.69E4 | 1.78E23.91E4 | 8.04E28.01E3 | 8.43E2 |
| SBS 1102+606 | 3.91E41.23E5 | 5.28E5 | 8.53E51.13E5 | 1.55E41.73E5 | 2.49E31.04E4 | 4.24E25.43E3 | 4.65E2 |
| ESO 146-G14 | 9.43E42.86E5 | 2.01E49.62E5 | 2.28E41.11E4 | 2.93E41.52E4 | 3.49E33.50E4 | 1.02E11.14E2 | 1.62E13.97E2 |
| Tol 0618-402 | 2.33E37.01E5 | 1.46E56.36E7 | 5.45E53.03E6 | 2.25E41.31E5 | 3.51E49.53E5 | 6.10E34.74E3 | 1.14E1 |
| VII Zw 403 | 2.58E37.81E5 | 9.00E42.96E4 | 7.50E42.52E4 | 2.03E36.79E4 | 4.10E21.39E3 | 4.93E12.62E2 | 2.60E13.72E2 |
| DDO 187 | 3.11E39.54E5 | 1.02E32.66E4 | 1.42E3 | 3.21E49.40E5 | 1.88E34.57E4 | 2.52E2 | 5.61E2 |
| UM 461 | 6.79E42.07E5 | 2.67E43.07E5 | 4.66E46.20E5 | 1.56E31.81E4 | 3.55E27.29E4 | 1.41E11.02E2 | 4.19E21.91E2 |
| Mrk 178 | 9.87E42.99E5 | 3.78E41.82E4 | 1.64E47.92E5 | 4.14E41.95E4 | 2.73E31.57E4 | 1.85E11.25E2 | 1.28E12.32E2 |
| Mrk 153 | 1.80E35.42E5 | 4.46E42.16E5 | 8.11E44.08E5 | 2.26E31.19E4 | 3.01E26.30E4 | 2.45E11.37E2 | 1.49E12.78E2 |
| UM 462 | 2.52E37.56E5 | 1.02E34.40E5 | 2.06E39.04E5 | 6.18E32.67E4 | 1.20E12.41E3 | 1.00E+05.12E2 | 6.01E17.70E2 |
| Haro 11aaStellar flux scaled from J and H bands, as described in § 4.2 | 2.26E26.78E4 | 2.83E23.64E3 | 7.61E29.98E3 | 1.77E12.26E2 | 2.36E+04.73E2 | 5.36E+02.68E1 | 2.19E+02.65E1 |
| UGC 4393 | 1.13E23.40E4 | 6.51E3 | 4.10E31.03E3 | 1.99E25.57E3 | 8.07E21.73E3 | 1.01E+05.30E2 | 3.70E+04.72E1 |
| POX 4 | 1.90E35.78E5 | 1.28E33.96E4 | 1.84E35.41E4 | 4.94E31.55E3 | 1.31E12.65E3 | 6.21E13.24E2 | 3.19E14.60E2 |
| UM 420 | 1.69E25.07E4 | 5.90E31.83E3 | 8.31E32.64E3 | 1.65E24.97E3 | |||
| Mrk 1450 | 1.17E33.53E5 | 4.42E49.91E5 | 8.02E41.68E4 | 2.26E34.94E4 | 5.72E21.16E3 | 3.19E11.69E2 | 1.40E12.30E2 |
| Tol 2138-405 | 1.17E33.56E5 | 3.92E52.84E6 | 3.57E43.20E5 | 1.97E31.69E4 | 6.48E21.30E3 | 1.66E11.08E2 | 1.50E12.76E2 |
| NGC 4861 | 1.36E24.09E4 | 3.93E31.47E3 | 5.31E32.11E3 | 1.41E25.26E3 | 3.57E17.63E3 | 2.20E+01.11E1 | 1.61E+01.96E1 |
| Mrk 206 | 6.65E32.00E4 | 1.19E36.38E5 | 1.31E26.81E4 | 3.61E22.29E3 | 2.19E14.37E3 | 1.29E+06.50E2 | 9.64E11.17E1 |
| UM 448 | 1.45E24.34E4 | 4.10E37.79E4 | 2.77E25.26E3 | 8.91E21.67E2 | 6.44E11.29E2 | 4.04E+02.03E1 | 2.85E+03.45E1 |
| SHOC 391aaStellar flux scaled from J and H bands, as described in § 4.2 | 4.62E31.38E4 | 8.17E32.32E3 | 1.66E24.49E3 | 4.61E21.25E2 | 3.68E17.37E3 | 5.37E12.85E2 | 2.17E13.50E2 |
| Mrk 170 | 7.46E32.25E4 | 1.39E36.13E4 | 1.62E37.41E4 | 6.69E33.04E3 | 2.04E25.60E4 | 4.08E12.14E2 | 4.67E15.94E2 |
| II Zw 40 | 1.60E24.81E4 | 9.88E31.55E3 | 2.85E24.20E3 | 8.55E21.27E2 | 1.60E+03.20E2 | 5.58E+02.80E1 | 3.14E+04.31E1 |
| Mrk 930 | 2.72E38.18E5 | 9.98E42.12E4 | 3.37E36.82E4 | 1.04E21.95E3 | 1.87E13.74E3 | 1.15E+05.82E2 | 5.98E17.59E2 |
| NGC 1569 | 2.87E18.61E3 | 4.97E23.89E3 | 1.89E11.69E2 | 4.74E12.84E2 | 8.50E+01.70E1 | 4.26E+12.13E+0 | 3.97E+14.76E+0 |
| Mrk 1094 | 6.57E31.97E4 | 1.60E33.47E4 | 5.24E31.20E3 | 1.35E22.60E3 | 6.18E21.28E3 | 9.63E14.92E2 | 7.62E19.61E2 |
| NGC 3310 | 2.00E16.01E3 | 4.76E21.33E2 | 3.93E11.13E1 | 1.19E+03.22E1 | 4.98E+09.99E2 | 3.23E+12.38E+0 | 2.98E+13.58E+0 |
| Mrk 162 | 3.76E31.13E4 | 1.49E34.60E4 | 5.92E31.75E3 | 1.83E25.47E3 | 1.73E13.47E3 | 1.44E+07.26E2 | 1.52E+01.85E1 |
| NGC 1156 | 9.21E22.76E3 | 2.39E27.74E3 | 7.10E22.21E2 | 1.49E14.50E2 | 6.59E11.32E2 | 6.82E+03.43E1 | 3.51E+04.29E1 |
| NGC 5253 | 2.55E17.64E3 | 1.52E13.43E2 | 2.53E15.50E2 | 7.91E11.86E1 | 8.86E+01.77E1 | 2.66E+11.33E+0 | 1.80E+12.17E+0 |
| Tol 2 | 5.72E31.72E4 | 1.64E35.68E4 | 6.73E42.30E4 | 4.71E31.53E3 | 7.58E21.57E3 | 9.35E14.74E2 | 5.31E17.55E2 |
| Minkowski’s Obj. | 5.43E41.75E5 | 1.26E46.31E5 | 3.31E41.68E4 | 1.12E35.47E4 | 3.68E31.80E4 | 3.94E25.76E3 | 2.70E22.65E2 |
| NGC 4449 | 4.93E11.48E2 | 6.34E26.16E3 | 4.30E14.09E2 | 1.31E+01.22E1 | 3.25E+06.52E2 | 4.02E+12.01E+0 | 7.60E+19.12E+0 |
| NGC 7714 | 4.97E21.49E3 | 9.28E37.44E4 | 7.78E26.37E3 | 2.74E12.29E2 | 2.36E+04.71E2 | 9.73E+04.88E1 | 7.48E+08.99E1 |
| UGC 4703 | 1.92E35.77E5 | 3.94E43.23E5 | 2.36E31.81E4 | 7.99E36.11E4 | 2.75E25.77E4 | 2.25E11.56E2 | 3.27E14.60E2 |
| NGC 1140 | 2.99E28.97E4 | 6.53E31.36E3 | 2.93E25.82E3 | 8.42E21.80E2 | 3.87E17.80E3 | 3.43E+01.72E1 | 4.05E+04.87E1 |
| NGC 1510 | 8.45E32.54E4 | 4.62E3 | 4.50E31.15E3 | 1.69E24.27E3 | 1.32E12.64E3 | 1.16E+05.85E2 | 9.19E11.15E1 |
| NGC 3125 | 2.49E27.49E4 | 5.43E35.89E4 | 2.46E22.40E3 | 7.61E28.60E3 | 7.07E11.42E2 | 5.55E+02.78E1 | 4.44E+05.49E1 |
| NGC 4214 | 3.12E19.37E3 | 5.25E29.36E3 | 2.58E14.46E2 | 4.82E18.96E2 | 1.96E+03.94E2 | 2.04E+11.02E+0 | 2.34E+12.82E+0 |
| NGC 4670 | 2.90E28.69E4 | 4.37E35.44E4 | 2.12E22.63E3 | 6.08E28.96E3 | 2.87E16.05E3 | 3.47E+01.74E1 | 4.00E+04.81E1 |
| NGC 2537 | 8.08E22.43E3 | 9.29E36.42E4 | 3.91E22.70E3 | 1.24E11.11E2 | 2.96E16.04E3 | 4.04E+02.03E1 | 5.85E+07.03E1 |
| He 2-10 | 9.74E22.92E3 | 2.30E22.11E3 | 2.00E12.09E2 | 6.58E16.68E2 | 5.68E+01.14E1 | 1.94E+19.69E1 | 1.55E+11.86E+0 |
| NGC 3628 | 1.09E+03.26E2 | 6.59E27.09E3 | 9.90E11.09E1 | 2.94E+02.53E1 | 6.96E+01.39E1 | 7.71E+16.67E+0 | 1.47E+21.77E+1 |
| NGC 3079 | 5.61E11.68E2 | 1.04E11.15E2 | 8.88E19.70E2 | 2.34E+02.56E1 | 2.98E+06.00E2 | 6.37E+13.19E+0 | 9.13E+11.10E+1 |
| NGC 2782 | 1.15E13.44E3 | 3.06E23.33E3 | 1.02E19.70E3 | 4.44E14.87E2 | 1.17E+02.33E2 | 1.03E+15.16E1 | 1.15E+11.42E+0 |
| NGC 3077 | 4.96E11.49E2 | 1.21E11.55E2 | 2.11E12.69E2 | 8.99E11.25E1 | 1.78E+03.60E2 | 2.01E+11.01E+0 | 1.73E+12.08E+0 |
| NGC 3367 | 1.15E13.44E3 | 1.42E28.04E4 | 1.12E16.05E3 | 3.79E11.98E2 | 1.32E+02.64E2 | 7.77E+03.89E1 | 1.38E+11.66E+0 |
| NGC 5236 | 3.56E+01.07E1 | 6.96E21.03E2 | 9.35E+01.58E+0 | 2.00E+13.02E+0 | 4.21E+18.40E1 | 3.12E+21.56E+1 | 8.48E+21.02E+2 |
| NGC 5953 | 8.72E22.62E3 | 1.62E22.04E3 | 1.29E11.72E2 | 4.12E15.63E2 | 7.34E11.47E2 | 9.18E+04.59E1 | 1.57E+11.88E+0 |
| NGC 4194 | 9.48E22.84E3 | 4.02E21.32E2 | 2.91E19.31E2 | 7.21E12.41E1 | 4.07E+08.15E2 | 1.91E+19.53E1 | 1.33E+11.59E+0 |
| NGC 2903 | 1.13E+03.39E2 | 6.42E24.71E3 | 1.06E+07.96E2 | 4.04E+02.94E1 | 9.65E+01.93E1 | 7.64E+13.83E+0 | 1.56E+22.03E+1 |
| NGC 2146 | 9.53E12.86E2 | 2.89E17.89E2 | 2.52E+06.68E1 | 9.17E+02.42E+0 | 1.70E+13.41E1 | 1.46E+27.29E+0 | 1.12E+21.35E+1 |
| Mrk 25 | 1.04E23.11E4 | 1.23E35.24E5 | 1.16E25.34E4 | 4.16E21.80E3 | 2.21E14.42E3 | 1.37E+06.92E2 | 1.03E+01.28E1 |
| NGC 1614 | 1.03E13.09E3 | 3.10E28.46E3 | 2.58E16.92E2 | 8.66E12.36E1 | 5.89E+01.18E1 | 2.48E+11.24E+0 | 1.71E+12.05E+0 |
| NGC 3256 | 2.54E17.63E3 | 1.44E11.65E2 | 8.98E11.02E1 | 2.68E+03.42E1 | 1.26E+12.52E1 | 8.73E+14.37E+0 | 5.94E+17.13E+0 |
| Mrk 331 | 4.81E21.44E3 | 1.13E28.75E4 | 1.20E11.01E2 | 4.44E13.83E2 | 2.02E+04.05E2 | 1.48E+17.41E1 | 1.32E+11.59E+0 |
| IC 342 | 8.79E+02.64E1 | 3.06E+0 | 6.29E+01.60E+0 | 2.70E+16.48E+0 | 3.86E+17.76E1 | 4.04E+22.02E+1 | 8.78E+21.05E+2 |
| arom.(8µm) bbThe 8 µm aromatic feature is the sum of the 7.7, 8.3, and 8.6 µm blends. | unc. | [Ne II] | unc. | [Ne III] | unc. | [S III](18µm) | unc. | [S IV] | unc. | |
|---|---|---|---|---|---|---|---|---|---|---|
| Galaxy | (EW) | (EW) | (flux) | (flux) | (flux) | (flux) | (flux) | (flux) | (flux) | (flux) |
| I Zw 18 | 7.11E1 | 3.07E1 | 9.76E4 | 2.61E4 | 7.73E3 | 9.22E4 | 5.25E3 | 8.51E4 | 4.31E3 | 4.29E4 |
| SBS 0335-052E | 2.41E1 | 2.20E2 | 3.24E3 | 3.41E4 | 1.21E2 | 1.62E3 | 4.66E3 | 1.67E3 | 1.71E2 | 9.52E4 |
| UM 462 | 1.59E+0 | 3.33E1 | 1.12E2 | 1.01E3 | 1.11E1 | 5.69E3 | 5.11E2 | 2.86E3 | 6.38E2 | 3.38E3 |
| Haro 11 | 1.34E+0 | 1.16E1 | 3.29E1 | 1.66E2 | 1.27E+0 | 6.35E2 | 5.94E1 | 3.03E2 | 5.82E1 | 2.92E2 |
| UGC 4393 | 7.61E+0 | 6.82E1 | 4.78E2 | 2.82E3 | 4.38E2 | 2.95E3 | 3.05E2 | 3.14E3 | 1.64E2 | 1.54E3 |
| POX 4 | 8.31E1 | 7.59E2 | 9.48E3 | 6.81E4 | 1.62E1 | 8.17E3 | 5.18E2 | 2.78E3 | 1.93E1 | 9.67E3 |
| UM 420 | 2.02E+0 | 1.71E1 | 2.51E2 | 2.28E3 | 6.38E2 | 4.07E3 | 5.22E2 | 4.84E3 | 4.91E2 | 4.29E3 |
| Mrk 1450 | 1.31E+0 | 2.06E1 | 1.34E2 | 1.04E3 | 1.05E1 | 5.64E3 | 5.65E2 | 3.37E3 | 6.87E2 | 4.11E3 |
| Tol 2138-405 | 8.56E1 | 2.93E1 | 6.49E3 | 5.77E3 | 2.31E2 | 2.58E3 | 5.88E3 | 2.91E3 | 5.76E2 | 9.57E3 |
| NGC 4861 | 3.23E2 | 5.05E3 | 1.45E1 | 7.67E3 | 1.01E1 | 5.90E3 | 2.14E1 | 1.53E2 | ||
| Mrk 206 | 3.60E+0 | 3.24E1 | 1.43E1 | 7.77E3 | 1.59E1 | 8.47E3 | 1.51E1 | 7.91E3 | 6.31E2 | 5.31E3 |
| UM 448 | 5.58E+0 | 4.48E1 | 3.33E1 | 1.68E2 | 5.88E1 | 2.95E2 | 3.48E1 | 1.78E2 | 1.84E1 | 9.52E3 |
| SHOC 391 | 9.28E3 | 1.49E3 | 3.64E1 | 1.83E2 | 9.79E2 | 5.08E3 | 2.81E1 | 1.41E2 | ||
| II Zw 40 | 1.11E+0 | 9.49E2 | 6.55E2 | 3.86E3 | 1.48E+0 | 7.41E2 | 6.13E1 | 3.08E2 | 1.59E+0 | 7.96E2 |
| Mrk 930 | 3.48E+0 | 3.82E1 | 5.05E2 | 2.87E3 | 2.02E1 | 1.02E2 | 8.83E2 | 4.91E3 | 1.13E1 | 5.91E3 |
| NGC 1569 | 1.87E+0 | 1.93E1 | 3.21E1 | 1.80E2 | 3.07E+0 | 1.54E1 | 1.37E+0 | 6.98E2 | 1.60E+0 | 8.05E2 |
| NGC 3310 | 6.80E+0 | 5.49E1 | 5.46E1 | 2.74E2 | 6.41E1 | 3.22E2 | 6.00E1 | 3.03E2 | 1.60E1 | 8.16E3 |
| NGC 1156 | 8.94E2 | 5.80E3 | 1.36E1 | 7.99E3 | 1.94E2 | 3.73E3 | ||||
| Mrk 162 | 1.22E+0 | 1.02E1 | 3.66E2 | 2.05E3 | 1.80E1 | 9.32E3 | 6.82E2 | 4.24E3 | 7.67E2 | 3.98E3 |
| NGC 5253 | 8.37E+0 | 6.77E1 | 1.21E+4 | 6.07E+2 | 4.43E+2 | 5.00E+1 | 5.88E+3 | 3.00E+2 | 5.04E+2 | 3.63E+1 |
| Tol 2 | 3.62E+0 | 9.89E1 | 1.91E2 | 1.64E3 | 1.02E1 | 5.22E3 | 7.29E2 | 3.86E3 | 3.82E2 | 2.70E3 |
| NGC 4449 | 2.71E+0 | 2.24E1 | 1.63E1 | 8.30E3 | 2.79E1 | 1.40E2 | 2.38E1 | 1.20E2 | 7.19E2 | 3.95E3 |
| NGC 7714 | 3.93E+0 | 3.27E1 | 9.72E1 | 4.87E2 | 6.13E1 | 3.10E2 | 1.01E+0 | 5.06E2 | 1.92E1 | 9.74E3 |
| NGC 1140 | 3.49E+0 | 2.75E1 | 1.53E1 | 7.76E3 | 4.86E1 | 2.44E2 | 2.75E1 | 1.40E2 | 1.68E1 | 8.53E3 |
| NGC 3125 | 2.58E+0 | 2.10E1 | 1.52E1 | 7.85E3 | 8.11E1 | 4.07E2 | 5.45E1 | 2.76E2 | 5.53E1 | 2.78E2 |
| NGC 4214 | 9.13E+0 | 9.41E1 | 8.09E2 | 4.50E3 | 7.68E2 | 4.69E3 | 5.31E2 | 3.92E3 | 1.20E1 | 6.66E3 |
| NGC 4670 | 8.50E1 | 8.98E2 | 7.47E2 | 3.90E3 | 1.45E1 | 7.30E3 | 1.37E1 | 6.96E3 | 5.02E2 | 2.96E3 |
| He 2-10 | 4.27E+0 | 3.46E1 | 3.84E+0 | 1.92E1 | 1.21E+0 | 6.10E2 | 3.63E+0 | 1.82E1 | 3.66E1 | 1.84E2 |
| NGC 3628 | 4.56E+1 | 3.66E+0 | 3.64E+0 | 1.82E1 | 1.72E1 | 9.54E3 | 6.93E1 | 3.54E2 | ||
| NGC 3079 | 1.98E+1 | 1.46E+0 | 2.44E+0 | 1.22E1 | 4.30E1 | 2.22E2 | 4.69E1 | 2.41E2 | 1.73E1 | 1.06E2 |
| NGC 2782 | 8.47E+0 | 6.68E1 | 9.18E1 | 4.61E2 | 4.84E1 | 2.46E2 | 6.50E1 | 3.28E2 | 9.62E2 | 5.57E3 |
| NGC 3077 | 7.85E+0 | 6.62E1 | 3.90E1 | 1.97E2 | 2.23E1 | 1.13E2 | 6.34E1 | 3.18E2 | 2.75E2 | 2.91E3 |
| NGC 3367 | 2.75E1 | 2.33E2 | 4.23E1 | 2.13E2 | 4.24E2 | 2.46E3 | 1.99E1 | 1.04E2 | 3.82E2 | 2.53E3 |
| NGC 5236 | 8.39E+0 | 6.78E1 | 1.20E+4 | 6.03E+2 | 4.41E+2 | 4.94E+1 | 5.91E+3 | 3.01E+2 | 5.12E+2 | 3.63E+1 |
| NGC 5953 | 7.01E+0 | 5.44E1 | 1.06E+0 | 5.30E2 | 2.45E1 | 1.24E2 | 4.10E1 | 2.07E2 | 9.96E2 | 5.48E3 |
| NGC 4194 | 9.49E+0 | 7.69E1 | 2.15E+0 | 1.08E1 | 7.15E1 | 3.61E2 | 1.17E+0 | 5.86E2 | 1.84E1 | 9.43E3 |
| NGC 2903 | 1.14E+1 | 9.32E1 | 2.05E+0 | 1.03E1 | 1.39E1 | 7.42E3 | 6.65E1 | 3.35E2 | 8.90E2 | 4.99E3 |
| NGC 2146 | 2.74E+1 | 2.16E+0 | 1.37E+1 | 6.85E1 | 2.02E+0 | 1.01E1 | 5.23E+0 | 2.62E1 | 6.31E1 | 3.28E2 |
| Mrk 25 | 6.41E+0 | 5.31E1 | 1.44E1 | 7.26E3 | 5.71E2 | 3.14E3 | 1.52E1 | 7.81E3 | 1.84E2 | 1.37E3 |
| NGC 1614 | 7.37E+0 | 5.81E1 | 2.81E+0 | 1.41E1 | 4.71E1 | 2.64E2 | 8.58E1 | 4.45E2 | 1.48E1 | 8.83E3 |
| NGC 3256 | 1.02E+1 | 8.16E1 | 6.44E+0 | 3.22E1 | 8.93E1 | 4.61E2 | 3.04E+0 | 1.52E1 | 2.20E1 | 1.26E2 |
| Mrk 331 | 1.07E+1 | 8.34E1 | 1.44E+0 | 7.21E2 | 1.60E1 | 8.79E3 | 5.34E1 | 2.68E2 | 7.72E2 | 4.46E3 |
| IC 342 | 5.09E+0 | 4.12E1 | 9.12E+0 | 4.56E1 | 7.47E2 | 2.08E2 | 6.13E+0 | 3.09E1 | 2.76E1 | 1.61E2 |
| Galaxy | TIRaa µm luminosity determined using MIPS measurements and the prescription given by Dale & Helou (2002). | unc. | Directbb µm luminosity integrated directly as described in § 3.2. | unc. |
|---|---|---|---|---|
| (L☉) | (L☉) | (L☉) | (L☉) | |
| SBS 0335-052W | 1.204e+08 | 9.788e+07 | ||
| I Zw 18 | 1.685e+07 | 8.754e+06 | 1.502e+07 | 6.457e+06 |
| SBS 0335-052E | 1.840e+09 | 7.857e+08 | 1.992e+09 | 8.468e+08 |
| UGCA 292 | 4.841e+05 | 2.751e+08 | 5.439e+05 | 3.619e+08 |
| SHOC 567 | 1.037e+09 | 4.481e+08 | 1.119e+09 | 4.778e+08 |
| HS 0822+3542 | 1.071e+07 | 5.325e+06 | 1.056e+07 | 4.573e+06 |
| ESO 489-G56 | 0.000e+00 | 0.000e+00 | 1.116e+05 | 2.374e+04 |
| Tol 1214-277 | 1.226e+09 | 5.939e+08 | 1.165e+09 | 5.017e+08 |
| UGC 4483 | 2.245e+06 | 4.653e+05 | 2.757e+06 | 4.987e+05 |
| Tol 65 | 1.991e+08 | 9.212e+07 | 1.736e+08 | 7.401e+07 |
| KUG 1013+381 | 1.161e+08 | 5.242e+07 | 1.180e+08 | 5.031e+07 |
| SBS 1102+606 | 5.142e+07 | 2.546e+07 | 5.483e+07 | 2.379e+07 |
| ESO 146-G14 | 1.463e+08 | 6.500e+07 | 1.551e+08 | 6.682e+07 |
| Tol 0618-402 | 1.254e+09 | 1.184e+09 | 3.031e+08 | 1.928e+08 |
| VII Zw 403 | 1.795e+07 | 3.164e+06 | 2.224e+07 | 3.873e+06 |
| DDO 187 | 2.539e+05 | 1.434e+05 | 1.048e+05 | 1.794e+04 |
| UM 461 | 7.167e+07 | 3.060e+07 | 8.316e+07 | 3.540e+07 |
| Mrk 178 | 6.856e+06 | 2.972e+06 | 8.746e+06 | 3.761e+06 |
| Mrk 153 | 9.180e+08 | 3.923e+08 | 1.098e+09 | 4.675e+08 |
| UM 462 | 4.055e+08 | 1.722e+08 | 4.816e+08 | 2.043e+08 |
| Haro 11 | 1.670e+11 | 7.095e+10 | 1.859e+11 | 7.897e+10 |
| UGC 4393 | 5.653e+09 | 2.444e+09 | 5.099e+09 | 2.174e+09 |
| POX 4 | 4.876e+09 | 2.073e+09 | 5.578e+09 | 2.369e+09 |
| UM 420 | 0.000e+00 | 0.000e+00 | ||
| Mrk 1450 | 3.184e+08 | 1.353e+08 | 3.742e+08 | 1.588e+08 |
| Tol 2138-405 | 4.199e+10 | 1.789e+10 | 4.314e+10 | 1.834e+10 |
| NGC 4861 | 1.336e+09 | 5.688e+08 | 1.515e+09 | 6.439e+08 |
| Mrk 206 | 2.237e+09 | 9.522e+08 | 2.658e+09 | 1.130e+09 |
| UM 448 | 7.990e+10 | 3.402e+10 | 9.462e+10 | 4.023e+10 |
| SHOC 391 | 3.372e+10 | 1.433e+10 | 3.813e+10 | 1.621e+10 |
| Mrk 170 | 3.853e+08 | 1.647e+08 | 4.517e+08 | 1.920e+08 |
| II Zw 40 | 1.542e+09 | 6.557e+08 | 1.716e+09 | 7.291e+08 |
| Mrk 930 | 1.697e+10 | 7.224e+09 | 1.998e+10 | 8.496e+09 |
| NGC 1569 | 4.653e+08 | 1.705e+08 | 5.091e+08 | 1.861e+08 |
| Mrk 1094 | 3.314e+09 | 1.413e+09 | 4.080e+09 | 1.734e+09 |
| NGC 3310 | 4.009e+10 | 1.713e+10 | 4.783e+10 | 2.040e+10 |
| Mrk 162 | 3.609e+10 | 1.540e+10 | 4.050e+10 | 1.723e+10 |
| NGC 1156 | 8.480e+08 | 3.090e+08 | 1.109e+09 | 4.034e+08 |
| NGC 5253 | 1.554e+09 | 2.233e+08 | 1.735e+09 | 2.482e+08 |
| Tol 2 | 2.678e+08 | 1.142e+08 | 3.299e+08 | 1.403e+08 |
| Minkowski’s Obj. | 5.158e+08 | 2.577e+08 | 6.598e+08 | 2.904e+08 |
| NGC 4449 | 2.178e+09 | 3.982e+08 | 2.343e+09 | 4.096e+08 |
| NGC 7714 | 4.893e+10 | 2.081e+10 | 5.553e+10 | 2.359e+10 |
| UGC 4703 | 2.195e+09 | 9.411e+08 | 2.463e+09 | 1.049e+09 |
| NGC 1140 | 4.146e+09 | 1.773e+09 | 4.741e+09 | 2.019e+09 |
| NGC 1510 | 3.837e+08 | 1.640e+08 | 4.562e+08 | 1.945e+08 |
| NGC 3125 | 1.972e+09 | 8.404e+08 | 2.298e+09 | 9.772e+08 |
| NGC 4214 | 4.390e+08 | 7.791e+07 | 5.125e+08 | 8.878e+07 |
| NGC 4670 | 4.630e+09 | 1.981e+09 | 5.305e+09 | 2.260e+09 |
| NGC 2537 | 5.124e+08 | 1.809e+08 | 5.846e+08 | 2.045e+08 |
| He 2-10 | 5.495e+09 | 2.337e+09 | 6.155e+09 | 2.615e+09 |
| NGC 3628 | 4.160e+10 | 1.786e+10 | 4.501e+10 | 1.919e+10 |
| NGC 3079 | 7.521e+10 | 3.218e+10 | 8.910e+10 | 3.785e+10 |
| NGC 2782 | 4.728e+10 | 2.017e+10 | 5.697e+10 | 2.420e+10 |
| NGC 3077 | 6.611e+08 | 1.168e+08 | 8.589e+08 | 1.491e+08 |
| NGC 3367 | 6.666e+10 | 2.849e+10 | 7.265e+10 | 3.089e+10 |
| NGC 5236 | 2.581e+10 | 4.036e+09 | 2.697e+10 | 3.923e+09 |
| NGC 5953 | 3.207e+10 | 1.375e+10 | 3.635e+10 | 1.548e+10 |
| NGC 4194 | 9.966e+10 | 4.239e+10 | 1.194e+11 | 5.078e+10 |
| NGC 2903 | 2.105e+10 | 7.484e+09 | 2.274e+10 | 7.983e+09 |
| NGC 2146 | 1.110e+11 | 4.727e+10 | 1.487e+11 | 6.331e+10 |
| Mrk 25 | 8.399e+09 | 3.576e+09 | 1.005e+10 | 4.272e+09 |
| NGC 1614 | 2.920e+11 | 1.242e+11 | 3.409e+11 | 1.449e+11 |
| NGC 3256 | 3.169e+11 | 1.350e+11 | 3.904e+11 | 1.661e+11 |
| Mrk 331 | 2.334e+11 | 9.945e+10 | 2.773e+11 | 1.179e+11 |
| IC 342 | 1.494e+10 | 2.322e+09 | 1.673e+10 | 2.444e+09 |
Note. — The uncertainties are propagated from the photometric uncertainties.
| Galaxy | unc. | ref. | |
|---|---|---|---|
| (erg/s/cm2) | |||
| SBS 0335-052W | |||
| I Zw 18 | -12.49aaIncludes [N II] | 1 | |
| SBS 0335-052E | -12.49 | 0.01 | 2 |
| UGCA 292 | -12.70aaIncludes [N II] | 0.01 | 3 |
| SHOC 567 | |||
| HS 0822+3542 | -13.1aaIncludes [N II] | 0.05 | 4 |
| ESO 489-G56 | |||
| Tol 1214-277 | |||
| UGC 4483 | -12.4aaIncludes [N II] | 0.05 | 4 |
| Tol 65 | -12.6aaIncludes [N II] | 0.02 | 4 |
| KUG 1013+381 | |||
| SBS 1102+606 | |||
| ESO 146-G14 | |||
| Tol 0618-402 | |||
| VII Zw 403 | -10.71aaIncludes [N II] | 1 | |
| DDO 187 | |||
| UM 461 | |||
| Mrk 178 | |||
| Mrk 153 | |||
| UM 462 | |||
| Haro 11 | -11.57 | 0.04 | 5 |
| UGC 4393 | -12.24aaIncludes [N II] | 0.06 | 6 |
| POX 4 | -12.0aaIncludes [N II] | 0.04 | 4 |
| UM 420 | |||
| Mrk 1450 | -12.4aaIncludes [N II] | 0.04 | 4 |
| Tol 2138-405 | |||
| NGC 4861 | -11.70 | 0.04 | 5 |
| Mrk 206 | |||
| UM 448 | |||
| SHOC 391 | -11.16 | 0.01 | 7 |
| Mrk 170 | |||
| II Zw 40 | -10.81aaIncludes [N II] | 0.03 | 4 |
| Mrk 930 | |||
| NGC 1569 | -10.82 | 0.04 | 5 |
| Mrk 1094 | -12.0aaIncludes [N II] | 0.04 | 4 |
| NGC 3310 | -10.79aaIncludes [N II] | 0.04 | 6 |
| Mrk 162 | |||
| NGC 1156 | -11.56aaIncludes [N II] | 0.04 | 6 |
| NGC 5253 | -10.7aaIncludes [N II] | 8 | |
| Tol 2 | -11.92aaIncludes [N II] | 0.01 | 4 |
| Minkowski’s Obj. | -13.07aaIncludes [N II] | 9 | |
| NGC 4449 | -10.69aaIncludes [N II] | 1 | |
| NGC 7714 | -11.55 | 0.04 | 5 |
| UGC 4703 | |||
| NGC 1140 | |||
| NGC 1510 | |||
| NGC 3125 | -11.47aaIncludes [N II] | 0.01 | 4 |
| NGC 4214 | -11.09 | 0.04 | 5 |
| NGC 4670 | -11.66aaIncludes [N II] | 0.04 | 4 |
| NGC 2537 | -11.61aaIncludes [N II] | 0.04 | 6 |
| He 2-10 | -11.46aaIncludes [N II] | 1 | |
| NGC 3628 | -11.72aaIncludes [N II] | 10 | |
| NGC 3079 | |||
| NGC 2782 | |||
| NGC 3077 | -11.2aaIncludes [N II] | 0.04 | 11 |
| NGC 3367 | |||
| NGC 5236 | -10.12 | 0.08 | 12 |
| NGC 5953 | -11.8aaIncludes [N II] | 0.04 | 11 |
| NGC 4194 | -11.58aaIncludes [N II] | 0.11 | 13 |
| NGC 2903 | -10.86 | 0.11 | 14 |
| NGC 2146 | -11.29aaIncludes [N II] | 0.04 | 6 |
| Mrk 25 | |||
| NGC 1614 | -11.97 | 0.04 | 5 |
| NGC 3256 | |||
| Mrk 331 | |||
| IC 342 |
References. — (1) Ott et al. (2005); (2) Pustilnik et al. (2004); (3) van Zee (2000); (4) Gil de Paz et al. (2003); (5) Schmitt et al. (2006); (6) James et al. (2004); (7) Thuan & Izotov (2005); (8) Lehnert & Heckman (1995); (9) Croft et al. (2006); (10) Fabbiano et al. (1990); (11) Kennicutt et al. (1987); (12) Meurer et al. (2006); (13) Hattori et al. (2004); (14) Hoopes et al. (2001).
| Galaxy | T24/70 | unc. | T70/160 | unc. | T100/160 | unc. |
|---|---|---|---|---|---|---|
| (K) | (K) | (K) | (K) | (K) | (K) | |
| SBS 0335-052W | ||||||
| I Zw 18 | 56.5 | 0.8 | ||||
| SBS 0335-052E | 81.1 | 1.4 | ||||
| UGCA 292 | 44.0 | 1.9 | ||||
| SHOC 567 | 47.1 | 0.4 | 24.4 | 0.6 | ||
| HS 0822+3542 | 52.2 | 0.7 | ||||
| ESO 489-G56 | ||||||
| Tol 1214-277 | 56.5 | 0.9 | ||||
| UGC 4483 | 49.0 | 0.3 | 30.7 | 3.8 | ||
| Tol 65 | 69.7 | 1.7 | ||||
| KUG 1013+381 | 58.0 | 0.6 | ||||
| SBS 1102+606 | 48.6 | 0.6 | ||||
| ESO 146-G14 | 45.5 | 0.5 | 25.2 | 1.3 | ||
| Tol 0618-402 | 48.6 | 7.8 | ||||
| VII Zw 403 | 51.0 | 0.3 | 34.2 | 1.1 | 62.3 | 5.8 |
| DDO 187 | ||||||
| UM 461 | 59.2 | 0.5 | 42.4 | 9.8 | ||
| Mrk 178 | 41.6 | 0.2 | 31.5 | 1.2 | ||
| Mrk 153 | 53.3 | 0.3 | 32.6 | 1.3 | 56.5 | 8.3 |
| UM 462 | 53.3 | 0.3 | 32.6 | 0.9 | 28.7 | 1.4 |
| Haro 11 | 64.7 | 0.4 | 37.3 | 1.0 | 38.5 | 2.1 |
| UGC 4393 | 50.6 | 0.3 | 20.9 | 0.4 | ||
| POX4 | 57.6 | 0.3 | 34.6 | 1.1 | ||
| UM 420 | ||||||
| Mrk 1450 | 56.5 | 0.3 | 36.5 | 1.4 | 86.5 | 11.8 |
| Tol 2138-405 | 63.1 | 0.5 | 29.1 | 1.1 | 71.7 | 11.7 |
| NGC 4861 | 55.7 | 0.3 | 30.7 | 0.7 | 28.7 | 1.4 |
| Mrk 206 | 56.1 | 0.3 | 30.7 | 0.7 | ||
| UM 448 | 55.3 | 0.3 | 31.1 | 0.8 | 29.1 | 1.4 |
| SHOC 391 | 69.3 | 0.5 | 37.3 | 1.4 | ||
| Mrk 170 | 47.9 | 0.2 | 27.2 | 0.6 | 25.6 | 1.2 |
| II Zw 40 | 60.4 | 0.3 | 33.4 | 1.0 | 33.0 | 2.0 |
| Mrk 930 | 55.7 | 0.3 | 34.2 | 0.9 | 66.6 | 5.3 |
| NGC 1569 | 57.2 | 0.3 | 28.7 | 0.7 | 25.6 | 1.1 |
| Mrk 1094 | 49.0 | 0.2 | 30.3 | 0.8 | ||
| NGC 3310 | 55.3 | 0.4 | 28.7 | 0.7 | 26.8 | 1.2 |
| Mrk 162 | 53.3 | 0.3 | 28.0 | 0.6 | ||
| NGC 1156 | 51.8 | 0.3 | 34.6 | 0.9 | 44.4 | 2.7 |
| NGC 5253 | 61.5 | 0.3 | 31.5 | 0.8 | 30.3 | 1.5 |
| Tol 2 | 50.6 | 0.2 | 33.4 | 1.0 | 24.1 | 1.2 |
| Minkowski’s Obj. | 51.8 | 0.8 | 31.5 | 9.0 | ||
| NGC 4449 | 50.6 | 0.2 | 24.1 | 0.5 | 22.9 | 0.9 |
| NGC 7714 | 58.8 | 0.3 | 30.3 | 0.7 | 29.5 | 1.4 |
| UGC 4703 | 53.3 | 0.4 | 25.6 | 0.6 | ||
| NGC 1140 | 52.9 | 0.3 | 27.2 | 0.6 | 25.6 | 1.1 |
| NGC 1510 | 52.9 | 0.3 | 30.3 | 0.7 | ||
| NGC 3125 | 53.7 | 0.3 | 29.9 | 0.7 | 25.2 | 1.1 |
| NGC 4214 | 51.8 | 0.3 | 27.2 | 0.6 | 26.0 | 1.1 |
| NGC 4670 | 51.0 | 0.2 | 27.2 | 0.6 | 24.8 | 1.0 |
| NGC 2537 | 50.2 | 0.2 | 25.6 | 0.5 | 24.4 | 1.0 |
| He 2-10 | 60.4 | 0.3 | 29.9 | 0.7 | 31.5 | 1.6 |
| NGC 3628 | 51.4 | 0.4 | 24.1 | 0.5 | 21.7 | 0.8 |
| NGC 3079 | 47.5 | 0.2 | 25.6 | 0.6 | 23.3 | 0.9 |
| NGC 2782 | 52.9 | 0.3 | 27.6 | 0.6 | 26.4 | 1.2 |
| NGC 3077 | 51.4 | 0.2 | 29.5 | 0.7 | 29.1 | 1.4 |
| NGC 3367 | 56.1 | 0.3 | 24.4 | 0.5 | 22.5 | 0.9 |
| NGC 5236 | 54.1 | 0.3 | 22.5 | 0.4 | 20.5 | 0.8 |
| NGC 5953 | 50.6 | 0.2 | 24.8 | 0.5 | 25.6 | 1.1 |
| NGC 4194 | 57.6 | 0.3 | 31.5 | 0.8 | 34.6 | 1.8 |
| NGC 2903 | 53.7 | 0.3 | 23.7 | 0.5 | 22.9 | 1.0 |
| NGC 2146 | 52.9 | 0.3 | 30.3 | 0.7 | 30.7 | 1.5 |
| Mrk 25 | 55.7 | 0.3 | 30.7 | 0.8 | 29.5 | 1.5 |
| NGC 1614 | 58.8 | 0.3 | 31.5 | 0.7 | 33.8 | 1.7 |
| NGC 3256 | 54.5 | 0.3 | 31.5 | 0.8 | 34.2 | 1.8 |
| Mrk 331 | 54.1 | 0.3 | 29.1 | 0.7 | 30.7 | 1.5 |
| IC 342 | 51.8 | 0.3 | 23.3 | 0.5 | 20.5 | 0.7 |
.
Note. — A wavelength-dependent emissivity, , of -2 was used in all cases. The uncertainties were derived by propagating the photometric uncertainties via a Monte Carlo technique (cf. § 4.3)
| Galaxy | Mdust | unc. |
|---|---|---|
| (M☉) | (M☉) | |
| I Zw 18 | 2.0e+04 | 9.1e+03 |
| SBS 0335-052E | 1.8e+05 | 8.0e+04 |
| UGCA 292 | 3.4e+02 | 3.2e+05 |
| SHOC 567 | 9.2e+05 | 4.5e+05 |
| HS 0822+3542 | 7.4e+03 | 3.3e+03 |
| Tol 1214-277 | 8.5e+05 | 3.8e+05 |
| UGC 4483 | 5.1e+02 | 5.5e+02 |
| Tol 65 | 1.8e+05 | 8.3e+04 |
| KUG 1013+381 | 3.6e+04 | 1.5e+04 |
| SBS 1102+606 | 2.7e+04 | 1.2e+04 |
| ESO 146-G14 | 1.1e+05 | 7.2e+04 |
| Tol 0618-402 | 2.8e+07 | 2.5e+07 |
| VII Zw 403 | 2.1e+03 | 5.6e+02 |
| UM 461 | 1.9e+03 | 2.9e+03 |
| Mrk 178 | 1.6e+03 | 8.1e+02 |
| Mrk 153 | 1.3e+05 | 6.4e+04 |
| UM 462 | 5.6e+04 | 2.6e+04 |
| Haro 11 | 5.8e+06 | 2.7e+06 |
| UGC 4393 | 1.2e+07 | 5.9e+06 |
| POX 4 | 3.9e+05 | 1.8e+05 |
| Mrk 1450 | 2.1e+04 | 1.0e+04 |
| Tol 2138-405 | 6.6e+06 | 3.4e+06 |
| NGC 4861 | 2.3e+05 | 1.1e+05 |
| Mrk 206 | 3.8e+05 | 1.8e+05 |
| UM 448 | 1.3e+07 | 6.0e+06 |
| SHOC 391 | 8.6e+05 | 4.1e+05 |
| Mrk 170 | 1.8e+05 | 8.5e+04 |
| II Zw 40 | 1.3e+05 | 5.9e+04 |
| Mrk 930 | 1.6e+06 | 7.5e+05 |
| NGC 1569 | 1.1e+05 | 4.5e+04 |
| Mrk 1094 | 8.0e+05 | 3.7e+05 |
| NGC 3310 | 1.1e+07 | 4.9e+06 |
| Mrk 162 | 1.2e+07 | 5.5e+06 |
| NGC 1156 | 9.1e+04 | 3.6e+04 |
| NGC 5253 | 1.7e+05 | 3.7e+04 |
| Tol 2 | 3.6e+04 | 1.7e+04 |
| Minkowski’s Obj. | 9.3e+04 | 3.0e+05 |
| NGC 4449 | 2.0e+06 | 5.0e+05 |
| NGC 7714 | 7.8e+06 | 3.6e+06 |
| UGC 4703 | 1.3e+06 | 6.0e+05 |
| NGC 1140 | 1.6e+06 | 7.6e+05 |
| NGC 1510 | 8.1e+04 | 3.7e+04 |
| NGC 3125 | 4.4e+05 | 2.0e+05 |
| NGC 4214 | 1.8e+05 | 4.6e+04 |
| NGC 4670 | 2.0e+06 | 9.2e+05 |
| NGC 2537 | 3.3e+05 | 1.3e+05 |
| He 2-10 | 8.6e+05 | 4.0e+05 |
| NGC 3628 | 3.7e+07 | 1.7e+07 |
| NGC 3079 | 5.1e+07 | 2.4e+07 |
| NGC 2782 | 1.7e+07 | 8.0e+06 |
| NGC 3077 | 1.7e+05 | 4.3e+04 |
| NGC 3367 | 4.7e+07 | 2.2e+07 |
| NGC 5236 | 3.2e+07 | 7.4e+06 |
| NGC 5953 | 2.4e+07 | 1.1e+07 |
| NGC 4194 | 1.3e+07 | 6.1e+06 |
| NGC 2903 | 1.9e+07 | 7.8e+06 |
| NGC 2146 | 2.3e+07 | 1.1e+07 |
| Mrk 25 | 1.5e+06 | 6.7e+05 |
| NGC 1614 | 3.7e+07 | 1.7e+07 |
| NGC 3256 | 5.0e+07 | 2.3e+07 |
| Mrk 331 | 5.9e+07 | 2.7e+07 |
| IC 342 | 1.6e+07 | 3.8e+06 |
Note. — Masses and uncertainties are derived as described in § 4.4.
| Galaxy | HI Mass | unc. | ref. |
|---|---|---|---|
| (M☉) | |||
| SBS 0335-052W | |||
| I Zw 18 | 1.03e8aadata from Paturel et al. (2003), converted to mass according to Pustilnik & Martin (2007) | 2.62e7 | |
| SBS 0335-052E | 9.71e8aadata from Paturel et al. (2003), converted to mass according to Pustilnik & Martin (2007) | 2.91e8 | |
| UGCA 292 | 5.09e7 | 1 | |
| SHOC 567 | |||
| HS 0822+3542 | |||
| ESO 489-G56 | |||
| Tol 1214-277 | 2 | ||
| UGC 4483 | 3.72e7 | 3 | |
| Tol 65 | 6.61e8 | 2 | |
| KUG 1013+381 | |||
| SBS 1102+606 | |||
| ESO 146-G14 | |||
| Tol 0618-402 | |||
| VII Zw 403 | 5.69e7aadata from Paturel et al. (2003), converted to mass according to Pustilnik & Martin (2007) | 1.27e7 | |
| DDO 187 | 5.8e8 | 4 | |
| UM 461 | 1.23e8aadata from Paturel et al. (2003), converted to mass according to Pustilnik & Martin (2007) | 2.86e7 | |
| Mrk 178 | |||
| Mrk 153 | 5.3e8 | 5 | |
| UM 462 | 2.17e8aadata from Paturel et al. (2003), converted to mass according to Pustilnik & Martin (2007) | 5.05e7 | |
| Haro 11 | |||
| UGC 4393 | |||
| POX 4 | |||
| UM 420 | |||
| Mrk 1450 | 2.0e7 | 6 | |
| Tol 2138-405 | |||
| NGC 4861 | 1.14e9 | 7 | |
| Mrk 206 | |||
| UM 448 | 7.99e9aadata from Paturel et al. (2003), converted to mass according to Pustilnik & Martin (2007) | 2.48e9 | |
| SHOC 391 | |||
| Mrk 170 | 4.76e8aadata from Paturel et al. (2003), converted to mass according to Pustilnik & Martin (2007) | 1.19e8 | |
| II Zw 40 | 4.38e8 | 3 | |
| Mrk 930 | 3.20e9aadata from Paturel et al. (2003), converted to mass according to Pustilnik & Martin (2007) | 9.37e8 | |
| NGC 1569 | 1.12e8 | 4 | |
| Mrk 1094 | |||
| NGC 3310 | 4.90e9 | 8 | |
| Mrk 162 | |||
| NGC 1156 | 1.07e9 | 4 | |
| NGC 5253 | 1.26e8aadata from Paturel et al. (2003), converted to mass according to Pustilnik & Martin (2007) | 4.41e7 | |
| Tol 2 | 1.83e8aadata from Paturel et al. (2003), converted to mass according to Pustilnik & Martin (2007) | 3.52e7 | |
| Minkowski’s Obj. | 4.9e8 | 9 | |
| NGC 4449 | 1.24e9 | 4 | |
| NGC 7714 | 8.13e9 | 8 | |
| UGC 4703 | |||
| NGC 1140 | 2.84e9aadata from Paturel et al. (2003), converted to mass according to Pustilnik & Martin (2007) | 7.53e8 | |
| NGC 1510 | |||
| NGC 3125 | 3.19e8aadata from Paturel et al. (2003), converted to mass according to Pustilnik & Martin (2007) | ||
| NGC 4214 | 8.09e8 | 4 | |
| NGC 4670 | 7.59e8 | 8 | |
| NGC 2537 | 3.72e8 | 8 | |
| He 2-10 | 2.37e8aadata from Paturel et al. (2003), converted to mass according to Pustilnik & Martin (2007) | 5.68e7 | |
| NGC 3628 | 1.3e10 | 8 | |
| NGC 3079 | 2.73e9aadata from Paturel et al. (2003), converted to mass according to Pustilnik & Martin (2007) | 3.93e8 | |
| NGC 2782 | 4.57e9 | 8 | |
| NGC 3077 | 1.05e9 | 4 | |
| NGC 3367 | 7.45e9aadata from Paturel et al. (2003), converted to mass according to Pustilnik & Martin (2007) | 1.51e9 | |
| NGC 5236 | 1.16e9aadata from Paturel et al. (2003), converted to mass according to Pustilnik & Martin (2007) | 4.38e8 | |
| NGC 5953 | 1.45e9 | 8 | |
| NGC 4194 | 2.82e9 | 8 | |
| NGC 2903 | 3.03e9aadata from Paturel et al. (2003), converted to mass according to Pustilnik & Martin (2007) | 1.22e9 | |
| NGC 2146 | 3.89e9aadata from Paturel et al. (2003), converted to mass according to Pustilnik & Martin (2007) | 1.25e9 | |
| Mrk 25 | |||
| NGC 1614 | 3.80e9 | 8 | |
| NGC 3256 | 6.46e9 | 8 | |
| Mrk 331 | 1.48e9aadata from Paturel et al. (2003), converted to mass according to Pustilnik & Martin (2007) | 2.80e8 | |
| IC 342 |