Resonance Raman measurements of carotenoids using light emitting diodes
Abstract
We report on the development of a compact commercial instrument for measuring carotenoids in skin tissue. The instrument uses two light emitting diodes (LEDs) for dual-wavelength excitation and four photomultiplier tubes for multichannel detection. Bandpass filters are used to select the excitation and detection wavelengths. The optical system has high optical throughput and single photon sensitivity, both of which are crucial in LED-based Raman measurements. We employ a signal processing technique that compensates for detector drift and error. The sensitivity and reproducibility of the LED Raman instrument compares favorably to laser-based Raman spectrometers. This compact, portable instrument is used for non-invasive measurement of carotenoid molecules in human skin with a repeatability better than 10%.
I INTRODUCTION
Carotenoids are important in maintaining proper human health. They protect tissues from oxidative stress that might otherwise lead to premature macular degeneration rattner06 , cataract formation, sun burns wertz05 , premature skin aging, and basal cell and squamous cell carcinomas seifried03 ; dorgan04 . Carotenoids protect cellular DNA porrini00 and play a role in the recovery of burn patients horton01 . Reliable monitoring of carotenoid levels in tissue may aid studies to better understand how they perform these functions.
Resonance Raman spectroscopy has been demonstrated as a rapid, non-invasive approach to monitoring carotenoid concentrations in human tissues gellermann02a ; ermakov04b . The method’s success is primarily due to the low fluorescence quantum yield of these molecules. While the Raman scattering cross-section increases dramatically on resonance, fluorescence from carotenoids remains low.
Several compact laser-based Raman spectrometers have been reported caspers01 ; frank94 ; hata00 ; dorgan04 ; bernstein98 ; gellermann02a ; ermakov04b . Typically these use optical fibers to deliver laser light to the sample and to collect scattered light. Grating spectrometers and CCD detectors are used to disperse and detect the scattered light spectrum. This approach offers wide spectral coverage, aiding in the identification of several biomolecules in the sample. Fiber coupling of the laser and fluorescence collection is convenient because the mode diameter and numerical aperture of the fiber is a good match for both the laser and the spectrometer. These systems often require environmentally stable operating conditions. The performance of the lasers and CCD detectors are sensitive to temperature variations. In an unstable environment, frequent recalibrations are required.
The large resonance Raman scattering cross section makes it possible to use incoherent excitation sources, such as light-emitting diodes (LEDs). These sources can offer higher stability in a wider range of environmental conditions at a lower cost and in a small form factor. However, these sources have broad spectral bandwidths, do not couple well into optical fibers, and are poorly matched to the slit area and numerical aperture of grating spectrometers. Using a bandwidth-narrowed LED source with a conventional Raman spectrometer results in recorded spectra that are one to two orders of magnitude weaker than those measured using a laser source.
This lower signal level can be overcome in part with sensitive detectors. For example, an instrument for measuring carotenoids in the macula was reported ermakov05a . A photomultiplier tube (PMT) was used to detect the Raman signal transmitted through a narrowband interference filter. By tilting the filter it was possible to change the passband wavelength enough to determine the baseline fluorescence level at a nearby wavelength and to subtract this from the Raman signal. Because the signal-to-background levels were relatively high (0.20), changes in the background fluorescence only had a small influence on these carotenoid measurements.
In this paper we describe an instrument that uses spectrally-filtered LEDs for resonance Raman spectroscopy of carotenoids in skin tissue. For a narrowband excitation source, the signal to background ratio is 20 times smaller in the skin than in the macula, 1% being a typical value. For a spectrally filtered LED, this ratio is even smaller, owing to the 1 nm spectral width of the bandwidth narrowing filter. Such an excitation source emits only 0.5 mW of optical power, resulting in an order of magnitude less light exposure to the skin tissue and therefore much low signal levels compared with a typical laser-based instrument.
We also describe techniques we developed to overcome the difficulties in using the low-intensity excitation sources. We use PMTs to measure the skin fluorescence for increased sensitivity. To compensate for both short- and long-term drifts in detector sensitivity inherent to PMTs, we exploit a dual wavelength excitation method. These detectors are not stable enough to use traditional shifted excitation Raman difference spectroscopy (SERDS) brown07 . Because the signal-to-background ratio is so small, minor variation in the detector gain on the one minute time scale can compromise measurements of the Raman signal. Rather than subtract, we divide the spectra from the two excitation sources. This cancels detector gain variation on a one second time scale. In this regime it is also essential to control for spatial and optical polarization differences from the two excitation sources. If not controlled, either of these can introduce errors comparable to or larger than the Raman line. These techniques are incorporated into a compact commercial instrument with good measurement repeatability under widely varying ambient conditions. We demonstrate calibration stability over a period of nine months, and it seems likely that much longer stability times can be maintained.
II CAROTENOID SPECTROSCOPY
The optical properties of carotenoids have been studied extensively over the past few decades. A variety of fluorescence, excited state absorption, and Raman methods have clarified carotenoid energetics, and given insight into how these molecules perform their various chemical roles sue88 ; polivka01 ; yoshizawa03 ; polivka04 . In skin tissue, lycopene and -carotene are the dominant carotenoid molecules ermakov04b . They both have a backbone of nine conjugated carbon bonds, with additional conjugation into ionone rings on each end.
Optical excitation of carotenoids occurs in the blue-green spectral region, between 400 and 500 nm. The three Raman lines in -carotene are at 1008 cm-1 (CCH3 rocking mode), 1159 cm-1 (CC stretch mode), and 1525 cm-1 (CC stretch mode), with the latter being the strongest. Because of fast non-radiative relaxation, spontaneous fluorescence is suppressed, with a fluorescence quantum yield of only sue88 ; gellermann02a . The fluorescence background is dominated by contributions from other tissue components (lipids, proteins, melanin, DNA, hemoglobin, etc. anderson81 ). The resulting Raman signal-to-background ratio is typically 1% ermakov01 ; darvin05 .
III OPTICAL DESIGN
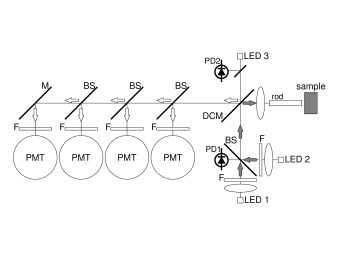
Our application focuses on detection of the 1525 cm-1 Raman line in human skin tissue under resonance excitation conditions. The optical layout is shown in Fig. 1. A blue LED is used as the excitation source. Its nominal 25 nm (FWHM) spectral width is narrowed to 0.8 nm using a bandpass filter at 473 nm. This light reflects from a dichroic mirror and is focused onto the sample. Fluorescence and the Raman signal from the sample passes back through the dichroic mirror. A series of partially reflecting beam splitters divides the optical signal into four channels. Light in each channel passes through an additional 1 nm bandpass filter and is detected using a photomultiplier tube (PMT). The four 1-nm detection bandpass filters have centers spaced equally on 2 nm intervals. The center wavelengths of the detection filters are chosen so that one of the filters is shifted 1525 cm-1 from the excitation source, with one filter 2 nm to the red and two filters to the blue. For excitation at 473.0 nm, the detection filters are at 505.8 nm, 507.8 nm, 509.8 nm, and 511.8 nm. The 509.8 nm filter is centered on the Raman line. The other filters characterize the background fluorescence level. The PMT detectors have good quantum efficiency at these wavelengths and provide single-photon sensitivity.
Using four detector channels allows us to build a second Raman spectrometer into the same optical system. A second excitation source at 471.3 nm generates a Raman line at the 507.8 nm filter. As before, we have one detection filter centered on the Raman line straddled by three “background” filters to help establish the baseline. With this redundancy, we can implement a measurement methodology that removes sensitivity to drifts in the PMT efficiency and gain, as described in Sec. IV. Special care must be taken to minimize differences in the spatial structure between the two excitation sources, and to control polarization in the excitation and detection optics, as described in the next section.
IV DIVIDED SHIFTED RAMAN SPECTROSCOPY
Using LEDs with interference filters gives us the flexibility to choose the excitation wavelength more or less arbitrarily. However, the corresponding Raman lines and the overall signal levels are weaker than that obtained under laser excitation. Using 0.8 nm bandwidth filters and optics results in typically 0.5 mW of optical power focused to a 2 mm diameter spot. Because the spectral widths of the LED excitation sources are much broader than a laser source, the signal to background ratio is further reduced. We compensate for these disadvantages by using a high throughput optical system with high sensitivity PMT detectors.
While PMTs have excellent sensitivity, their signal gain can be influenced by temperature variations. In the analog mode, the gain variation can be as much as 20% over a few hours as the PMTs warm up. Because the carotenoid signal is so small compared to the background, this seemingly slow drift translates into roughly one percent of the Raman peak signal per five seconds of measurement time. For measurement times approaching 100 seconds, this is a 20% variability in successive measurements.
Because of this, standard flat fielding techniques, such as dividing the measurement from a spectrally smooth sample into subsequent measurements, do not work. Variations could be minimized by stabilizing the system’s environmental conditions. However, stabilizing PMT response at the level is challenging, especially for a compact and portable device intended to operate in variable ambient conditions. Instead we use our two shifted spectral measurements described in Sec. III to effectively ‘flat field’ our detectors on a fast time scale while simultaneously extracting the Raman signal. We call our method ‘divided shifted Raman spectroscopy’ (DSRS).
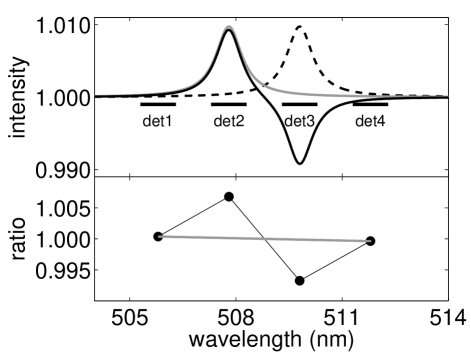
For illustrative purposes, two simulated Raman signals are shown in the top panel of Fig. 2. The spectral windows measured by each of the four detection channels are also shown. The dashed line is the Raman signal using 473.0 nm excitation. The Raman peak appears in the third detector and the other three detectors record background levels. The gray line shows the Raman signal using 471.3 nm excitation. In this case, the Raman peak appears in the second detector and the other three detectors record background levels. The black line shows the ratio of the two spectra. The lower panel of Fig. 2 shows the ratio of the optical signal measured by each detector. Note that all effects due to differences in the detector gain and sensitivity and fluorescence collection geometry divide out.
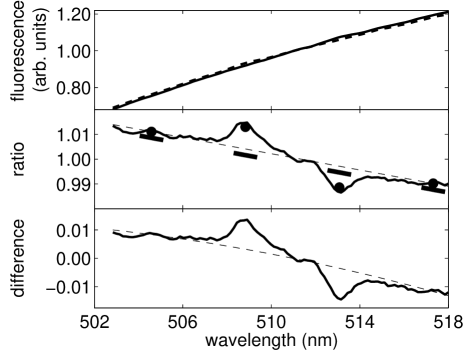
To further illustrate the measurement approach of our LED instrument, we performed similar measurements using two laboratory lasers and a conventional grating spectrometer. In this case, there is far more light available for detection than in the LED instrument. We measured the 1525 cm-1 Raman line excited by a doubled Nd:YAG laser at 473 nm and by an argon-ion laser at 476 nm. Typical fluorescence measurements are shown in Fig. 3. The top panel of Fig. 3 shows spectral measurements of light collected from a hand with the two excitation sources. The middle panel shows the 473/476 fluorescence ratio. The short black lines show equally spaced wavelength intervals, similar to what might be transmitted by bandpass filters. The black circles show the average signal over the analysis wavelength ranges. The thin dashed line shows a parabolic fit to the background. As is typically the case, the quadratic term is small.
There are similarities in this approach and in the more conventional and successful ‘shifted excitation Raman difference spectroscopy’ (SERDS) approach brown07 . We can imagine that each of the two spectra shown in the top panel of Fig 3 is represented by a smooth function of wavelength plus some small variation. The fluorescence signal with 473 nm excitation can be written as . Similarly, the fluorescence signal with 476 nm excitation can be written as . The ratio of these two spectra is
| (1) |
If the function is relatively flat over the two Raman lines represented by the functions and , division gives the difference of the scaled Raman signals centered about 1. The fact that is not flat over the two lines and that and contain more spectral data than just the Raman lines results in a background that is not perfectly flat. Except for an offset, the ratio (middle panel of Fig. 3) and the difference (bottom panel of Fig. 3) are nearly identical. The important distinction for LED/PMT measurements is that our detectors require rapid flat-fielding for measurements accurate at a level of a few times of the fluorescence level, which translates into a few percent accuracy in the measurement of the Raman signal strength. In contrast, SERDS would suffer from drift errors on the order of of the fluorescence level in our application, translating into 100% variation in the Raman signal strength measurements.
We establish the baseline in the DSRS spectrum using the endpoints, which are always “background” measurements. We constrain the baseline by assuming that the ratio measurement in detector 2 is as far above the baseline as the ratio measurement in detector 3 is below it. These assumptions yield a coupled system of equations for the background and signal strength:
| (2) | |||||
where are the ratios of PMT measurements of the two excitation sources, and the are the interference filter passband centers. The parameters , , and are the coefficients of the parabola that best represents the baseline. The parameter is magnitude of the difference between the Raman signal and the baseline on this relative scale. Note that these equations are derived assuming that is small (e.g., as for skin measurements).
When approaches unity the DSRS method is inapplicable. This is the regime in which standard Raman measurement techniques can be implemented. However, even high concentration samples with can be reliably measured using our technique because we can include higher-order corrections to determine in Eqs. 1 and 2.
The parameter is put on an absolute scale by multiplying it by the PMT voltages used in the denominator of . To achieve good reliability, the detector stability needs only to be maintained (or measured) at the few percent level, which is much simpler than the required without using the DSRS technique. We characterize the PMT response to 1% percent using a calibration LED with known brightness preceding each measurement. Absolute calibration is achieved by measuring the Raman response of a sample with known carotenoid concentration.
With a different set of assumptions, this scheme could be implemented with fewer detectors and we have tested these approaches. We find that instruments with two or three detectors do not give the repeatability or reliability of the four detector design, largely because the fluorescence background has both slope and curvature. The parabolic analysis in Eq. 2 makes it possible to derive a curved baseline with high reliability. A configuration with a greater number of detectors could be used, but the additional redundancy does not seem to offer noticeably better machine performance than what is achieved using four.
In principle, the division analysis method could be used with conventional CCD detection devices. It would be most appropriate when the Raman spectrum was dominated by background fluorescence. The experimental realization of the division technique in this paper requires a simple Raman spectrum, such as in resonance measurements. The background measurement points need to be free of any Raman lines. Our implementation of the DSRS technique depends on prior knowledge of detailed spectral features.
When using two independent excitation sources, it is important to make sure that the spatial profile of the two sources is identical. Variations in this profile result from both the structure of the LEDs themselves, but also in the interference filters used to narrow their output spectrum. We do this using a 1 mm diameter, 20 mm long glass rod. The material was chosen to have a high index of refraction and a low fluorescence level. This rod acts somewhat like a very large diameter optical fiber. The multiple internal reflections remove residual differences in the spatial profile of the two excitation sources. It is also important to make sure the optical polarization of the two sources is identical, and to make sure that the polarization is identical at the beamsplitter preceeding each PMT. The Raman signal has the same polarization as the excitation source. This is not true for the background fluorescence. If the collected fluorescence at each PMT is not identical, a markedly different signal-to-background ratio will be measured and the derived Raman signal strength will be compromised. Special care must be taken because the Fresnel reflection coefficients at 45 degrees angle of incidence are typically quite different for the two polarizations in commercial beamsplitters.
V BENCHMARK COMPARISON TO LASER-BASED UNITS
A few years ago, Pharmanex developed a laser-based Raman instrument for detecting carotenoid molecules in human skin tissue. It was based on a larger laboratory research device bernstein98 ; ermakov01 ; ermakov01a . A fiber-coupled laser was focused onto the hand, and backwards-directed fluorescence was fiber-coupled into a grating spectrometer. The light intensity in the Raman peak was measured in the spectrometer trace. Raman measurements correlate with carotenoid serum levels ermakov05b and both resonance and non-resonance Raman measurement can be used to identify, quantify, and monitor molecular content in skin tissue hammond04 ; gellermann04 ; gniadecka04 ; nijssen02 ; caspers01 ; hata00 ; xiao05 .
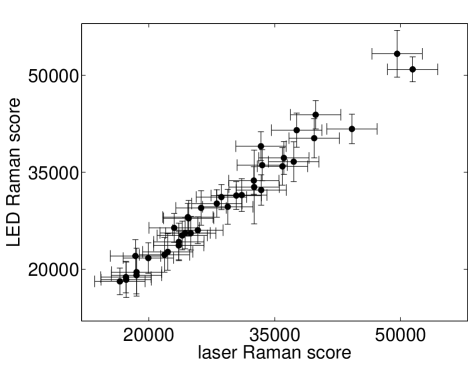
Pharmanex developed an arbitrary scale for quantifying carotenoid levels in skin tissue that is proportional to the Raman signal. On this scale, the average American has a reading in the neighborhood of 25,000 for measurements made in the palm of the hand. The palm has the advantage of being relatively homogeneous and melanin-free. Typical scores range from 10,000 to 50,000, similar to the spread of the population seen in Fig. 4 and the measurement uncertainty is less than 3,000.
We have performed hundreds of tests comparing the performance of our units and laser-based Raman spectrometers. The results of one test are shown in Fig. 4. For this study, 38 persons repeatedly measured their antioxidant scores on a laser Raman instrument and also on LED Raman instruments over a one week time period. To within the error of the measurements, the two different kinds of instruments read identically to one another. A straight-line fit to the data in Fig. 4 has a reduced value of 0.96. The LED Raman instruments also show high repeatability. The vertical errorbars in Fig. 4 are the 1 standard deviations of 20 measurements on two LED Raman units. The average relative standard deviation (RSD) is 9%. This is the 1 variation in a person’s score divided by their mean score and averaged over the 38 persons in this study. The typical RSD is somewhat lower for scores in the 25000 to 50000 range.
The LED Raman instruments are accurate in spite of their low intensity illumination of the skin. The optical power on the skin is less than 0.5 mW in a 3.1 mm2 area. The resulting maximum intensity is 0.016 W/cm2, which is 12.5 lower than the maximum permissible exposure for laser radiation of comparable wavelength ansi .
VI LONG-TERM CALIBRATION RELIABILITY
The LED Raman instruments are designed to have long-term calibration reliability. The optical system includes a photodiode to measure the brightness of the emission sources (PD1 in Fig. 1) and also an additional LED and photodiode to measure the PMT sensitivity (LED3 and PD2 in Fig. 1). These items constitute a set of internal calibration standards for the instrument. They allow us to correct readings for drifts in excitation intensity and PMT sensitivity over time that may arise from temperature variation or component aging.
In normal use, a unit is calibrated at the beginning of a measurement session using a portable Raman standard. All of the PMT, LED, and photodiode values are recorded. Using the internal calibration standards, we correct all readings back to the LED brightness and PMT sensitivities as measured at the time of calibration.
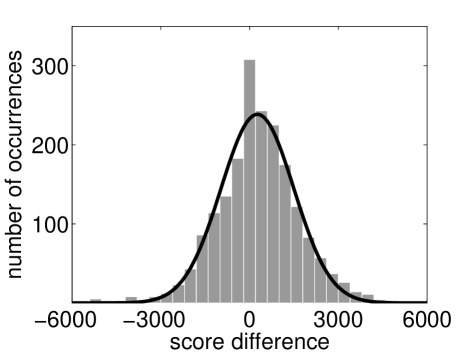
The internal calibration standards are highly robust. Instead of using them to refer to conditions at the beginning of a particular measurement session, they can be used to refer to conditions at a factory calibration. In Fig. 5 we compare the scores measured over a 265 day period determined in two ways. The first is the “normal” way, using calibrations performed at the point of measurement. The second way uses the internal calibration standards to refer back to a single factory calibration. The data in Fig. 5 is a histogram of differences in the scores calculated in these two ways. The overall shift in score is approximately 1%. The 1 confidence level (68.3%) is . A closer evaluation of the data suggests that most of these score differences arise from errors in the calibration at the point of measurement. These data show that the internal calibration standards are stable over time periods approaching a year, and stability over much longer time periods seems likely.
VII CONCLUSION
We report on the development of a compact and portable Raman instrument for measuring carotenoid molecules in human skin. Thousands of these have been built and are in routine operation. These units use high sensitivity detectors and a high throughput optical system, making it possible to use incoherent light sources for resonance Raman spectroscopy in a commercial setting. We have shown repeatability better than 10% on LED Raman instruments and excellent correlation with laser-based Raman spectroscopy measurements. This work represents an important step forward for non-laboratory in vivo Raman spectroscopy using low intensity excitation. With the expanding availability of ultraviolet LEDs, and considering that many important biomolecules have resonances in the ultraviolet wavelength range, this approach may be useful for other systems.
References
- (1) A. Rattner and J. Nathans, “Macular degeneration: recent advancesand therapeutic opportunities,” Nat. Rev. Neurosci. 7, 860–872 (2006).
- (2) K. Wertz, P. B. Hunziker, N. Seifert, G. Riss, M. Neeb, G. Steiner, W. Hunziker, and R. Goralczyk, “-carotene interferes with ultraviolet light a-induced gene expression by multiple pathways,” J. Invest. Dermatol. 124, 428–434 (2005).
- (3) H. E. Seifried, S. S. McDonald, D. E. Anderson, P. Greenwald, and J. A. Milner, “The antioxidant conundrum in cancer,” Cancer Research 63, 4295–4298 (2003).
- (4) J. F. Dorgan, N. A. Boakye, T. R. Fears, R. L. Schleicher, W. Helsel, C. Anderson, J. Robinson, J. D. Guin, S. Lessin, L. D. Ratnasinghe, and J. A. Tangrea, “Serum carotenoids and -tocopherol and risk of nonmelanoma skin cancer,” Cancer Epidemiol Biomarker and Prev. 13, 1276–1282 (2004).
- (5) M. Porrini and P. Riso, “Lymphocyte lycopene concentration and DNA protection from oxidative damage is increased in women after a short period of tomato consumption,” J. Nutr. 130, 189–192 (2000).
- (6) J. W. Horton, D. J. White, D. L. Maass, D. P. Hybki, S. Haudek, and B. Giroir, “Antioxidant vitamin therapy alters burn trauma-mediated cardiac NF-kappaB activation and cardiomyocyte cytokine secretion,” J. Trauma 50, 397–406 (2001).
- (7) W. Gellermann, I. V. Ermakov, M. R. Ermakova, and R. W. McClane, “In vivo resonant Raman measurements of macular carotenoid pigments in the young and in the aging human retina,” J. Opt. Soc. Am. A 19, 1172–1186 (2002).
- (8) I. V. Ermakov, M. R. Ermakova, W. Gellermann, and J. Lademann, “Noninvasive selective detection of lycopene and -carotene in human skin using Raman spectroscopy,” J. Biomed. Opt. 9, 332–338 (2004).
- (9) P. J. Caspers, G. W. Lucasson, E. A. Carter, H. A. Bruining, and G. J. Puppels, “In vivo confocal Raman microspectroscopy of the skin: noninvasive determination of molecular concentration profiles,” J. Invest. Dermatol. 116, 434–442 (2001).
- (10) C. J. Frank, D. C. B. Redd, T. S. Gansler, and R. L. McCreery, “Characterization of human breast biopsy specimens with near-IR Raman spectroscopy,” Anal. Chem. 66, 319–326 (1994).
- (11) T. R. Hata, T. A. Scholz, I. V. Ermakov, R. W. McClane, F. Khachik, W. Gellermann, and L. K. Pershing, “Non-invasive Raman spectroscopic detection of carotenoids in human skin,” J Invest Dermatol 115, 441–448 (2000).
- (12) P. S. Bernstein, M. D. Yoshida, N. B. Katz, R. W. McClane, and W. Gellermann, “Raman detection of macular carotenoid pigments in intact human retina,” Invest Ophthalmol Vis Sci 39, 2003–2011 (1998).
- (13) I. V. Ermakov, M. R. Ermakova, and W. Gellermann, “Simple Raman instrument for in vivo detection of macular pigments,” Appl. Spectr. 59, 861–867 (2005).
- (14) W. R. Brown and J. J. McGarvey, “The Raman effect and its application to electronic spectroscopies in metal-centered species: Techniques and investigations in ground and excited states,” Coordination Chemistry Reviews, 251, 454–473 (2007).
- (15) T. Polivka, D. Zigmantas, H. A. Frank, J. A. Bautista, J. L. Herek, Y. Koyama, R. Fujii, and V. Sundstrom, “Near-infrared time-resolved study of the S1 state dynamics of the carotenoid spheroidene,” J. Phys. Chem. B 105, 1072–1080 (2001).
- (16) T. Polivka and V. Sundstrom, “Ultrafast dynamics of carotenoid excited states – from solution to natural and artificial systems,” Chem. Rev. 104, 2021–2071 (2004).
- (17) J. Sue and S. Mukamel, “Analysis of fluorescence line shapes and Raman excitation profiles of tetradesmethyl--carotene,” J. Chem. Phys. 88, 651–665 (1988).
- (18) M. Yoshizawa, H. Aoki, M. Ue, and H. Hashimoto, “Ultrafast kinetics of excited states in a series of mini- and macro--carotenes,” Phys. Rev. B 67, 174302 (2003).
- (19) R. R. Anderson and J. A. Parrish, “The optics of human skin,” J. Invest. Dermatol. 77, 13–19 (1981).
- (20) M. E. Darvin, I. Gersonde, M. Meinke, W. Sterry, and J. Lademann, “Non-invasive in vivo determination of the carotenoids -carotene and lycopene concentrations in the human skin using the Raman spectroscopic method,” J. Phys. D: Appl. Phys. 38, 2696–2700 (2005).
- (21) I. V. Ermakov, M. R. Ermakova, R. W. McClane, and W. Gellermann, “Resonance Raman detection of carotenoid antioxidants in living human tissues,” Opt. Lett. 26, 1179–1181 (2001).
- (22) I. V. Ermakov, R. W. McClane, and W. Gellermann, “Resonant raman detection of macular pigment levels in the living human retina,” Opt. Lett. 26, 202–204 (2001).
- (23) B. R. Hammond Jr. and B. R. Wooten, “Validity issues with the in vivo measurements of skin carotenoids using Raman spectroscopy,” J. Invest. Dermatol. 122, 544–546 (2004).
- (24) W. Gellermann, I. V. Ermakov, and P. Bernstein, “Author response,” J. Invest. Dermatol. 122, 546–548 (2004).
- (25) I. V. Ermakov, M. Sharifzadeh, M. Ermakova, and W. Gellermann, “Resonance Raman detection of carotenoid antioxidants in living human tissue,” J Biomed Opt 10, 064028 (2005).
- (26) M. Gniadecka, P. A. Philipsen, S. Sigurdsson, S. Wessel, O. F. Nielsen, D. H. Christensen, J. Hercogova, K. Rossen, H. K. Thomsen, R. Gniadecki, L. K. Hansen, and H. C. Wulf, “Melanoma diagnosis by Raman spectroscopy and neural networks: structure alterations in proteins and lipids in intact cancer tissue,” J Invest Dermatol 122, 443–449 (2004).
- (27) A. Nijssen, T. C. Bakker Schut, F. Heule, P. J. Caspers, and D. P. Hayes, “Discriminating basal cell carcinoma from its surrounding tissue by Raman spectroscopy,” J. Invest. Dermatol. 119, 64–69 (2002).
- (28) C. Xiao, D. J. Moore, M. E. Rerek, C. R. Flach, and R. Mendelsohn, “Feasibility of tracking phospholipid permeation into skin using infrared and Raman microscopic imaging,” J. Invest. Dermatol. 124, 622–632 (2005).
- (29) American National Standards for the Safe Use of Lasers, ANSI Z136.1-2000, Table A3.