The Reduction of the Electron Abundance during the Pre-explosion Simmering in White Dwarf Supernovae
Abstract
Prior to the explosion of a carbon-oxygen white dwarf in a Type Ia supernova there is a long “simmering,” during which the reaction gradually heats the white dwarf on a long () timescale. Piro & Bildsten showed that weak reactions during this simmering set a maximum electron abundance at the time of the explosion. We investigate the nuclear reactions during this simmering with a series of self-heating, at constant pressure, reaction network calculations. Unlike in AGB stars, proton captures onto and heavier trace nuclei do not play a significant role. The abundance is sufficiently high that the neutrons preferentially capture onto , rather than iron group nuclei. As an aid to hydrodynamical simulations of the simmering phase, we present fits to the rates of heating, electron capture, change in mean atomic mass, and consumption of in terms of the screened thermally averaged cross section for . Our evaluation of the net heating rate includes contributions from electron captures into the 3.68 MeV excited state of . This results in a slightly larger energy release, per consumed, than that found by Piro & Bildsten, but less than that released for a burn to only and . We compare our one-zone results to more accurate integrations over the white dwarf structure to estimate the amount of that must be consumed to raise the white dwarf temperature, and hence to determine the net reduction of during simmering.
Subject headings:
nuclear reactions, nucleosynthesis, abundances — supernovae: general — white dwarfs — galaxies: evolution1. Introduction
The leading scenario for a Type Ia supernova (hereafter SNe Ia) is the thermonuclear incineration of a carbon-oxygen white dwarf that has increased in mass, through accretion, to just below the Chandrasekhar limit (for a review, see Hillebrandt & Niemeyer, 2000). Despite the advances in modeling the post-ignition flame evolution (for a sampling of recent work, see Gamezo et al., 2004; Plewa et al., 2004; Röpke et al., 2006; Jordan et al., 2007), we still lack a complete understanding of which subset of the binary white dwarf population become SNe Ia, and how differences in the progenitor map onto differences in the outcome of the explosion.
The composition of the white dwarf at the time of the explosion should have an effect on the nucleosynthesis that takes place during the explosion and the isotopic abundances of the final composition. The observable properties of SNe Ia resulting from Chandrasekhar-mass explosions are chiefly determined by their final composition, the velocity profiles of key spectral lines at early- and late-times (e.g., P-Cygni profiles of Si II at 615.0 nm at early times), the opacity of the material through which the photons from radioactive decay must propagate, the kinetic energy of ejecta, and its interaction with the density profile of the surrounding circumstellar or interstellar medium (Filippenko, 1997; Pinto & Eastman, 2000; Hillebrandt & Niemeyer, 2000; Leibundgut, 2001; Mazzali & Podsiadlowski, 2006; Marion et al., 2006; Blondin et al., 2006; Badenes et al., 2007; Woosley et al., 2007). The dominant parameter in setting the peak brightness, and hence width, of the light curve is widely believed to be the mass of ejected by the explosion. Timmes et al. (2003) showed the mass of produced depends linearly on the electron fraction, , at the time of the explosion, and that itself depends linearly on the abundance of in the white dwarf.
In this paper we explore, using a reaction network coupled to an equation for self-heating at constant pressure, the reduction in that occurs after the onset of the thermonuclear runaway (when the heating from reactions is faster than cooling by thermal neutrino emission), but before the burning becomes so fast that local regions can thermally run away and launch a flame. This “simmering” epoch lasts for , long enough that electron captures onto products of burning can reduce the free electron abundance . A similar, but independent calculation, of the reduction of during simmering was performed by Piro & Bildsten (2008). Their calculation did not use a full reaction network, but it did take into account the change in energy of the white dwarf due to the growth of the convective zone. Our calculation agrees with their findings, in particular that there is a maximum at the time of the explosion, and that the reduction in is linear in the amount of consumed prior to when the rate of burning outpaces that of the weak reactions. This paper expands on their work in three ways. First, by using a full reaction network, we are able to quantify the role of and trace nuclides in setting the change in electron abundance with consumption, . Second, we calculate the heating from the electron capture reactions and include the contribution from an excited state of . Third, we provide tabulated expressions for the rate of heating , the rate of change in electron abundance , and the rate of change in the mean atomic mass in terms of the reaction rate for the reaction. These expressions are useful input for large-scale hydrodynamical simulations of the simmering phase which do not resolve such microphysics.
We first give, in § 2, a simple estimate for the reduction in during the pre-explosion simmering and describe the role of and other trace nuclides. In § 3 we describe our numerical calculations, explain the reactive flows that occur (§ 3.1), and give simple approximations to the heating rate and carbon consumption (§ 3.2). We detail, in § 3.3, some of the limitations of our approach. We evaluate the energy required to raise the white dwarf central temperature, and hence the amount of that must be consumed, and compare it against the one-zone calculation. We also estimate the central temperature at which convective mixing becomes faster than electron captures. This convective mixing advects electron capture products to lower densities where they can -decay: the convective Urca process. Because each electron capture-decay cycle emits a neutrino–anti-neutrino pair, there is energy lost from the white dwarf, and our calculation underestimates the amount of consumed prior to the flame runaway. The convective Urca process (Paczyński, 1972) reduces the rate of heating by nuclear reactions (thereby increasing the amount of that must be consumed to raise the temperature), but cannot result in a net decrease in entropy and temperature for constant or increasing density (Stein et al., 1999; Stein & Wheeler, 2006). The Urca reactions also tend to reduce the effects of buoyancy, and in degenerate matter have a direct influence on the convective velocity (Lesaffre et al., 2005). The paper concludes (§ 4) with a discussion of the implications for systematic variations in the mass of produced in the explosion.
2. The reduction in electron abundance during the explosion
The demise of an accreting white dwarf begins when the central temperature and density are such that the heating from the reaction becomes greater than the cooling from thermal neutrino emission. For a density this requires a temperature (see Gasques et al., 2005, for a recent calculation). Initially the heating timescale is long, ; as the temperature rises and the reaction rate increases, decreases. Woosley et al. (2004) estimate that when , fluctuations in the temperature are sufficient to ensure that a local patch can run away and the flame ignites.
The basic reactions during burning were first worked out in the context of core carbon burning in evolved stars (Reeves & Salpeter, 1959; Cameron, 1959). During simmering, is primarily consumed via and . These reactions occur with a branching ratio for (Caughlan & Fowler, 1988). At temperatures below , neutronization—that is, a reduction in —occurs via the reaction chain . This electron capture implies that there is a maximum at the time of the explosion, as first pointed out by Piro & Bildsten (2008). One can readily estimate the change in electron abundance, . For simplicity, take the branching ratio for to be 1:1 for producing and . Thus there is one produced for every four consumed. Two additional are consumed via , which also destroys one nucleus, and via , which also destroys one . Thus for every 6 consumed there is one electron capture, so that , where is the molar abundance of . As an estimate for the heating from this reaction sequence, summing over the -values for the strong reactions gives a net heat release of per nucleus consumed. Note that at densities above , the reaction contributes to the rate of decrease in , so that at those densities. The total effective rate of depends on the rate of convective mixing and the size of the convective core (see § 3.3) but is always at least as large as the contribution from . In the following sections, we investigate these reactions in detail.
2.1. The role of neon-22 and other trace nuclides
Reactions on , , and other trace nuclides also occur during shell-burning in asymptotic giant branch (AGB) stars, and we briefly summarize their role in that context before describing the very different environment in a simmering white dwarf core. In AGB stars more massive than about , the hydrogen burning shell, at a temperature of 60-100 MK, extends into the convective envelope. The envelope composition is then directly affected by the various hydrogen-burning cycles: CNO, NeNa, and MgAl (Lattanzio & Boothroyd, 1997; Herwig, 2005). The hydrogen-burning shell is also disturbed by thermal pulses due to ignition of the helium layer. At each pulse, dredge-up of material may occur, in which helium-burnt material is mixed into the stellar envelope, polluting it with , , , and heavy -process elements (Izzard et al., 2007). Thus, the fate of is either to contribute to hydrogen burning via or to become a neutron source for the -process via the reaction. The reaction requires the high temperatures () that can be found at the bottom of the pulse-driven convective zone during the helium shell flashes. The neutrons are released with high density [] in a short burst (Gallino et al., 1998; Busso et al., 1999). These peak neutron densities are realized for only about a year, followed by a neutron density tail that lasts a few years, depending on the stellar model assumptions. These neutrons are the genesis of the classic high-temperature -process in AGB stars.
Should be present, there are two usual possibilities for subsequent nuclear processing in AGB stars via either the reaction or the reaction. The former reaction gives rise to the classical NeNa cycle (Marion & Fowler, 1957; Rolfs & Rodney, 1988; Rowland et al., 2004), whereas the competing reaction transforms to heavier isotopes and bypasses the NeNa cycle. How much material is processed through the reaction on as opposed to the competing reaction is of interest for AGB star (and classical novae) nucleosynthesis. New measurements of the cross section (Rowland et al., 2004) suggest that for competes with the branch, disrupts the NeNa cycle, and produces a flow into the MgAl hydrogen burning cycle.
Caution about intuition developed for reaction sequences on and in AGB star environments seems prudent when applied to the dense, carbon-rich environments of white dwarfs near the Chandrasekhar mass limit. During the slow simmering preceding the explosion, the large ensures that liberated by the (,) branch will capture preferentially onto , rather than or . Figure 1 shows the ratio of thermally averaged cross-sections, , to that for for three reactions: (solid line), (dashed line), and (dotted line). In addition to the Coulomb penetration, there are numerous resonances that determine how the cross-sections change with temperature. When the ratio of the thermally averaged cross-sections is of order unity, as it is for , then the proton capture is determined by the relative abundances of and .
Note that for the latter two reactions, we plot the largest proton-consuming branch rather than the branch. We include screening in all reactions (Yakovlev et al., 2006) with the plasma taken to consist of and with mass fraction 0.3 and 0.7, respectively. For , is well-constrained experimentally (Iliadis et al., 2001). For a white dwarf with a central density the ignition temperature (where nuclear heating dominates over cooling via thermal neutrino emission) is (Gasques et al., 2005); the burning timescale becomes less than the timescale for once the temperature increases beyond . Over this range, the thermally averaged cross-sections for and are comparable, but the abundance of is far greater; having capture preferentially onto would therefore require it to have a mass fraction roughly twice that of .

At densities greater then , the reaction produces roughly one nucleus for every six nuclei consumed. The screened thermally averaged cross-section for is times that of (Fig. 1), so that could become a competitive sink for protons. For our self-heating burn (see § 3.1) starting at , the abundance of reaches () by the point the heating timescale becomes shorter than the timescale for electron captures onto . Although our one-zone approximation overestimates the amount of that must be consumed to raise the central temperature (see § 3.3), should enough of the convective core lie above the threshold for electron capture onto , the abundance of can become large enough to choke off the reaction, as noted by Piro & Bildsten (2008).
2.2. The reaction
As described above, the large abundance ensures that protons produced by lead to the formation of -unstable via unless an appreciable abundance of or can build up. At these densities, the rate for electron capture is substantially greater than the rate of -decay for . The electron Fermi energy is , and the -value for the decay of is . As a result, there are several excited states of into which the electron can capture. Of these, the transition to the excited state , with spin and parity , is an allowed Gamow-Teller transition. We computed the electron capture rate using the experimental for the ground-state transition (Ajzenberg-Selove, 1991). Gamow-Teller strengths to excited states were calculated with the shell-model code OXBASH (Brown et al., 2004) employing the Cohen-Kurath II potential (Cohen & Kurath, 1967) in the -shell model space. A quenching factor of 0.67 (Chou et al., 1993) was applied to this strength, and the resulting values were used with the analytical phase space approximations of Becerril Reyes et al. (2006) to obtain the capture rate. These shell-model calculations agree well with recent scattering data (Zegers et al., 2007). At , captures into the excited state at account for of the total rate (); this fraction increases with density. Because , this capture does not freeze out during the simmering, unlike capture onto . Although the capture into the excited level does not increase the capture rate substantially beyond that for the ground-state-to-ground-state transition, it does increase the heat deposited into the white dwarf from this reaction. We find the heat deposited from this reaction, at , to be .
2.3. Production and subsequent captures of neutrons
Finally, we consider the contribution from heavier nuclei, such as , inherited from the main-sequence star. In AGB stars the reaction (during a He shell flash, also contributes) acts as a neutron source for the s-process. In contrast, the large abundance of the white dwarf core prevents a strong s-process flow during the pre-explosion simmering. The cross-section for is 63.5 times smaller than the cross-section for (Bao & Kappeler, 1987) at an energy of 30 MeV, which is not sufficient to overcome the vastly larger abundance of nuclei (for a progenitor with solar metallicity, the : ratio [for a mass fraction of 0.3] is 1400:1).
3. Reaction network calculations
In this section we investigate the reactions that occur during simmering in more detail using a “self-heating” reaction network. Under isobaric conditions the temperature evolves with time according to
| (1) |
Here is the specific heat at constant pressure, and the heating rate is given by
| (2) |
where and are, respectively, the atomic mass and molar abundance of species , is the electron chemical potential, is the neutrino loss rate, per unit mass, from the weak reactions (Fuller et al., 1982; Langanke & Martínez-Pinedo, 2001), and . We neglect thermal neutrino emission processes; this is an excellent approximation over most of the integration. Our reaction network incorporated 430 nuclides up to and is the same one used to explore the effect of on the laminar flame speed (see Chamulak et al., 2007, and references therein, for a description of the microphysics). At conditions of and , the specific heat is dominated by the ions, which are in a liquid state (plasma parameter ), and have , where is the average atomic mass.
3.1. The reactive flows
In this section we refine our estimate of made in § 2.2. We integrate equations (1)–(2) starting from the temperature at which heating from the reaction equals the heat loss from thermal neutrino losses (this determines the onset of thermal instability). For simplicity, we split the solution of the thermal and network equations. That is, for each time-step we solve the thermal equations to obtain and , integrate the reaction network at that and to compute and , and use to advance the solution of equation (1).
In the initial phases of the simmering, the convective timescale is slow, and our one-zone calculations give an adequate description of the heating (when corrected for the gradient in temperature). As the temperature of the white dwarf increases, the heating timescale decreases; moreover, the convective mixing becomes more rapid, and one must treat the hydrodynamical flows in order to calculate the nucleosynthesis properly (see § 3.3). In this section, we will restrict our integration to where , for which the heating timescale is , so that electron captures onto are not frozen out.
To explore the reaction channels that link consumption with the reduction in , we define the reactive flow between nuclides and as
| (3) |
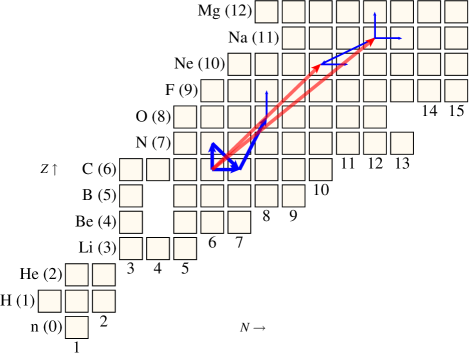
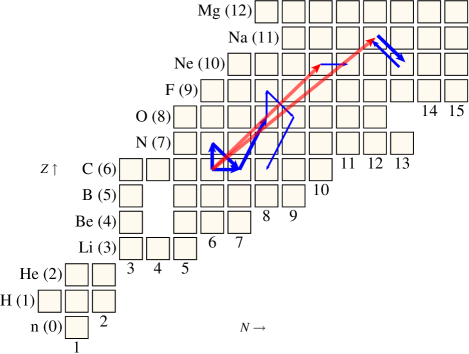
where the integral is for the reactions linking nuclide with . We differentiate between and , i.e., we treat inverse rates separately. Figures 2 and 3 show the reactive flows for and , respectively. In both cases the composition is . Each row of the chart is a different element (), with the columns corresponding to neutron number. For viewing ease, we only plot those flows having , and we indicate the strength of the flow by the line thickness. We highlight the flows of the initial fusion reactions with a lighter shading (these flows are also in red in the online version). For illustrative purposes, we only show the flows for when the temperature is not sufficiently hot for photodissociation of . Finally, by convention and to avoid cluttering the plot, we do not show flows into or out of , , and .
To facilitate comparisons between different runs, we define a normalized flow as
| (4) |
At a density of we find and , which reflects the branching ratio (Caughlan & Fowler, 1988). In agreement with the arguments in § 2, most of the protons liberated by capture onto , with . Note that if all were to capture onto , we would have , because the reaction consumes two . The -particle released by the reaction captures onto to form and a neutron, which in turn destroys another via . The flow and nearly matches the number of -particles produced by ; -captures onto and account for the difference. At the only electron captures are onto , so . Dividing by gives (Table 1). This is slightly less than the estimate of (§ 2.2) because of the lower branching ratio of .
At , is consumed by the reaction rather than by - or -capture (cf. Figs. 2 and 3). The flow is much larger than that from , because the reaction competes for and produces more . Indeed, because of extra produced by the reaction . There is an additional contribution from electron captures onto produced via , but this flow is only about 4% of the flow. At both densities, plays a small role in reducing , which we verified by comparing the flows for a burn with with those for a flow with (Fig. 3). We find that, for a burn starting at , and . Although at (Fig. 1), the abundances are in ratio . Below the electron capture threshold for , the reaction will cause a slight reduction in equal to the ratio of to .
Finally, we confirmed the lack of an s-process flow (§ 2.3) by performing a run with nuclides from to present at up to 3 times their solar abundances (Anders & Grevesse, 1989). The threshold for electron capture onto is , and so at higher densities carbon ignition occurs in a more neutron-rich environment. We therefore start the calculation by artificially suppressing the strong interactions and allowing the mixture to come into -equilibrium. We then turn on the strong reactions and let the runaway commence. In all cases the heavier nuclides did not have a substantial impact on the reactive flows. The value for is somewhat larger than 0.3 at densities , the threshold density for , because of the reactions . Of these two captures, is -unstable, and hence the electron capture is fast enough to proceed throughout simmering; the capture onto has a timescale, at , of and will therefore freezeout during simmering, just as captures onto freezeout.
Our runs span a range of initial densities, from (for which the electron Fermi energy is too low to induce electron captures onto ) to , which represents an extreme case for accretion onto a cold, initially massive white dwarf (Lesaffre et al., 2006). In all cases we took the initial mass fraction to be . As noted above, the mass fraction of would have to exceed that of to change the nucleosynthesis during simmering appreciably. At higher densities, -captures onto can also play a role (§ 3.1), but our results will not change appreciably so long as is not substantially less than 0.3.
The calculation, being a single reaction network integration, does not incorporate the effects of mixing in the white dwarf core. Our focus here is to elucidate the reactions that set . These calculations do not determine the total amount of carbon consumed (although see § 3.3 for an estimate) or the total mass of processed material that lies at a density greater than the electron capture threshold. We list our one-zone results in terms of the change in electron abundance per carbon consumed, . Table 1 summarizes our numerical findings of for densities , , and , for mass fractions and 0.06, and finally a run (denoted as in Table 1) with elements heavier than present at 3 times solar abundance. We use this value of as representing a rough upper limit based on the scatter in present in local field stars (Feltzing et al., 2001).
| compositionaaIn all cases the initial mass fraction of is 0.3. | density | ||
|---|---|---|---|
| g | |||
| 1.0 | 0.136 | 0.340 | |
| 3.0 | 0.297 | 0.340 | |
| 6.0 | 0.302 | 0.342 | |
| 1.0 | 0.125 | 0.347 | |
| 3.0 | 0.301 | 0.344 | |
| 6.0 | 0.305 | 0.346 | |
| 1.0 | 0.130 | 0.361 | |
| 3.0 | 0.349 | 0.370 | |
| 6.0 | 0.355 | 0.380 |
3.2. The effective -value of the reaction
The scope of this work is to elucidate the nuclear reactions that occur during the pre-explosion simmering, and including their effects in large-scale hydrodynamics simulations of the entire white dwarf is advisable. As an aid to such simulations, we present fits for the carbon depletion rate and effective heat deposition, which improve on previous expressions (Woosley et al., 2004). Since the reaction chain is controlled by the reaction , we write the rate of carbon consumption, as being proportional to the thermally averaged cross-section,
| (5) |
This definition is such that the quantity in parenthesis is the reaction rate per pair of nuclei and if the only -destroying reaction present is . One can determine from summing the normalized reaction flows (eq. [4]) out of .
In a similar fashion, we can define the effective heat evolved, , per reaction by the equation
| (6) |
With this definition, one has ; this may be compared with equation (2) to relate to the binding energy of the nuclei. To compute these quantities, we integrated the reaction network over a grid of and , both of which were held fixed for each run. We found in all cases that the instantaneous energy generation rate would, after some initial transient fluctuations, settle onto a constant value until a significant () depletion in had occurred. We used this plateau in to obtain and . For the densities of interest, the values of both and obtained this way are nearly independent of temperature. We find ; this value is accurate to within 2% over all our runs. The value of increases slightly with density, but is nearly constant over the temperature range of interest. We find that , 9.11 MeV, and 9.43 MeV for , , and , respectively. At each of these densities, the quoted value of is accurate to within 3% over the temperature range of to .
For use in large-scale hydrodynamic models, one first computes the screened thermally averaged cross-section (for the most recent rate, see Gasques et al., 2005) at the thermodynamic conditions of a given cell. Combining and the cell’s carbon abundance with our estimates of and , one computes and from equations (5) and (6). In effect, this procedure incorporates the results of a large reaction network and careful treatment of the detailed nuclear physics into simple expressions. We caution that these fits were obtained in the regime , for which proton captures onto are not competitive with proton captures onto . Note that the heat released per nucleus consumed is , slightly higher than our simple estimate (§ 2), and also somewhat higher than those used by Piro & Bildsten (2008). This is because of our inclusion of heating from the and reactions. Our estimate of the heat evolved is less than that computed under the assumption that the products of burning are a 3:1 : mixture (see, e.g. Woosley et al., 2004), which releases 5.0 MeV per nucleus consumed111Note that in eq. (1) of Woosley et al. (2004), the factor of ½ is subsumed into their quantity .. Our net heating rate, per reaction, is about 10% less than that used by Woosley et al. (2004), but we effectively consume nuclei per reaction.
The change in electron abundance is related to via
| (7) |
where is taken from Table 1. Finally, we may compute the change in the mean atomic mass, , as a function of carbon consumed. On differentiating , and substituting equation (5, we have
| (8) |
where the quantity is computed from the flows (eq. [4]) and is listed in Table 1. From the simple description of the reactions (§ 2; see also Piro & Bildsten 2008) we have, for every six destroyed, one each of , , , and (or ), so that . This results in a smaller change in than would result from burning to a 3:1 : mixture (in that case, ). We advocate using equations (5)–(8) and the computed values (Table 1) of and in numerical simulations of simmering.
3.3. Heating of the white dwarf core and the end of simmering
In previous sections, we evaluated the heating and neutronization of the white dwarf core in terms of the rate of consumption. We now estimate the net amount of that is consumed in raising the white dwarf temperature and evaluate the temperature at which electron captures onto freeze out. In the one-zone isobaric calculations, using equations (5) and (6), we have , so that , where is the change in mass fraction of . The change of abundance required to raise the temperature from to is then . This is about 11% of the available , for an initial mass fraction . Figure 4 shows the decrement of the abundance, as a function of consumed, . Note that we are plotting the decrement in abundance. The calculation was started at an initial density and temperature and . As shortens, the electron captures onto “freeze out” and decrease to . When , the abundances of and have increased sufficiently that they compete with to consume protons, and thereby halt the neutronization, in agreement with Piro & Bildsten (2008).

As noted by Piro & Bildsten (2008), a one-zone model will overestimate the heat required to raise the central temperature by a given amount, and hence overestimate the amount of that must be consumed during simmering. We perform a calculation similiar to theirs: starting with an isothermal white dwarf with a given central density and with a temperature set by equating heating from the reaction with neutrino losses, we then raise the central temperature to , keeping the total white dwarf mass fixed, and follow an adiabatic temperature gradient until we intersect the original isotherm at radius , which we then follow to the stellar surface. We compute the total stellar energy, gravitational and thermal, in both cases, and take the difference to find the heat required to raise the central temperature of the star to . The temperature of is chosen as a fiducial temperature representing the point at which the heating of a fluid element proceeds faster than the convective timescale (Woosley et al., 2004). The evolution of the white dwarf core is not exactly isobaric: the expanding convective zone heats the white dwarf. As the entropy of the white dwarf increases, it expands and reduces the core pressure. For an initial central density , we find that in raising the central temperature from to the radius expands by a factor of 1.1 and the central pressure decreases to 0.59 of its initial value.
For initial central densities , , and , corresponding to white dwarf masses of , , and , the initial temperatures defined by the onset of thermal instability are , , and , respectively. The energy required to raise the central temperature to is , 4.12, and 5.58 keV per nucleon, respectively. When the central temperature has reached , the masses of the convective zone for these three cases are , , and , respectively. The spatial extent of the convective zone, for the three cases, is in agreement with the findings of Kuhlen et al. (2006). We checked our computation of by computing , as was done by Piro & Bildsten (2008). Both methods give comparable estimates, but slightly underestimates the change in energy (by ), because it does not account for the expansion of the white dwarf. Neglecting the change in as the white dwarf heats introduces a small correction to : for an adiabatic white dwarf with a central temperature of , a reduction in by reduces by only 3.3%.
If the white dwarf were entirely mixed, raising the central temperature would require, for the three cases here, that , , and , respectively. Because the changes in composition are only mixed over the convective zone, the decrement in , and hence , is more pronounced there. Using our estimate of , we estimate that within the convective zone , , and , respectively, for , 3.0, and 6.0. Should the radial extent of the convective zone be smaller than our estimate, for example because of convective Urca losses (Stein et al., 1999; Stein & Wheeler, 2006; Lesaffre et al., 2005), the abundance of will be further reduced in the white dwarf core. A lower abundance reduces the laminar speed of the flame launched at the end of simmering (Timmes & Woosley, 1992; Chamulak et al., 2007).
Finally, we estimate at what point the convective mixing timescale becomes shorter than the timescale for electron captures onto . Using our adiabatic temperature-gradient white dwarf models, we compute the typical convective velocity , and hence a characteristic turnover time , using the mixing length formalism (see the discussion in Woosley et al. 2004) with the total luminosity and evaluating thermodynamical quantities at their central values. Figure 5 shows (thick lines) for the three cases of considered above, as well as the electron capture timescale, for (thin lines) for those cases with a density above threshold. To estimate the effect of the / pairs on the convective zone, we evaluated the mass fraction of these pairs for the case when the temperature had risen to and (Fig. 5, solid line). At this point the convective core has a mass 0.5 which is comparable to their calculation. We estimate, from the energy required to heat the white dwarf to this point, that the mass fraction of / pairs in the convective zone will be at this time. We note that such a large number of Urca pairs will have a dramatic effect on the properties of the convection zone (Lesaffre et al., 2005). As is evident from Figure 5, there is a range of temperatures for which . In this region, the effective will depend on the fraction of mass with densities above the capture threshold and on the effects of Urca losses on the convective flows, but will still be larger than the minimum value set by . Incorporating the effects of the neutrino luminosity from the / reactions in this regime is numerically challenging (Lesaffre et al., 2005, 2006) and beyond the scope of this work; for now, we just note that this is the primary uncertainty in determining the amount of consumed during the pre-explosive phase, and a better treatment is needed.

4. Discussion and conclusions
Using a nuclear reaction network coupled to the equation for self-heating at constant pressure (eq. [1]–[2]), we have investigated the change in induced by electron captures on nuclei produced by fusion during the pre-explosion simmering of the white dwarf. We confirm that there is a maximum at flame ignition (Piro & Bildsten, 2008). We quantified the role of and other trace nuclides in setting the change in electron abundance with consumption by using a full reaction network, and we included the heating from electron captures into an excited state of . We gave simple formulae (eq. [5]–[8]) for the energy generation rate, the rate of change in electron abundance, and the rate of change in the mean atomic mass to include the detailed nuclear physics into large-scale hydrodynamical simulations.
Our estimates of the maximum at the time of the explosion are roughly similar to those of Piro & Bildsten (2008). If we neglect the effect of thermal neutrino losses on the evolution of the white dwarf, then is reduced by within the convective zone. This reduction in depends predominantly on the amount of consumed prior to ignition. The electron captures during simmering reduce below the value set by neutron-rich inherited from core He burning by the white dwarf’s progenitor star. Reducing in the explosion depresses the yield of and increases the amount of and synthesized (Iwamoto et al., 1999; Timmes et al., 2003), even in the absence of further electron captures onto the Fe-peak isotopes in nuclear statistical equilibrium (NSE) in the densest portion of the white dwarf. As a result, any correlation between host system metallicity and white dwarf peak luminosity will be weakened for (for which the reduction in due to captures during simmering is greater than the change due to initial white dwarf composition).
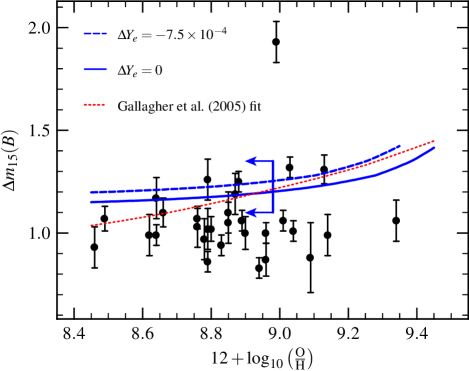
To illustrate how the simmering electron captures affect the light curve, we reconstruct the comparison made by Gallagher et al. (2005), who compiled a set of SNe Ia with measured , defined as the change in over 15 days post-peak, and host galaxies with measured abundances of oxygen to hydrogen, denoted O/H. We construct an expression for , the mass of produced in the explosion, that depends on (Table 1), , and the host galaxy composition (we assume that the white dwarf has the same O/H ratio as the galaxy). The trace nuclide that predominantly sets in the white dwarf is , which traces the aboriginal abundance of CNO nuclei in the main-sequence star from which the white dwarf evolved. We therefore recast the linear formula for (Timmes et al., 2003) in terms of O/H. For simplicity, we fix the : ratio, as well as the ratio of heaver elements to , to their solar system values (Asplund et al., 2005) and neglect corrections from the change in with (Ramírez et al., 2007) and the increase in with (Liang et al., 2006). With these assumptions, the mass of ejected in the explosion is
| (9) |
where is the total mass of NSE material synthesized at densities where electron captures during the explosion are negligible, is the change in electron abundance with carbon consumption given in Table 1, and is the total amount of consumed during the pre-explosion convective phase.
Relating this to an observable such as requires an explosion model that follows the radiation transfer. Our interest here is to isolate how changes with the CNO abundance of the progenitor when the other parameters, such as the ejecta kinetic energy and the total mass of iron-peak nuclei, are held fixed. This is important, because the relation between light curve width and peak brightness depends on these other parameters as well (see Woosley et al., 2007, for a lucid discussion). We use the model M070103 (Woosley et al., 2007), in which the total mass of iron-peak ejecta is : of that, the innermost is stable iron formed in situ from electron captures during the explosion, with the remainder being a mix of radioactive and stable Fe. Note that this model follows the peak luminosity-light curve width relation (Phillips, 1993), whereas Mazzali & Podsiadlowski (2006) suggest that varying the ratio of to stable Fe may create dispersion about this relation.
Using the model of Woosley et al. (2007), we set , use equation (9) to compute as a function of for different , and interpolate from Woosley et al. (2007, Fig. 22) to find . Figure 6 displays this result. We plot here a maximal case (dashed line) with in the initial part of the simmer, appropriate for the one-zone calculation with electron captures onto (Fig. 4); for this case . For comparison, we also plot a case (solid line) with during simmering. This gives a sense of how large the variation in might be. The vertical bar indicates the value of at which the change in from the abundance equals that from the electron captures during simmering for this maximal case. To the left of this curve the linear correlation between abundance and will be masked by variations in the simmering of the white dwarf. For comparison, we also show the data from the compilation of Gallagher et al. (2005) and Hamuy et al. (2000) and plot the relation between and used by Gallagher et al. (2005, dotted line). This trend is much steeper than our finding. The difference is due to how the mass was varied; whereas the models we use (Woosley et al., 2007) hold the kinetic energy and total mass of iron-peak ejecta fixed, Gallagher et al. (2005) based their peak brightness on delayed detonation models (Höflich et al., 2002) for which a variation in also produced a change in the relative amounts of iron-peak and intermediate mass-elements, as well as a different explosion kinetic energy.
It is evident from Fig. 6 that the scatter in the data points is larger than the expected trend due to progenitor composition, especially at sub-solar metallicities. Both and depend on the central density, which is not obviously correlated with metallicity, and hence the correlation between peak brightness and O/H will be masked by differences in the pre-explosion simmering. Indeed, if the variation in were as large as the two cases we plot in Fig. 6, then variations in would be determined more by than by stellar composition for galaxies with sub-solar O/H. There is a general trend that SNe Ia are systematically brighter in galaxies with active star-formation (Hamuy et al., 2000; Gallagher et al., 2005; Sullivan et al., 2006; Howell et al., 2007). Sullivan et al. (2006) showed that the SNe Ia rate increases linearly with the specific star formation rate, and that SNe Ia associated with actively star forming galaxies were intrinsically brighter than those associated with passive galaxies. Although many of these passive galaxies are more massive, and hence more metal-rich (Tremonti et al., 2004), the observed scatter in SNe Ia peak brightnesses remains much larger than the expected trend with metallicity (Piro & Bildsten 2008; D. A. Howell 2007, private communication). This suggests that the correlation with the chemical abundances of the host galaxy is a secondary effect in setting the peak brightness of SNe Ia.
References
- Ajzenberg-Selove (1991) Ajzenberg-Selove, F. 1991, Nuclear Physics A, 523, 1
- Anders & Grevesse (1989) Anders, E., & Grevesse, N. 1989, Geochim. Cosmochim. Acta, 53, 197
- Asplund et al. (2005) Asplund, M., Grevesse, N., & Sauval, A. J. 2005, in Astronomical Society of the Pacific Conference Series, Vol. 336, Cosmic Abundances as Records of Stellar Evolution and Nucleosynthesis, ed. T. G. Barnes, III & F. N. Bash, 25
- Badenes et al. (2007) Badenes, C., Hughes, J. P., Bravo, E., & Langer, N. 2007, ApJ, 662, 472
- Bao & Kappeler (1987) Bao, Z. Y., & Kappeler, F. 1987, At. Data Nucl. Data Tables, 36, 411
- Becerril Reyes et al. (2006) Becerril Reyes, A. D., Gupta, S., Kratz, K. L., Möller, P., & Schatz, H. 2006, in Nuclei in the Cosmos IX, ed. J. Cederkäll et al. (Trieste: SISSA)
- Blondin et al. (2006) Blondin, S., Dessart, L., Leibundgut, B., Branch, D., Höflich, P., Tonry, J. L., Matheson, T., Foley, R. J., Chornock, R., Filippenko, A. V., Sollerman, J., Spyromilio, J., Kirshner, R. P., Wood-Vasey, W. M., Clocchiatti, A., Aguilera, C., Barris, B., Becker, A. C., Challis, P., Covarrubias, R., Davis, T. M., Garnavich, P., Hicken, M., Jha, S., Krisciunas, K., Li, W., Miceli, A., Miknaitis, G., Pignata, G., Prieto, J. L., Rest, A., Riess, A. G., Salvo, M. E., Schmidt, B. P., Smith, R. C., Stubbs, C. W., & Suntzeff, N. B. 2006, AJ, 131, 1648
- Brown et al. (2004) Brown, B. A., Etchegoyen, A., Godwin, N. S., Rae, W. D. M., Richter, W. A., Ormand, W. E., Warburton, E. K., Winfield, J. S., Zhao, L., & Zimmerman, C. H. 2004, OXBASH for Windows, report 1289, MSU-NSCL
- Busso et al. (1999) Busso, M., Gallino, R., & Wasserburg, G. J. 1999, ARA&A, 37, 239
- Cameron (1959) Cameron, A. G. W. 1959, ApJ, 130, 429
- Caughlan & Fowler (1988) Caughlan, G. R., & Fowler, W. A. 1988, At. Data Nucl. Data Tables, 40, 283
- Chamulak et al. (2007) Chamulak, D. A., Brown, E. F., & Timmes, F. X. 2007, ApJ, 655, L93
- Chou et al. (1993) Chou, W.-T., Warburton, E. K., & Brown, B. A. 1993, Phys. Rev. C, 47, 163
- Cohen & Kurath (1967) Cohen, S., & Kurath, D. 1967, Nuclear Physics A, 101, 1
- Feltzing et al. (2001) Feltzing, S., Holmberg, J., & Hurley, J. R. 2001, A&A, 377, 911
- Filippenko (1997) Filippenko, A. V. 1997, ARA&A, 35, 309
- Fuller et al. (1982) Fuller, G. M., Fowler, W. A., & Newman, M. J. 1982, ApJS, 48, 279
- Gallagher et al. (2005) Gallagher, J. S., Garnavich, P. M., Berlind, P., Challis, P., Jha, S., & Kirshner, R. P. 2005, ApJ, 634, 210
- Gallino et al. (1998) Gallino, R., Arlandini, C., Busso, M., Lugaro, M., Travaglio, C., Straniero, O., Chieffi, A., & Limongi, M. 1998, ApJ, 497, 388
- Gamezo et al. (2004) Gamezo, V. N., Khokhlov, A. M., & Oran, E. S. 2004, Phys. Rev. Lett., 92, 211102
- Gasques et al. (2005) Gasques, L. R., Afanasjev, A. V., Aguilera, E. F., Beard, M., Chamon, L. C., Ring, P., Wiescher, M., & Yakovlev, D. G. 2005, Phys. Rev. C, 72, 025806
- Hamuy et al. (2000) Hamuy, M., Trager, S. C., Pinto, P. A., Phillips, M. M., Schommer, R. A., Ivanov, V., & Suntzeff, N. B. 2000, AJ, 120, 1479
- Herwig (2005) Herwig, F. 2005, ARA&A, 43, 435
- Hillebrandt & Niemeyer (2000) Hillebrandt, W., & Niemeyer, J. C. 2000, ARA&A, 38, 191
- Höflich et al. (2002) Höflich, P., Gerardy, C. L., Fesen, R. A., & Sakai, S. 2002, ApJ, 568, 791
- Howell et al. (2007) Howell, D. A., Sullivan, M., Conley, A., & Carlberg, R. 2007, ApJ, 667, L37
- Iliadis et al. (2001) Iliadis, C., D’Auria, J. M., Starrfield, S., Thompson, W. J., & Wiescher, M. 2001, ApJS, 134, 151
- Iwamoto et al. (1999) Iwamoto, K., Brachwitz, F., Nomoto, K., Kishimoto, N., Umeda, H., Hix, W. R., & Thielemann, F. 1999, ApJS, 125, 439
- Izzard et al. (2007) Izzard, R. G., Lugaro, M., Karakas, A. I., Iliadis, C., & van Raai, M. 2007, A&A, 466, 641
- Jordan et al. (2007) Jordan, G. I., Fisher, R., Townsley, D., Calder, A., Graziani, C., Asida, S., Lamb, D., & Truran, J. 2007, ApJ Letters, submitted
- Kuhlen et al. (2006) Kuhlen, M., Woosley, S. E., & Glatzmaier, G. A. 2006, ApJ, 640, 407
- Langanke & Martínez-Pinedo (2001) Langanke, K., & Martínez-Pinedo, G. 2001, At. Data Nucl. Data Tables, 79, 1
- Lattanzio & Boothroyd (1997) Lattanzio, J. C., & Boothroyd, A. I. 1997, in American Institute of Physics Conference Series, Vol. 402, American Institute of Physics Conference Series, ed. T. J. Bernatowicz & E. Zinner, 85
- Leibundgut (2001) Leibundgut, B. 2001, ARA&A, 39, 67
- Lesaffre et al. (2006) Lesaffre, P., Han, Z., Tout, C. A., Podsiadlowski, P., & Martin, R. G. 2006, MNRAS, 368, 187
- Lesaffre et al. (2005) Lesaffre, P., Podsiadlowski, P., & Tout, C. A. 2005, MNRAS, 356, 131
- Liang et al. (2006) Liang, Y. C., Yin, S. Y., Hammer, F., Deng, L. C., Flores, H., & Zhang, B. 2006, ApJ, 652, 257
- Marion et al. (2006) Marion, G. H., Höflich, P., Wheeler, J. C., Robinson, E. L., Gerardy, C. L., & Vacca, W. D. 2006, ApJ, 645, 1392
- Marion & Fowler (1957) Marion, J. B., & Fowler, W. A. 1957, ApJ, 125, 221
- Mazzali & Podsiadlowski (2006) Mazzali, P. A., & Podsiadlowski, P. 2006, MNRAS, 369, L19
- Paczyński (1972) Paczyński, B. 1972, Astrophys. Lett., 11, 53
- Phillips (1993) Phillips, M. M. 1993, ApJ, 413, L105
- Pinto & Eastman (2000) Pinto, P. A., & Eastman, R. G. 2000, ApJ, 530, 744
- Piro & Bildsten (2008) Piro, A. L., & Bildsten, L. 2008, ApJ, 673, 1009
- Plewa et al. (2004) Plewa, T., Calder, A. C., & Lamb, D. Q. 2004, ApJ, 612, L37
- Ramírez et al. (2007) Ramírez, I., Allende Prieto, C., & Lambert, D. L. 2007, A&A, 465, 271
- Reeves & Salpeter (1959) Reeves, H., & Salpeter, E. E. 1959, Physical Review, 116, 1505
- Rolfs & Rodney (1988) Rolfs, C. E., & Rodney, W. S. 1988, Cauldrons in the cosmos: Nuclear astrophysics (Chicago, IL: University of Chicago Press)
- Röpke et al. (2006) Röpke, F. K., Gieseler, M., Reinecke, M., Travaglio, C., & Hillebrandt, W. 2006, A&A, 453, 203
- Rowland et al. (2004) Rowland, C., Iliadis, C., Champagne, A. E., Fox, C., José, J., & Runkle, R. 2004, ApJ, 615, L37
- Stein et al. (1999) Stein, J., Barkat, Z., & Wheeler, J. C. 1999, ApJ, 523, 381
- Stein & Wheeler (2006) Stein, J., & Wheeler, J. C. 2006, ApJ, 643, 1190
- Sullivan et al. (2006) Sullivan, M., Le Borgne, D., Pritchet, C. J., Hodsman, A., Neill, J. D., Howell, D. A., Carlberg, R. G., Astier, P., Aubourg, E., Balam, D., Basa, S., Conley, A., Fabbro, S., Fouchez, D., Guy, J., Hook, I., Pain, R., Palanque-Delabrouille, N., Perrett, K., Regnault, N., Rich, J., Taillet, R., Baumont, S., Bronder, J., Ellis, R. S., Filiol, M., Lusset, V., Perlmutter, S., Ripoche, P., & Tao, C. 2006, ApJ, 648, 868
- Timmes et al. (2003) Timmes, F. X., Brown, E. F., & Truran, J. W. 2003, ApJ, 590, L83
- Timmes & Woosley (1992) Timmes, F. X., & Woosley, S. E. 1992, ApJ, 396, 649
- Tremonti et al. (2004) Tremonti, C. A., Heckman, T. M., Kauffmann, G., Brinchmann, J., Charlot, S., White, S. D. M., Seibert, M., Peng, E. W., Schlegel, D. J., Uomoto, A., Fukugita, M., & Brinkmann, J. 2004, ApJ, 613, 898
- Woosley et al. (2007) Woosley, S. E., Kasen, D., Blinnikov, S., & Sorokina, E. 2007, ApJ, 662, 487
- Woosley et al. (2004) Woosley, S. E., Wunsch, S., & Kuhlen, M. 2004, ApJ, 607, 921
- Yakovlev et al. (2006) Yakovlev, D. G., Gasques, L. R., Afanasjev, A. V., Beard, M., & Wiescher, M. 2006, Phys. Rev. C, 74, 035803
- Zegers et al. (2007) Zegers, R. G. T., Brown, E. F., Akimune, H., Austin, S. M., van den Berg, A. M., Brown, B. A., Chamulak, D. A., Fujita, Y., Galès, S., Harakeh, M. N., Hashimoto, H., Hayami, R., Hitt, G. W., Itoh, M., Kawabata, T., Kawase, K., Kinoshita, M., Nakanishi, K., Nakayama, S., Okamura, S., Shimbara, Y., Uchida, M., Ueno, H., Yamagata, T., & Yosoi, M. 2007, Phys. Rev. C, submitted