Non-linear dynamics of absorption and photo-bleaching of dyes.
Abstract
The celebrated Lambert-Beer law of light absorption in photochromic media is only valid at low intensities of incident light and low concentration of chromophore. Here we address the generic problem of photo-absorption dynamics, experimentally studying the case of azobenzene isomerization. We show that the non-linear regime is very common and easy to achieve in many practical situations, especially in thick samples where the light depletes the chromophore in the first layers and can propagate through the medium with a sub-exponential law. Importantly, the crossover into the non-linear absorption regime only weakly depends on the dye concentration and solution viscosity. We experimentally quantify the characteristics of this peculiar optical response and determine the key transition rate constants.
Keywords: Lambert-Beer law — photobleaching — azobenzene — isomerization kinetics — absorption spectroscopy —
Introduction
Lambert-Beer law is well known and widely used in spectroscopy: it states that the light propagating in a thick absorbing sample is attenuated at a constant rate, that is, every layer absorbs the same proportion of light [1]. This can be expressed in a simple form as the remaining light intensity at a depth into the sample: where is the incident intensity and is a characteristic length which one calls the “penetration depth” of a given material. If an absorbing dye is dispersed in a solution (or in an isotropic solid matrix) this penetration depth is inversely proportional to the dye concentration. In this way it is possible to determine a dye concentration by experimentally measuring the absorbance, defined as the logarithm of intensity ratio , where is the thickness of the sample (the light path length), the concentration of the chromophore, and the universal length scale characteristic of a specific molecule/solvent. Thanks to Lambert-Beer law, UV-visible absorption spectroscopy is a useful and practical tool in many areas of science, for instance, in biology to determine the degree of purity of a protein or the concentration of DNA [2]. One should note that in chemistry and biology one often uses base-10 logarithm in defining the Absorbance, . If is in molar units, the constant of proportionality is called the “molar absorption coefficient” and it is inversely proportional to the characteristic length defined above.
However, this empirical law has limitations, and deviations are observed due to aggregation phenomena or electrostatic interactions between particles. More importantly, in photosensitive media much stronger deviations due to self-induced transparency, or photobleaching [3, 4] can occur. This effect has been reported in many biological systems like rhodopsin [5, 6], green fluorescent protein [7] or light harvesting complexes [8].
In most photosensitive molecules irradiation with light at a certain wavelength induces a conformational change (isomerization) from an equilibrium trans state where the benzene rings are far apart to a bent cis state where they are closer. The particular characteristic that makes azobenzene and its derivatives interesting is that the two isomers have different absorption spectra, primary absorption peaks in two different regions: the trans isomer absorbs around 320 nm, while the cis isomer at around 440 nm [9]. The position of the two peaks is sensitively changed by a variety of chemical groups attached to the basic azobenzene molecules, making azobenzene derivatives family a model material for study of many photo-chromic phenomena. Irradiation with light at the wavelength of the trans peak progressively depletes the molecules in this conformation. Effective trans-cis photo-bleaching of the first layers allows a further propagation of light into the sample and this leads to nonlinear phenomena which are interesting both from the theoretical [10, 11, 12, 13] and from the experimental point of view [14, 15, 16, 17].
The non-Lambertian propagation of light through a medium has important consequences for the analysis of photo-isomerization kinetics: when the photo-bleaching becomes important, the measured absorbance does not follow a simple (traditionally used) exponential law anymore. The isomerization process follows the first-order kinetics:
| (1) |
where is the fraction of isomers in the trans state, and are the cis-trans and trans-cis constants of photoisomerization, respectively, and are the intensities of light at the wavelengths which excite the two transitions, and is the rate of spontaneous thermal cis-trans isomerization. In the experiments described below we use an azobenzene derivative in which the trans-cis and cis-trans absorption peaks are widely separated and illuminating light monochromated at the trans-cis transition wavelength. In this case the stimulated cis-trans isomerization is negligible (that is, ) and the kinetic equation reduces to
| (2) |
In this equation the intensity , depending on the depth into the sample. It is convenient to define a non-dimensional parameter , which represent the balance of photo- and thermal isomerization at a given incident intensity . In this notation, the amount of molecules in the trans conformation in the photostationary state is simply
| (3) |
The change in intensity between subsequent layers of the absorbing material is proportional to the conversion of trans molecules in the layer. This theoretical problem has been studied by Statman and Janossy [12], and Corbett and Warner [13]. Neglecting the stimulated cis-trans isomerization (which is appropriate in our study, the model can be much simplified to give:
| (4) |
where D is the penetration depth, inversely proportional to concentration. Combining (4) and (3) the stationary-state light intensity at a depth is given by the relationship [13]
| (5) |
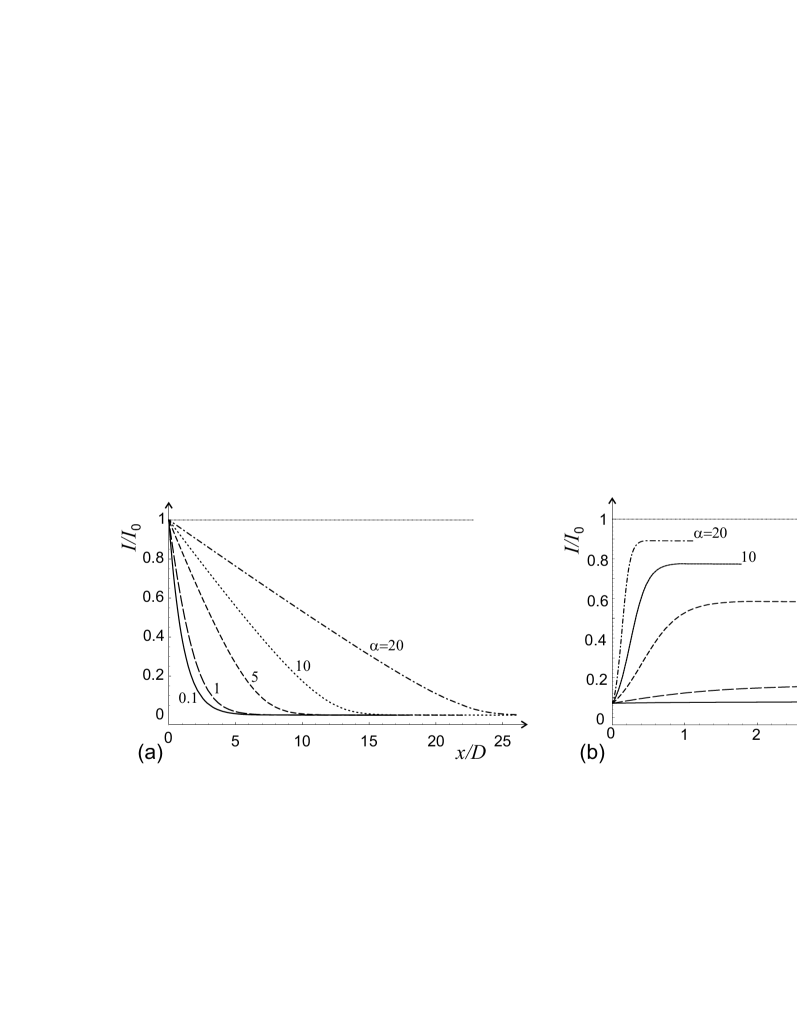
Figure 1(a) shows the intensity variation for various values of the parameter : if the incident intensity is low enough (), the Lambert-Beer law is valid and the decrease is exponential, but if the incident intensity is high the bleaching of the first layers becomes progressively relevant so that they become partially transparent to the radiation. The decay thus tends to become linear in the large part of the sample, .
In order to model the dynamics of photoisomerization, which is evidently inhomogeneous across the sample, equations (2) and (4) must be coupled to give
| (6) |
Solving this equation (see [18] for detail) leads to the integral expression for the intensity that we would detect from the sample of thickness at time :
| (7) |
The upper limit of this integral is the measurable absorbance from a sample of thickness . Figure 1(b) shows the resulting prediction for the time-evolution of intensity transmitted along the path . Note that at all curves converge to the Lambert-Beer , while at long times a significant portion of chromophore is bleached and transmitted intensity increases.
We should note that, however important the practical case of molecular isomerization might be, the problem of non-linear photo-absorption dynamics is much more generic. Even ordinary dye molecules that do not undergo conformational changes stimulated by photon absorption, still follow the same dynamic principles, only with electronic transitions in place of trans-cis isomerization. Therefore, the results of this paper should be looked upon in such a generic sense. In particular, the two key conclusions: that the crossover intensity into the non-linear photo-absorption regime is independent on dye concentration and the rate of the transition is independent on solvent viscosity, are probably completely general.
Materials and Methods
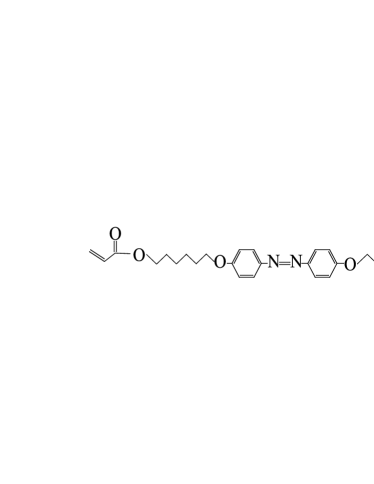
The photochromic derivative 4’-hexyloxy-4-((acryloyloxy)hexyloxy)-azobenzene (abbreviated as AC6AzoC6) was synthesized in our lab by Dr. A.R. Tajbakhsh. The molecular structure is shown in figure 2 and the synthesis described in [19]. The absorption spectrum of the molecule has a peak centered at 365 nm, characteristic of the trans state, and a peak at 440 nm characteristic of the cis state. We deliberately choose this molecule with widely separated absorption peaks to be able to unambiguously monitor the kinetics of trans-cis transition.
The illumination was provided by a Nichia chip-type UV-LED, whose output power was accurately regulated by a power supply. The spectrum of emission of the light is centered at 365 nm (near the absorption maximum of our azobenzene derivative) and is about 10 nm wide. The LED light was attenuated by passing through a black tube of controlled length, placed in front of a quartz cuvette with 1 cm optical path. We determined the power density of light incident on the sample by calibration against the LED input current , the illumination cone angle of the LED (132∘) and the illuminated area at the fixed distance to the sample (20 cm), giving the intensity . Several values of intensity were used in reported measurements, ranging between and .
For light absorbtion measurements of a Thermo-Oriel MS260i spectrometer (focal length 260mm) was used. A shutter was placed in front of the lamp so that the sample can be rapidly screened from the light source. An liquid lightguide conducted the light from the cuvette to the spectrometer, through a 50 m slit and the Andor linear-array CCD camera connected to a computer. The camera allowed a rate as fast as 0.021 s per frame. Before every absorption experiment, a background and a reference spectra were collected: the background is the spectrum without the illumination, and the reference is the spectrum collected with the LED illuminating the cuvette filled with plain solvent without the chromophore. The absorbance is then calculated from the counts of the detector as:
All experiments were carried out at room temperature in the dark.
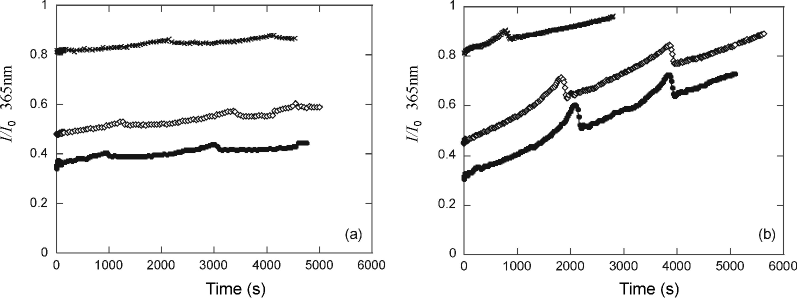
For our detailed dynamic experiments, a very important issue was the viscosity of the solution. In the earlier work [19] we have shown that solvent viscosity has no significant effect on the trans-cis transition rate. However, at high illumination intensity we have encountered an unexpected problem. Figure 3 shows that the transmission of light through a low-viscosity dye solution (in pure toluene) displays a characteristic oscillatory feature. Detailed analysis of this phenomenon is beyond the scope of this paper. Whether the oscillations are linked to the local convection due to the heating of the sample spot [20] or to the diffusion of the less dense cis molecules – or whether they are intrinsic to the non-linear photochemical process [21] – is not clear at this stage and would need further investigation.
In order to avoid this difficulty, the dye solutions were prepared in a mixture of toluene and polystyrene of high molecular weight (Mw=280000), both purchased from Sigma-Aldrich and used without further purification. Adding polystyrene increases the viscosity of the solution by over 2 orders of magnitude, and in this way prevents fluid motion in the cuvette on the time scales of our measurements. Polystyrene-toluene solutions were prepared at a fixed weight ratio of 37.5wt%.
In all cases it was important to verify that the dye concentration remained in a range where, at time , the linear proportionality between absorbance and concentration (Lambert-Beer law) held. This is important because the concentration of molecules in the trans state at every instant was determined from the absorbance at 365 nm. Absorbance was measured at several concentrations. The deviation from linearity started at , which corresponds to the dye weight fraction of (3 wt%) in our 1 cm cuvette. After this point, aggregation effects start playing a role and the basic Lambert-Beer law is no longer valid, undermining the theoretical relationship given by the equation (7). We always kept the concentrations below this value, so that the linearity at was maintained, with where the penetration depth is inversely proportional to chromophore concentration, expressed as weight fraction, with m.
We prepared three different dye solutions with (non-dimensional) weight fractions , and , resulting in the values of penetration depth mm, mm and mm, respectively (the sample thickness was kept constant at mm).
Every point of the spectrum was collected as an average of 100 measurements. All isomerization reactions were followed for several hours, until a photostationary state was reached. The measurements were repeated at different illumination intensities (regulated with the power supply) and at different dye concentrations.
Results and discussion
A basic characteristic of the photoisomerization problem is the rate of spontaneous thermal cis-trans isomerization . For a given azobenzene derivative, at fixed (room) temperature and sufficiently low dye concentrations to avoid self-interaction, this rate is approximately the same for all our solutions. We measured this rate after monitoring the relaxation of the spectrum after the illuminating LED is switched off (see [19] for detail) and obtained (or the corresponding relaxation time of s).
In order to test the predictions of the theory, dynamic absorption measurements were performed for different dye concentrations and different light intensities. Taking the equation (7) this is equivalent to changing (where is inversely proportional to the dye concentration) and , which is proportional to the incident intensity . With this experimental setup it was possible to follow all the isomerization kinetics and thus the time dependence of .
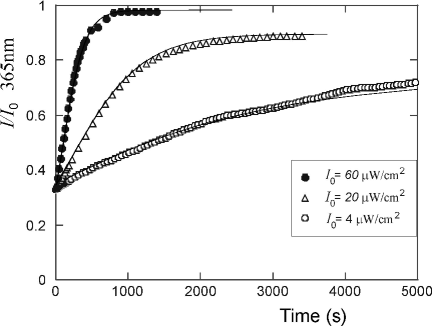
At time the absorption follows the Lambert-Beer law, which guarantees the proportionality between the absorbance and the dye concentration. In figure 4 the representative experimental results are shown for the solution with the highest chromophore concentration ( mm,leading to ) and three values of incident intensity. One finds that all curves converge to the same initial value corresponding to the , which for this concentration means quite a low transmission (). The classical Lambert-Beer would correspond to this value remaining time-independent. We fit the data with the theoretical model given by equation (7) where we input the values of and , leaving only free. Two data sets at higher intensity show the transmitted reach saturated value. In these case the fit is confident because we have to match both the slope and the amplitude of the curve. We obtain for and for , the ratio of which is close to expected . For the low-intensity irradiation, although the deviation from the Lambert-Beer law is evident, our fitting is not reliable because we did not obtain the intensity saturation in a reasonable time of experiment.
At lower concentration of chromophore, corresponding to mm and , figure 5 shows the similar features of the non-linear effect. Only at higher irradiation intensities we could achieve the saturation and the steady-state value corresponding to the solution of equation (5). The change of curvature, notable in figures 1)(b) and 4, is not so clear here even at the highest . However, in the comparative analysis of data we now take a different approach. Assuming all the parameters for the curves are now known ( and from independent measurements, and from the fitting in figure 4), we simply plot the theoretical equation (7) on top of the experimental data. For the low-intensity curve we take , which is a 1/5 fraction of the value for the highest assuming the linearity. It is clear that the theory is in excellent agreement with the data.
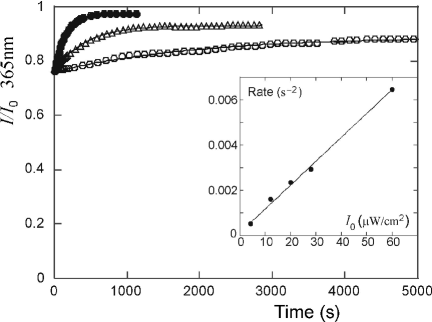
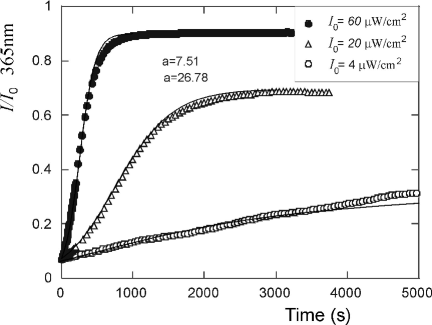
Finally, we examine the dynamics of non-linear absorption at low dye concentration ( mm, ) in figure 6. In this case the complicated integral equation (7) simplifies dramatically [18], since at small the difference between and (which is the range of integration in (7), is also small. The integration can then be carried out analytically, giving
| (8) |
which gives in the stationary state the correct solution of equation (5) approximated at small :
More importantly, we also see that that the rate of the process described by the approximation (8) is given by the simple exponential, . This is in fact the rate originally seen in the kinetic equation (2). Therefore, we now fit the family of experimental curves in figure 6 by the simple exponential growth and then analyze the relaxation rates obtained by this fit. The inset in figure 6 plots these rates for all the values we have studied. A clear linear relation between the relaxation rate and allows us to independently determine the molecular constant: .
Conclusions
The main conclusion of this paper is that one has to be cautious with the classical concept of light absorption, represented by the Lambert-Beer law. The question is not about more complicated multi-particle effects at high concentration of photo-sensitive molecules in the system: obviously for very high absorbance values one does not expect linearity. Importantly, even at very low concentrations (corresponding in our case to the low ratio) the illumination intensity above a certain crossover level would always produce a non-linear dynamical effect equivalent to the effective photo-bleaching, increasing the effective transmittance of the sample. The crossover is expressed by the non-dimensional parameter and is, therefore, an intrinsic material parameter of every chromophore molecule, but not dependent on the dye concentration. Note that the thermal cis-trans isomerization rate is strongly temperature dependent, influencing the crossover intensity.
The experiments, carried out to quantify this dynamical effect, have confirmed the model predictions and demonstrate several linked features, especially pronounced in the high-concentration systems. The final saturation steady-state value of transmitted intensity (or the practically measured absorbance) is linked with the rate at which the steady state is reached. At high intensity of illumination one finds a characteristic sigmoidal shape, with the changing curvature of variation. Our experiments were deliberately carried out in a highly viscous solvent to eliminate the additional complexities caused by the possible local convection flows of different isomers, which are illustrated in figure 3. Certainly, a much more in-depth study will be required to take such effects into account.
It is important to emphasize that these results and conclusions are very general, not at all confined to the class of azobenzene or other photo-isomerizing molecules. All dyes are essentially systems with two long-lived energy levels and thus the non-linear kinetics of their absorption and saturation will obey the same rules as discussed in this paper.
Acknowledgments
We acknowledge the Cambridge Nanoscience Centre for allowing access to the Oriel fast spectrometer and A.R. Tajbakhsh for synthesizing the azobenzene derivative used in this study. Useful discussions with D. Corbett, J. Huppert and M. Warner are gratefully appreciated. This work has been supported by EPSRC and Mars U.K.
References
- [1] Jaffe HH, Orchin M (1962) in Theory and applications of ultraviolet spectroscopy (Wiley, New York).
- [2] Serdyuk IN, Zaccai NR, Zaccai J (2007) in Methods in molecular biophysics(Cambridge University Press, Cambridge UK).
- [3] McCall SL, Hahn EL (1967) Self-induced transparency by pulsed coherent light Phys.Rev.Lett 18: 908-912.
- [4] Armstrong JA (1965) Saturable optical absorption in phthalocyanine dyes J.Appl.Phys. 36: 471-473.
- [5] Armstrong JA (1965) Saturable optical absorption in phthalocyanine dyes J.Appl.Phys. 36: 471-473.
- [6] Merbs, SL, Nathans, J (1992) Photobleaching difference absorption spectra of human cone pigments- quantitative ananlysis and comparison to other methods Photochem. Photobiol. 56: 869-881.
- [7] Henderson JN, Ai HW, Campbell RE, Remington SJ (2007) Structural basis for reversible photobleaching of a green fluorescent protein homologue Proc.Natl.Am.Sci.USA 104: 6672-6677.
- [8] Bopp MA, Jia YW, Li LQ, Cogdell RJ, Hochstrasser RM (1997) Fluorescence and photobleaching dynamics of single light-harvesting complexes Proc.Natl.Am.Sci.USA 94: 10630-10635.
- [9] Rau H (1990) in Photochemistry and Photophysics, eds Rabek JF (CRC Press, Boca Raton) pp 119-142.
- [10] Andorn M, Bar-Eli KH (1971) Optical bleaching and deviations from Lambert-Beer’s law illuminated with a ruby laser. I. Cryptocyanine solutions. J.Chem.Phys. 55: 5008-5016.
- [11] Berglund AJ (2004) Nonexponential statistics of fluorescence photobleaching J.Chem.Phys. 121: 2899-2903.
- [12] Statman D, Janossy I (2003) Study of photoisomerization of azo dyes in liquid crystals J.Chem.Phys. 118: 3222-3232.
- [13] Corbett D, Warner M (2007) Linear and Nonlinear Photoinduced Deformations of Cantilevers Phys.Rev.Lett 99: 174302.
- [14] Meitzner GD, Fischer DA (2002) Distortions of fluorescence yield X-ray absorption spectra due to sample thickness Microchem.J. 71: 281-286.
- [15] Barrett CJ, Mamiya J, Yager KG, Ikeda T (2007) Photo-mechanical effects in azobenzene-containing soft materials Soft Matter 3: 1249-1261
- [16] Harris KD, Cuypers R, Scheibe P, van Oosten CL, Bastiaansen CWM, Lub J, Broer JD (2005) Large amplitude light-induced motion in high elastic modulus polymer actuators J.Mater.Chem. 15: 5043-5048.
- [17] van Oosten CL, Harris KD, Bastiaansen CWM, Broer DJ (2007) Glassy photomechanical liquid-crystal network actuators for microscale devices Eur. Phys. J. E 23: 329 336.
- [18] Corbett, D., Warner, M. (2007) The dynamics of nonlinear optical absorption http://arxiv.org/abs/0712.1772
- [19] Serra F, Terentjev EM (2007) Effects of solvent viscosity and polarity on the isomerization of azobenzene Macromolecules, accepted.
- [20] Nitzan A, Ross J (1973) Oscillations, multiple steady states, and instabilities in illuminated systems J.Chem.Phys. 59: 241-250.
- [21] Borderie B, Lavabre D, Micheau JC, Laplante JP (1992) Nonlinear dynamics, multiple steady states, and oscillations in photochemistry J.Phys.Chem. 96: 2953-2961.