On why the Iron K-shell absorption in AGN is not a signature of the local Warm/Hot Intergalactic Medium
Abstract
We present a comparison between the 2001 XMM-Newton and 2005 Suzaku observations of the quasar, PG 1211+143 at . Variability is observed in the 7 keV iron K-shell absorption line (at 7.6 keV in the quasar frame), which is significantly weaker in 2005 than during the 2001 XMM-Newton observation. From a recombination timescale of years, this implies an absorber density cm-3, while the absorber column is cm-2. Thus the sizescale of the absorber is too compact (pc scale) and the surface brightness of the dense gas too high (by 9-10 orders of magnitude) to arise from local hot gas, such as the local bubble, group or Warm/Hot Intergalactic Medium (WHIM), as suggested by McKernan et al. (2004, 2005). Instead the iron K-shell absorption must be associated with an AGN outflow with mildly relativistic velocities. Finally we show that the the association of the absorption in PG 1211+143 with local hot gas is simply a coincidence, the comparison between the recession and iron K absorber outflow velocities in other AGN does not reveal a one to one kinematic correlation.
keywords:
accretion, accretion discs – atomic processes – X-rays: galaxies1 Introduction
The cosmological requirement that half the baryons in the Universe are in a warm/hot intergalactic medium (WHIM) has motivated UV and X–ray absorption line studies to detect this otherwise invisible gas, using absorption against a bright AGN to probe the line of sight material (Bregman 2007). However, most AGN (except blazars) have intrinsic columns of warm absorbing gas in their nuclei, and the fact that this is generally connected to a nuclear outflow (Blustin et al 2005) complicates separating this intrinsic absorption from extrinsic line–of–sight material using velocity information. Nonetheless, various studies have looked for absorption lines (predominantly OVII/VIII) as signatures of the WHIM, though all current detections are more likely to be associated with material in our Galactic halo or Local Group (Bregman & Lloyd–Jones 2007). These have velocities within a few hundred km/s of the local standard of rest, and indicate columns of OVII/VIII cm-2, equivalent to Hydrogen columns of cm-2.
Much more controversial was the potential association of substantially higher columns of gas to such local material. McKernan et al (2004; 2005) noticed that several AGN with strong He– or H–like Fe absorption features had these lines at energies which were approximately consistent with the local standard of rest. For any single object the approximate match between the putative blueshifted outflow velocity and the galaxy redshift could be coincidental, but McKernan et al (2004; 2005) pointed out three AGN showing this trend, with redshifts spanning (MCG–6–30–15, PG1211+143 and PDS 456). However, the derived columns of cm-2 are high even for an intrinsic AGN outflow (Pounds et al 2003, hereafter P03; Reeves et al 2003). If these are instead of local origin then it requires a tremendously significant change to our understanding of the Galactic halo environment (McKernan et al 2004; 2005).
Here we use new Suzaku data to show that the highly ionised Fe absorption in PG 1211+143 is variable on a timescale of years. This conclusively demonstrates that it is intrinsic to the AGN, and not associated with our Galaxy or Local Group. We collate recent results to show that this is also the case for most other AGN with strong Fe K absorption lines, showing that powerful outflows are associated with luminous accretion flows.
2 The ionised absorption in PG 1211+143
Chandra and XMM–Newton gratings gave the first high resolution X–ray spectra of the warm absorbers in AGN (e.g. Blustin et al 2005, McKernan, Yaqoob & Reynolds 2007). However, only the Chandra HETGS can cover the Fe K region, and this has very small effective area. Thus most of the information on these absorption lines are from the large effective area, moderate resolution CCD’s on XMM-Newton. These showed that some powerful AGN have strong absorption lines at 7 keV (observed frame) associated with large columns of highly ionised iron (PG 1211+143: P03; Pounds & Page 2006, hereafter PP06; PDS456: Reeves et al 2003).
The results on PG 1211+143, at a redshift of , were initially controversial. P03 claimed that the dip in the spectrum at keV was an absorption line, which they initially identified H–like Fe K (6.97 keV, lab–frame). Given the source redshift this requires an outflow velocity of km/s i.e. 0.08c assuming an origin in the AGN. Other, weaker but still significant absorption lines in the CCD spectra at 2.68 and 1.47 keV could also be interpreted as arising from material with the same outflow velocity if these are from H–like S and Mg K, respectively. (P03, PP06). The higher resolution RGS instrument also shows lines from lower Z elements at low energies. P03 identified these with transitions which required similarly high velocities as the high ionisation material, while Kaspi & Behar (2006) used different identifications to obtain a lower velocity outflow solution for these lines.
Nonetheless, the origin of the RGS features is not the major issue. Only the CCD’s on XMM-Newton can show the existence of material which is so highly ionised that heavy elements (S, Mg, Fe) are predominantly He– or H–like. Surprisingly, Kaspi & Behar (2006) identified the S and Mg K-shell lines with weaker He-like K lines (with little velocity offset), instead of the blue-shifted H-like K transitions, which begs the question as to why the corresponding stronger K lines are not seen. These authors also model the Fe K absorption in the 2001 XMM-Newton data with an edge at 7.27 keV (rest frame) of optical depth , corresponding to a large column ( cm-2) of very low ionisation state matter (Fe VII/VIII); this should have substantial low energy absorption which is clearly not present in the data. As we show below, accounting for any low ionisation absorption (via partial covering) in a self consistent photoionisation model does not remove the requirement for the blue-shifted highly ionised iron K absorber.
The only self–consistent option for the features around 7 keV in the XMM-Newton data is K absorption lines from H– or He–like iron. This requires a large blueshift (0.08c or 0.14c respectively) if the absorption is intrinsic to the AGN, with the implication being that the kinetic energy associated with this material can dominate the AGN energetics (Pounds & Reeves 2007).
3 Data Reduction
3.1 Suzaku Analysis
PG 1211+143 was observed by Suzaku (Mitsuda et al. 2007) between 24-27 November 2005. In this paper we discuss data taken with the 4 XIS (X-ray Imaging Spectrometer; Koyama et al. 2007) CCDs. Events files from official version 2.0 of the Suzaku pipeline processing were used. The PG 1211+143 Suzaku event files were screened using identical criteria to those described in Reeves et al. (2007) for the Suzaku observation of MCG -5-23-16.
Subsequently source spectra from the XIS CCDs were extracted from circular regions of 2′ radius centred on the source, in the off-axis HXD nominal pointing position. Background spectra were extracted from 4′ circles offset from the source region, avoiding the calibration sources on the corners of the CCD chips. XIS response files (rmfs) and ancillary response files (arfs) were generated using the xisrmfgen and xissimarfgen scripts including correction for the hydrocarbon contamination on the optical blocking filter (Ishisaki et al. 2007). A net XIS source exposure of 97.5 ks was obtained for each of the 4 XIS chips. The 3 front illuminated XIS chips (XIS 0,2,3) were used in this paper, as they have the greatest sensitivity at iron K. These chips were found to produce consistent spectra within the statistical errors, so the spectra and responses were combined to maximise signal to noise. The net source count rate for the 3 XIS combined was counts s-1, with background only 3% of the source rate. The XIS source spectrum was binned to a minimum of 100 counts per bin to enable the use of minimisation. Errors are quoted to 90% confidence for 1 parameter (i.e. ).
3.2 XMM-Newton Analysis
XMM-Newton observed PG 1211+143 twice, on 2001 June 15 for 53 ks and 2004 June 21 for 57 ks but this second exposure was affected by high particle background, resulting in only 25 ks of usable data. The EPIC-pn spectra used in this paper are identical to those described in PP06 and Pounds & Reeves (2007), which were processed using the XMM-Newton SAS v6.5 software. The EPIC-MOS spectra are consistent with the EPIC-pn, with the same 7 keV absorption feature present in the iron K band, as discussed by PP06.
4 A Comparison Between Suzaku and XMM-Newton Observations
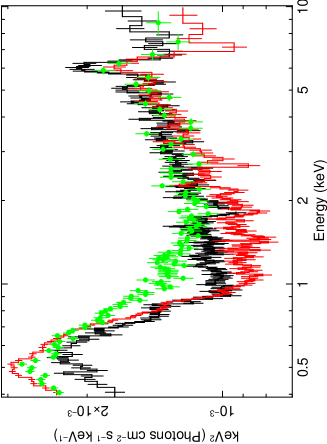
The 2001–2005 spectra from 0.4-10 keV are plotted in Figure 1, relative to a power-law continuum. The CCD’s on both XMM-Newton and Suzaku have similar responses so the data are directly comparable. A Galactic column of cm-2 is included in all the spectral fits. From the spectra, it is clear that there is little change in the overall spectral shape or normalisation. All 3 observations show a strong soft X-ray excess below 1 keV, though it is marginally more prominent during the 2001 XMM-Newton and 2005 Suzaku observations. However the deep iron K absorption feature observed at 7 keV in 2001 (Pounds et al. 2003) which is readily apparent even on this broad band spectral plot, is not present at the same strength in either the 2004 or 2005 data. This feature has varied significantly, ruling out a local origin for the absorber.
To quantify this, we use only the 2001 XMM-Newton and 2005 Suzaku observations as these have the best signal–to–noise. We fit the datasets simultaneously over the 2–10 keV bandpass to avoid the complexity associated with the soft X–ray excess. A power law with fixed Galactic absorption gives a very similar index between the two datasets as the continua are very similar (see Fig 1), but the overall fit is poor ( and for the XMM-Newton and Suzaku data, respectively). Fig. 2 shows the ratio of the data to the model for this fit, where as well as the obvious absorption feature in the XMM-Newton data, it is clear that both spectra have iron emission at keV. Adding a Gaussian line (with intrinsic width constrained to be equal across the two datasets) gives a line energy and equivalent width consistent between the two datasets, at keV and eV respectively. The intrinsic line width is resolved with a FWHM velocity of km s-1 i.e. typical of radii from the black hole.
| Model | Norm | line E (keV)b | (keV)b | EW (eV)b | line E (keV)c | (keV)c | EW (eV)c | ||
|---|---|---|---|---|---|---|---|---|---|
| cm-2 | Cov Frac | ||||||||
| po | 0.88 | ||||||||
| 0.99 | 744/403 | ||||||||
| Gau | 0.96 | ||||||||
| 1.07 | 441.4/393 | ||||||||
| Pcfxi | |||||||||
| 2.00 | 439.6/393 |
However, there is still significant curvature in the spectrum, as shown by the poor combined . This can be phenomenologically modelled by an additional Gaussian line, again with intrinsic width tied between the two datasets. This gives an acceptable fit, with , for a very broad line, with an intrinsic width of keV. The line energy is consistent between the two datasets at keV but its equivalent width is much larger in the XMM-Newton data than in the Suzaku data, at eV compared to eV (see Table 1), showing that there is more curvature in the XMM-Newton data. Since it is also the XMM-Newton data which show the line absorption feature, it is possible that this curvature is associated with the absorber, rather than with a broad, redshifted iron line from reflection from the very innermost (i.e. ) accretion disc.
We phenomenologically model this by partial covering of the source by partially ionised material (e.g. Miller et al., 2007; Turner et al., 2007), using a grid of XSTAR (v2.1l) photoionisation models based upon the publicly available tabulated ’grid 25’. This uses the Fe K treatment of Kallman et al. (2004), a turbulent velocity of km s-1 and solar abundances (Grevesse & Sauval 1998), while the illuminating continuum from 1–1000 Rydbergs has rather than , and spans a wider (but coarser) range of column (0.05 to 500 cm-2, 10 points) and (-3 to 6, 12 points). This partially ionised absorption is applied to a fraction of the assumed continuum, while the remaining () is not affected by this material. 111This model is publicly available as an additional model for XSPEC from http://heasarc.gsfc.nasa.gov/docs/xanadu/xspec/newmodels.html
We fix the redshift of the partial coverer to that of the AGN, and tie the ionisation parameter of this material (but not its covering fraction) between the two datasets. This model gives an equally good fit as the broad Gaussian model, with for . The column of the ionised material is consistent between the two datasets at cm-2, but the covering fraction is much larger in the XMM-Newton spectrum (80 per cent compared to 40 per cent), showing that the spectral curvature is more evident in these data. We use these two different models (hereafter termed Gau and Pcfxi, respectively) to assess the robustness of the change in the narrow absorption features to different continuum placement. Note the partial covering model is insensitive to the turbulence assumed, as its effect from 2–10 keV is to reproduce the continuum curvature in the spectrum, from bound–free absorption such as the iron K-shell edge.
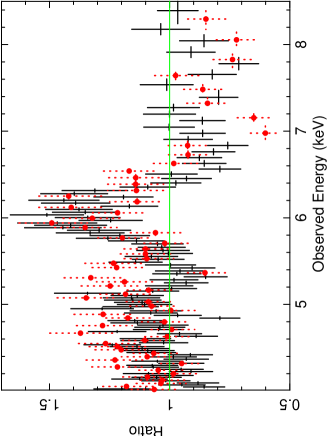
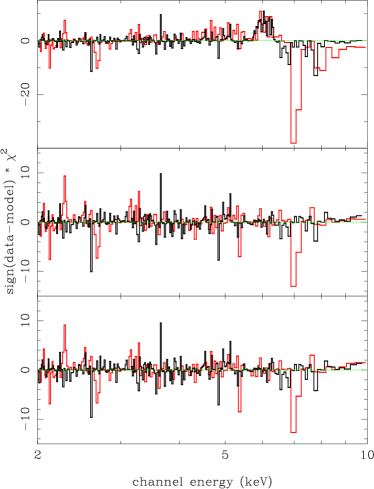
Fig 3 shows the residuals to the power-law, Gau and Pcfxi models, respectively. The absorption line is still present in the XMM-Newton data, even against the Pcfxi model which contains the iron K-shell edge and its associated absorption line structure (Figure 13, Kallman et al. 2004). We fit an additional inverted Gaussian of fixed width ( keV) to the XMM-Newton data and find that the fit is significantly improved, to and for the Gau and Pcfxi continuum models, respectively. The line energy and equivalent width in both is keV ( keV observed) and eV, respectively. We allow a line with the same energy and width in the Suzaku data, and find a 90% confidence upper limit to its equivalent width of eV.
5 The Origin of the Iron K shell Absorption
Thus the absorption line is significantly weaker in the 2005 Suzaku data, so the absorption has changed on a timescale of years. Either the column has physically moved, or its ionisation state has changed (or both). The former puts a limit on the size scale of 4 light years, unfeasibly small for any diffuse Galactic halo or intergalactic emission (which should be on kpc scales), while the latter sets a limit on the density through the recombination timescale, , where is the recombination rate, which is dependent on the temperature, T. For a WHIM origin, the absorption line must be associated with Fe XXVI in order that its energy matches that observed. Such material should also be collisionally ionised, and requires temperatures K in order to be the dominant ion. This gives a recombination rate of cm3 s-1 (e.g. Arnaud & Rothenflug 1985), so for this to be less than 4 years requires densities cm-3, which is 6 orders of magnitude above the typical density even for a local halo component (e.g. Bregman & Lloyd–Davies 2007).
We model the Fe K absorption line using the warmabs XSTAR photo-ionisation code incorporated into xspec, adopting solar abundances. We assume a turbulent velocity of 5000 km s-1, below the upper limit of km s-1 set by the observed intrinsic width of the line of keV. This gives a column of cm-2, with an ionisation parameter of at an observed redshift of i.e. implying an AGN outflow velocity of c. While the derived column is dependent on the turbulent velocity, the curve of growth is in the linear regime here, so increasing the turbulent velocity does not increase the equivalent width of the line, leading to a robust lower limit of cm-2.
The lower limit on the density, combined with the column density, can give an upper limit on the size scale of the absorber as . A huge column of cm-2 is required in order to produce an iron absorption line with equivalent width of 100 eV if the gas velocity is simply set by its temperature of K (Kotani et al. 2000; 2006) as expected from any local hot gas. Such a large column is inconsistent with the spectrum, as this produces a strong dip at 8–10 keV (rest frame) due to the Fe K-shell edge structure (Kallman et al 2004), which is not present in the data. Indeed from the lack of an iron K edge in PG 1211+143, this sets an upper limit to the column of cm-2 and requires that there must be substantial turbulent velocity ( km s-1 derived from the curve of growth) in excess of the thermal motions to model the line EW. This itself is inconsistent with a WHIM origin. With this, the upper limit on the absorber size scale is cm. This is unfeasibly low to be associated with even the smallest local diffuse hot gas, the kpc scale Galactic halo.
Another constraint on the properties of the material comes from the emission measure where is the volume, assuming that the gas is distributed evenly in a spherical shell at distance . The total bremsstrahlung luminosity is , so the surface brightness in solid angle is . For a solid angle of 1 arcmin sr this gives ergs s-1 cm-2 arcmin-2, i.e. brighter than the Crab in every square arcmin in X-rays. Indeed the observed upper limit to the diffuse sky surface brightness in the 3/4 keV band is counts s-1 arcmin-2 (Bregman & Lloyd–Davies 2007), corresponding to a flux of ergs s-1 cm-2 arcmin-2, 10 orders of magnitude below the predicted value.
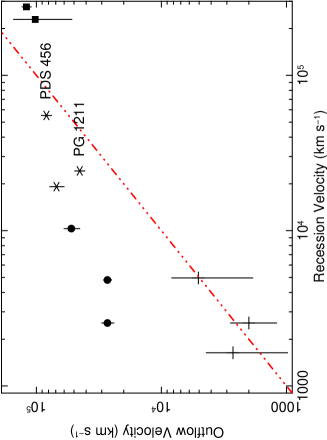
Thus the variability and column appear to rule out any sort of non-AGN origin for the absorbing material. The best fit identification by PP06 of the highly ionised absorption as being dominated by He–like Fe also rules out a local origin as the line is then not close to the rest wavelength of the transition, showing a blueshift with respect to the local frame of . This is because the Mg, Si and S K-shell absorption seen in the XMM-Newton CCD spectrum can be fit with the same layer of absorption if the ionisation state of iron is lower than H-like. This mismatch between the outflow velocity of the absorber and recessional velocity of the AGN is common. There are now many other AGN with blueshifted Fe K indicating an outflow, and we collate these from the literature in Fig. 4. Aside from the 3 low velocity examples in Figure 4, none of the AGN outflow velocities coincide with the recession velocity. In IC 4329a and MCG -5-23-16 the absorption lines are observed at 7.7 keV (Markowitz et al. 2006; Braito et al. 2007) inconsistent with the rest energy of any Fe K transition line. A further example is from the new 2007 Suzaku data from PDS456 (Reeves et al. 2007, in prep), which shows iron K absorption lines observed at 7.6 and 8.2 keV, inconsistent with local absorption from iron K. Indeed the iron K absorption features seen in high redshift BAL QSO’s are likewise very far from the iron K rest energies for local material (Chartas et al 2002, 2003).
6 Conclusions
We show that the observed variability in the absorption line in PG 1211+143 between the XMM-Newton and Suzaku data taken 4 years apart conclusively rules out a diffuse gas origin such as the local Galactic halo or WHIM. The gas must be associated with the AGN, as is further evidenced by its large column density in the XMM-Newton 2001 data which is far too high for local or intergalactic gas. The conclusive identification with the AGN, and the implausibility of any alternative line transition other than iron K means that the large outflow velocity of c is inescapable. Such material is predicted from the winds which are produced from luminous accretion discs in AGN (Proga & Kallman 2004).
The coincidence of the outflow velocity with the source redshift in these data is not significant. Other powerful AGN which show iron K absorption features clearly show a range of (intrinsic and observed) velocities, removing the apparent trend for the line energy to appear at the rest energy for these transitions. Thus it is clear that this material is a mildly relativistic outflow from the AGN. Its high velocity means that its kinetic energy can be comparable to the bolometric radiated luminosity of the AGN (King & Pounds 2003; Pounds et al 2003; Pounds & Reeves 2007), yet its high ionisation means that it is effectively invisible in all other wavebands. While such a major component of AGN energetics could go unnoticed in individual objects, there is increasing evidence that strong AGN feedback controls galaxy formation and evolution. Mildly relativistic winds provide more efficient heating than the jet due to their impact on a larger area, so these highly ionised disc winds may be the key to understanding the growth of structure in the Universe.
References
- [1] Arnaud M., Rothenflug R., 1985, A&AS, 60, 425
- [2] Blustin A.J., Page M.J., Fuerst S.V., Branduardi-Raymont G., Ashton C. E., 2005, A&A, 431, 111
- [3] Braito V., et al., 2007, ApJ, 670, 978
- [4] Bregman J.N., 2007, ARA&A, 45, 221
- [5] Bregman J.N., Lloyd-Davies E.J., 2007, ApJ, 669, 990
- [6] Chartas G., Brandt W.N., Gallagher S.C., 2003, ApJ, 595, 85
- [7] Chartas G., Brandt W.N., Gallagher S.C., Garmire G.P., ApJ, 579, 169
- [8] Dadina M., Cappi M., Malaguti G., Ponti G., de Rosa A., 2005, A&A, 442, 461
- [9] Grevesse N., Sauval A.J., 1998, Space Sci. Rev., 85, 161
- [10] Ishisaki Y., et al., 2007, PASJ, 59, 113
- [11] Kallman T.R., Palmeri P., Bautista M. A., Mendoza C., Krolik J. H., 2004, ApJS, 155, 675
- [12] Kaspi S., Behar E., 2006, ApJ, 636, 674
- [13] Kotani, T., et al., 2000, ApJ, 539, 413
- [14] Kotani, T, et al., 2006, ApJ, 651, 615
- [15] King A.R., Pounds K.A., 2003, MNRAS, 345, 657
- [16] Koyama K., 2007, PASJ, 59, 23
- [17] Markowitz A., Reeves J.N., Braito V., 2006, ApJ, 646, 783
- [18] McKernan B., Yaqoob T., Reynolds C.S., 2007, MNRAS, 379, 1359
- [19] McKernan B., Yaqoob T., Reynolds C.S., 2005, MNRAS, 361, 1337
- [20] McKernan B., Yaqoob T., Reynolds C.S., 2004, ApJ, 617, 232
- [21] Miller L., Turner T.J., Reeves J.N., George I.M., Kraemer S.B., Wingert B., 2007, A&A, 463, 131
- [22] Miniutti G., Ponti G., Dadina M., Cappi M., Malaguti G., 2007, MNRAS, 375, 227
- [23] Mitsuda, K., et al., 2007, PASJ, 59, 1
- [24] Pounds K.A., Reeves J.N., 2007, MNRAS, 374, 823
- [25] Pounds K.A., Page K.L., 2006, MNRAS, 372, 1275
- [26] Pounds K.A., Reeves J.N., King A.R., Page K.L., O’Brien P.T., Turner M.J.L., 2003, MNRAS, 345, 705
- [27] Pounds K.A., King, A.R., Page K.L., O’Brien P.T., 2003b, MNRAS, 346, 1025
- [28] Pounds K.A., Reeves J.N., King A.R., Page K.L., O’Brien P.T., Turner M.J.L., 2003b, MNRAS, 345, 705
- [29] Proga D., Kallman T.R., 2004, ApJ, 616, 688
- [30] Reeves J.N., et al., 2007, PASJ, 59, 301
- [31] Reeves J.N., O’Brien P.T., Ward M.J., 2003, ApJ, 593, L65
- [32] Risaliti G., Bianchi S., Matt G., Baldi A., Elvis M., Fabbiano G., Zezas A., 2005, ApJ, 630, L129
- [33] Turner T.J., Miller L., Reeves J.N., Kraemer S.B., 2007, A&A, 475, 121
- [34] Young A.J., Lee J.C., Fabian A.C., Reynolds C.S., Gibson R.R., Canizares C.R., 2005, ApJ, 631, 733