Probing the centre of the large circumstellar disc in M 17††thanks: Based on observations collected at the European Southern Observatory, Chile., project nos. 73.C-0170, 73.C-0183 and 75.C-0852.
Abstract
We investigated the nature of the hitherto unresolved elliptical infrared emission in the centre of the 20 000 AU disc silhouette in M 17. We combined high-resolution band imaging carried out with NAOS/CONICA at the VLT with [Fe ii] narrow band imaging using SOFI at the NTT. The analysis is supported by Spitzer/GLIMPSE archival data and by already published SINFONI/VLT Integral Field Spectroscopy data. For the first time, we resolve the elongated central infrared emission into a point-source and a jet-like feature that extends to the northeast in the opposite direction of the recently discovered collimated H2 jet. They are both orientated almost perpendicular to the disc plane. In addition, our images reveal a curved southwestern emission nebula whose morphology resembles that of the previously detected northeastern one. Both nebulae are located at a distance of 1500 AU from the disc centre. We describe the infrared point-source in terms of a protostar that is embedded in circumstellar material producing a visual extinction of . The observed band magnitude is equivalent to a stellar mass range of adopting conversions for a main-sequence star. Altogether, we suggest that the large M 17 accretion disc is forming an intermediate to high-mass protostar. Part of the accreted material is expelled through a symmetric bipolar jet/outflow.
keywords:
stars: formation, circumstellar matter, pre-main sequence – infrared: stars – ISM: individual: M 171 Introduction
The processes forming high-mass stars are still not well understood. Although recent theoretical models require the presence of and the accretion from a circumstellar disc (Bonnell et al. 2001; Yorke & Sonnhalter 2002; Krumholz, Klein & McKee 2007), the direct observation of such a configuration is still missing.
During a systematic infrared study of the young star cluster NGC 6618 inside the H ii region M 17 (Omega Nebula), Chini et al. (2004) discovered an opaque silhouette, shaped like a flared disc at with a diameter of 20 000 AU against the bright background of the H ii region. It is associated with an optically visible hourglass-shaped nebula perpendicular to the silhouette plane. The optical spectrum of the nebula exhibits emission lines with blue-shifted absorption features indicating disc accretion.
Steinacker et al. (2006) successfully modelled the optical depth and the photon scattering of the silhouette at m and obtained a large circumstellar disc seen at an inclination angle of (almost edge-on). They found disc masses between 0.02 and depending on the assumed dust model and the distance. The mass range is in good agreement with the distance-scaled values by Sako et al. (2005) derived from their NIR (near infrared) extinction map. The distance has recently been determined to kpc on the basis of about 50 spectroscopically classified early-type stars (Hoffmeister et al., 2008) ruling out earlier estimates below 2 kpc that treated several unresolved high-mass binaries as single stars. The new spectro-photometric distance agrees well with previous studies based on multi-colour photometry ( kpc; Chini, Elsässer & Neckel, 1980) and radio data ( kpc; Russeil, 2003).
Independent of its mass, the M 17 silhouette is the largest disc found to date that is exhibiting accretion activity. In fact, Nürnberger et al. (2007) discovered a H2 jet emerging from the disc centre, also suggesting ongoing accretion.
At the disc centre, Chini et al. (2004) found an elliptical band emission of AU2. Likewise, Sako et al. (2005) describe the central object as an elongated compact infrared source. A faint emission of unknown nature is also visible in their [Ne ii] narrow band MIR (mid infrared) image at m.
Assuming that the central band flux found by Chini et al. (2004) originates from a single star at a distance of 2.1 kpc, the stellar mass may range between a few and , depending on the extinction model (Steinacker et al., 2006). Sako et al. (2005) explained their results in terms of an intermediate-mass object with a stellar mass of to . Their analysis was part of a larger survey of candidate silhouette objects in M 17 (Ito et al., 2008).
So far, both the mass and the temperature of the forming star within this spectacular disc remain under discussion. In this work, we present new data that provide further insight into the nature of the central protostellar object and constrain the possible mass range. We also discuss the detection of a possible counter-jet headed in the opposite direction of the H2 jet and a curved southwestern emission nebula that is geometrically symmetric to the northeastern one.
2 Observations and reduction
The narrow band imaging was done with SOFI (Finger et al., 1998) at the ESO NTT on La Silla, Chile, in April 2004. The [Fe ii] line at m was probed with a narrow band filter centred on m. In order to subtract the continuum from the spectral line data, we obtained images in an adjacent narrow band filter centred on m. The seeing limited spatial resolution is 09 (FWHM), the pixel size is 0288.
The adaptive optics imaging was carried out in July and August 2005 with NAOS/CONICA (Rousset et al., 2003; Hartung et al., 2003) at the ESO VLT. We used the CONICA S13 lens for the measurements providing a pixel resolution of and a field size of . The imaging was done with the L27 lens resulting in a pixel size of . While for the band the corresponding FOV was , band measurements only use the central pixels equivalent to a field size of . The effective spatial resolution is (FWHM). The photometric errors vary between mag and mag.
The Spitzer post-BCD data were taken from the GLIMPSE survey archive (, Benjamin et al.2003) based on an imaging campaign of the galactic plane using the IRAC camera (Fazio et al., 2004) on board the Spitzer infrared satellite (Werner et al., 2004).
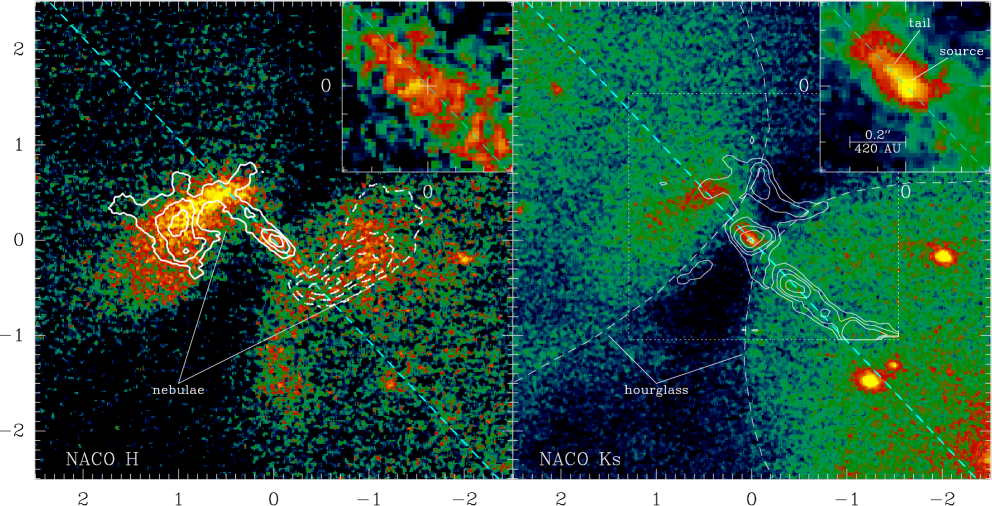
All data were reduced and analysed with IRAF and MOPSI; the NACO and band images are shown in Fig. 1. Among the NIR AO data, only the band image shows a point-source; at and the emission is diffuse and extended. It was not detected at all in the bands. Therefore, establishing a meaningful SED (spectral energy distribution) for the embedded source is difficult. We were able to produce adequate PSF models in the NACO bands by selecting 6 to 10 sufficiently bright stars also detected on the same frame for the subsequent PSF photometry. Within the errors, the PSF fit to the central point-source appeared circular. The surrounding fuzzy and somewhat scattered emission can be entirely attributed to the central ridge introducing a background pattern similar to what is visible in the band. Due to the absence of sufficiently bright PSF model stars in the NACO band, we had to perform aperture photometry. An aperture correction was applied to all the measurements. The results of the photometry are listed in Table 1.
Astrometric calibration of all but the NACO data is based on the 2MASS database. Since there are no 2MASS sources on the NACO frames, we used stars detected with ISAAC (Chini et al., 2004) in the vicinity of the disc for astrometry. We estimate the accuracy to be better than 01.
3 Results and discussion
3.1 The central point-source
| Point-source | NE tail | |||
|---|---|---|---|---|
| [m] | [mag] | [Jy] | [mag] | [Jy] |
| 1.27 | ||||
| 1.66 | ||||
| 2.18 | ||||
| 3.80 | ||||
| 4.78 | ||||
The band image in Fig. 1 for the first time resolves the elliptical infrared emission at the disc centre into a point-source with a FWHM of 01 (210 AU) and a tail that extends to the northeast. We regard the point-source as a single object, although close high-mass binaries can be separated by AU (Krumholz & Thompson, 2007). The peak of the tail emission is separated by 008 (170 AU) from the point-source, defining a line that we interpret as the outflow axis (see Sect. 3.2). It appears tilted by from the disc symmetry axis. In the band, we only detect diffuse emission without any indication for a point-source.
The symmetry of the source-jet-disc configuration is striking. In particular the link between the source and the jet seems obvious. The point-source bisects the line between the peak emission of the northeastern nebula coinciding with a weak H2 feature and the first strong maximum of the jet to the southwest (Fig. 1, right panel). If chosen as the symmetry centre of the bipolar nebula, both wings match perfectly when rotated by (Fig. 1, left panel).
Assuming the point-source emission stems from a reddened stellar photosphere at a distance of 2.1 kpc, we can combine our photometry with the extinction estimate of Steinacker et al. (2006). They pursued the so far most sophisticated approach to model the spatial distribution of the optical depth of the disc at m up to an outer radius of 10 000 AU including photon scattering effects. Their result of () toward the disc centre is a lower limit, because (a) the unresolved inner disc at radii of AU were excluded from the model, and (b) the model accounts for the optical depth of the disc alone without the influence of interstellar and intra-cluster foreground extinction. The latter contributions are estimated by analysing the NIR colours of stars in the vicinity of the disc derived from the previously published ISAAC data (Chini et al., 2004). Typical extinction values off the disc plane are about . As a result, the sum of the foreground and disc extinction toward the disc centre amounts to . Ito et al. (2008) find an absolute upper limit of , but this is probably biased by their detection limit. It contradicts previous estimates giving extinction values of for individual stars in this area (Chini & Wargau, 1998; Jiang et al., 2002; Hoffmeister et al., 2006).
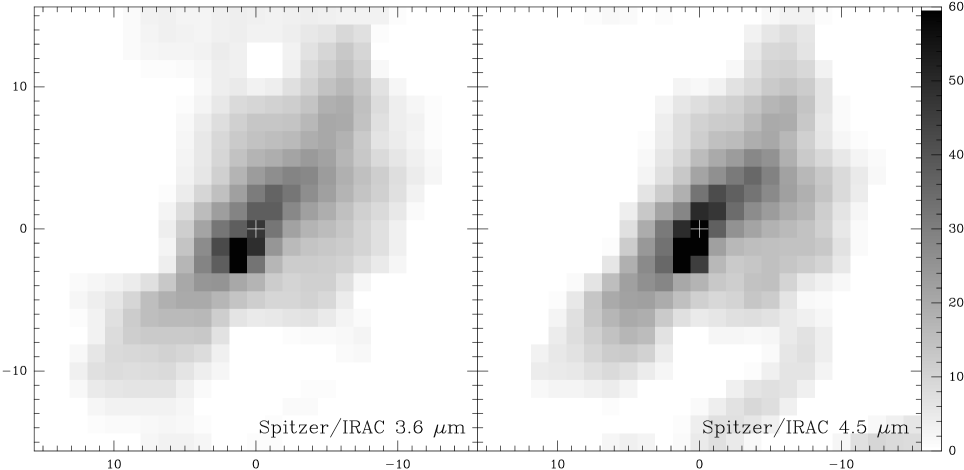
We also estimated the extinction towards the disc centre independently by creating an extinction map employing the method described by Siebenmorgen & Krügel (2000). It is based on a differential photometry of the attenuating material (the disc) and a uniform background radiation (the H ii region). Considering a uniform foreground extinction across the extent of the disc, the measured optical depth is purely due to the material inside the disc, because other contributions along the line of sight like interstellar and intra-cluster extinction or emission cancel out. Using Spitzer/GLIMPSE archival data at and m, we determined the spatial distribution of the optical depth by analysing the attenuation of the background emission originating from the ionised gas. This approach is comparable to the NIR extinction maps of Sako et al. (2005) and Ito et al. (2008), but it has the advantage of being less susceptible to scattering effects because of the larger wavelengths covered by the Spitzer data. The optical depth estimates were converted to visual extinction values (Flaherty et al. 2007; Román-Zúñiga et al. 2007; Nielbock, Chini & Müller 2003). In the resulting maps (Fig. 2), the extinction maximum is offset by (6300 AU) southeast from the central point-source. Along the line of sight toward the disc centre, we obtain a total extinction solely caused by the disc material of , half of which is expected to be the disc extinction toward the centre. The true peak extinction is probably even higher because of the spatial averaging resulting from the limited resolution of the Spitzer data. This leads to a blending of extinction and emission features resulting in a lower limit estimate of the extinction. Ito et al. (2008) find similar displacements between the extinction maximum of candidate silhouette objects and the suggested embedded YSO, which they attribute either to a migration of the YSO or its off-centred formation. However, it is still possible that those identified silhouette structures are not necessarily related to the nearby YSOs. After adding the foreground extinction, our results from the Spitzer extinction maps are consistent with the estimate based on the NIR modelling.
Using the estimate of mag as a lower limit to the extinction, the apparent magnitude of the point-source is equivalent to an absolute magnitude of a star having a spectral type of at least B8. In the case of a main-sequence star, this would correspond to a stellar mass of (Blum, Conti & Damineli, 2000). Although the reconstructed SINFONI H2 line image possesses a peak at the disc centre, the contribution of the H2 emission to the continuum flux is negligible. The continuum flux measured in the NACO filter (m) amounts to W m-2; the H2 S(1) and H2 S(1) lines that have been measured with SINFONI contain a continuum corrected line flux of W m-2. Thus, they contribute only % to the continuum flux in the filter. However, we cannot rule out any additional contamination by excess emission of spatially unresolved circumstellar material or accretion signatures close to the protostar.
Sako et al. (2005) present an image of this object obtained in the MIR using a narrow-band filter centred on the [Ne ii] line at 12.8 m. Although a faint elongated emission is detected at the disc centre, it does not contribute much to resolving the open question of the nature of the central star. Since emission from this line is commonly observed for circumstellar discs (e. g. Pascucci et al., 2007), it is not clear, how much of the detection is caused by continuum emission.
A strict upper mass limit is difficult to determine from the available data. Sako et al. (2005) argued that the missing radio continuum in the interferometric radio map of Felli, Massi & Churchwell (1984) establishes an upper mass limit of . However, this statement might not be valid, because the source is located in projection onto an ionisation front exhibiting large scale free-free emission that could cause confusion with any weak compact H ii source like an early-type star in the lower mass range. Furthermore, a very young and just developing ionised gas sphere (e. g. a hyper-compact H ii region) would be too small and too weak to be detected by its free-free emission (Kurtz, 2005).
In order to address this question, we analysed the NIR colours derived from the values and upper limits given in Tab. 1. Assuming the colour is entirely due to a reddened photosphere, the measured upper limit of can be used to set an upper limit on the mass of the protostar. Fig. 3 displays the parameter space of colours for given combinations of the visual extinction and the effective temperature of a main-sequence star. The colours were derived from Ducati et al. (2001), and the temperatures are assigned to spectral types and stellar masses according to Blum et al. (2000). The loci of a reddened main-sequence star with an apparent magnitude of is indicated by crosses, interpolated by a solid line. This diagram yields the following two results: First, for the previously determined lower extinction limit of the colour attained by extinction alone amounts to 4.9. Hence, any additional NIR colour excess must be less than . Second, the measured colour determines the upper extinction limit to . This constrains also the effective temperature to K which is equivalent to a spectral type just above B1, being in the mass range of about for a main-sequence star (Blum et al., 2000). In this way, we corroborate the upper mass limit given by Sako et al. (2005). At this point, we want to emphasise that not only the colours but also the photometry and upper limits in Tab. 1 are consistent with these estimates.
3.2 The jet emission
The collimated H2 jet detected by Nürnberger et al. (2007) originates at the disc centre and extends as far as 36 to the southwest. The SINFONI data suggest a blue-shifted motion. Correcting for the disc inclination of (Steinacker et al., 2006), a protostellar jet with a typical velocity of 100 km s-1 (Reipurth & Bally, 2001) would reach the current terminus within 365 years. The expected northeastern counter-jet was not detected by Nürnberger et al. (2007).
The NACO image (Fig. 1, right panel) gives a first hint for the existence of such a feature, because the position angle between the point source and the jet-like feature extending to the northeast agrees with the direction of the H2 jet. This alignment indicates that we either see the origin of the counter-jet or at least circumstellar matter entrained and heated by its interaction. The northeastern extension of the central H2 detection by SINFONI that coincides with the jet-like feature may be an indication for residual jet emission. Therefore, we suggest that the counter-jet might exist, but it is strongly extinguished by the circumstellar material. This agrees with the picture suggested by Steinacker et al. (2006) that the near side of the disc is inclined to the northeast and partly covers the latitudes above the disc plane. On the other hand, this jet may fail to produce detectable shocks due to a lack of dense material that has been cleared by the wind and radiation of the cluster OB stars that are mostly located on the northeastern side of the disc.
3.3 The bipolar nebula
The accretion disk is associated with a bipolar hourglass shaped structure (Chini et al., 2004). The northeastern cavity hosts an emission nebula that resembles the working surface of protostellar jets as seen in other outflows like HH 47 (Heathcote et al., 1996; Hartigan et al., 2005). Our new NACO band image shows a similar, but fainter feature inside the southwestern cavity. In the left panel of Fig. 1, we have superimposed the contours of the northeastern emission onto the southwestern nebula and vice versa after rotating them by . Besides a similar morphology, there is a symmetry of the peak emission with respect to the central point-source. Both nebulae have a projected distance of 1500 AU from the central object and their origins are located along an axis that matches the position angle of the star/jet system.
Using its full size at half maximum in the band, the northeastern nebula covers an opening angle of with respect to the central point-source; it has a projected length of 2500 AU (12) and a projected breadth of 840 AU (04). In the same area, the NACO data attain mag, mag and mag with the brightness peaking along the assumed jet direction. We find an band excess of to what would be expected for the thermal emission of a black body derived from the data. This can be explained either by a combination of scattering and extinction or by line emission.
Radiation from singly ionised iron – together with H2 – is the main coolant of shocked gas in the NIR (Caratti o Garatti et al., 2006). [Fe ii] lines are commonly observed in J shocks, where the H2 is completely dissociated (Hollenbach & McKee, 1989; Kumar et al., 2003). Therefore, it is a good candidate for contaminating the band continuum flux. However, apart from a spurious detection of [Fe ii] emission ahead of the northeastern nebula, in our NTT/SOFI narrow band data (not shown) it is strongly concentrated towards the disc centre. This seems to be a typical phenomenon for many protostellar jets (Itoh, 2001; Davis et al., 2006). Therefore, the origin of the strong band emission is probably not caused by [Fe ii].
Another more likely explanation is that the nebulae are scattered light reddened by extinction from the disc material. The spectroscopic accretion signatures (Chini et al., 2004) imply that most of the scattered photons originate from the disc centre. Stark et al. (2006) present Monte Carlo radiative transfer models of circumstellar discs around young stellar objects. They show that NIR colours of the disc centres affected by light scattering and extinction strongly depend on the infall rate, the inclination angle, and the cavity opening angle of the disc. Their models cover infall rates up to yr-1 producing exceptionally blue colours of for nearly edge-on discs. Assuming that the accretion rate of the large M 17 disc of about yr-1 (Nürnberger et al., 2007) is of the same order as the envelope infall rate, we would expect even bluer colours which is at least qualitatively consistent with our result of .
3.4 H2 emission at the disc surface
In the right panel of Fig. 1, we have superimposed contours of the SINFONI data of Nürnberger et al. (2007) to compare the highly resolved H2 S(1) emission with the continuum. Apart from the prominent emission from the disc centre and the southwestern jet, there is also molecular hydrogen emission at the position of the northwestern disc lane and – although much weaker – at the northeastern nebula. As the H2 emission in the disc seems to peak at its surface, an external excitation process like UV pumping might be in action. Indeed, PDRs (photo-dissociation regions) are known to possess a fair amount of molecular hydrogen just below its surface that can be excited by FUV (far ultraviolet, eV) radiation (Tielens & Hollenbach, 1985). The existence of such a PDR is also supported by the detection of emission in the Spitzer 8.0 m band that includes PAH bands (polycyclic aromatic hydrocarbon molecules).
Two possible sources for the exciting UV photons have to be considered: (a) the surrounding cluster stars, and (b) the embedded star in the disc centre itself. If excited by the surrounding cluster stars, one would expect the entire disc surface to be a PDR that would be detected by H2 line emission. However, because the size of the PDR is not only a function of the temperature but also of the density distribution inside the disc, an isotropic UV radiation field does not necessarily result in a uniform PDR. The major emission occurs at the northeastern side of the disc facing the hottest cluster stars. If the PDR is due to the embedded central object, a detailed analysis of the excitation process in the disc could help to further constrain the nature of the forming star.
4 Conclusions
With the new observations, we have further clarified the nature of the emission in the centre of the large M 17 disc and its associated nebula in the following aspects:
-
1.
The faint central elliptical emission is resolved for the first time into a point-source and a tail that extends to the northeast. This morphology suggests a single protostar accompanied by a jet.
-
2.
The jet-like feature is headed in the opposite direction of a collimated H2 jet.
-
3.
A southwestern emission nebula is turning the outflow pattern from the disc centre into a fairly symmetric morphology. The intensity ratio of the bipolar emission, however, is highly asymmetric, probably due to the inclination of the dusty disc.
-
4.
The bipolar nebula might be scattered light which is reddened by extinction caused by the disc material.
-
5.
Various estimates of the extinction towards the embedded protostar yields a range of .
-
6.
The observed 2.2 m flux is equivalent to a protostar with a mass range of .
The new data strengthen the evidence for an intermediate to high-mass protostellar object being formed by accretion.
Acknowledgements
We thank the VLT team for performing the observations in service mode. This work was partly funded by the Nordrhein–Westfälische Akademie der Wissenschaften. M. Nielbock acknowledges the support by the Deutsche Forschungsgemeinschaft, DFG project SFB 591 and the Ministerium für Innovation, Wissenschaft, Forschung und Technik (MIWFT) des Landes Nordrhein–Westfalen. We thank M. Haas for helpful discussions. The constructive respond of the anonymous referee is highly appreciated.
This publication makes in part use of data products from the Two Micron All Sky Survey, which is a joint project of the University of Massachusetts and the Infrared Processing and Analysis Center/California Institute of Technology, funded by the NASA and the National Science Foundation.
This work is based in part on observations made with the Spitzer Space Telescope, which is operated by the Jet Propulsion Laboratory, California Institute of Technology under a contract with NASA.
References
- (1) Benjamin R. A. et al., 2003, PASP, 115, 953
- Blum et al. (2000) Blum R. D., Conti P. S., Damineli A., 2000, AJ, 119, 1860
- Bonnell et al. (2001) Bonnell I. A., Bate M. R., Clarke C. J., Pringle J. E., 2001, MNRAS, 323, 785
- Caratti o Garatti et al. (2006) Caratti o Garatti A., Giannini T., Nisini B., Lorenzetti D., 2006, A&A, 449, 1077
- Chini et al. (1980) Chini R., Elsässer H., Neckel T., 1980, A&A, 91, 186
- Chini et al. (2004) Chini R., Hoffmeister V., Kimeswenger S., Nielbock M., Nürnberger D., Schmidtobreick L., Sterzik M., 2004, Nature, 429, 155
- Chini et al. (2004) Chini R., Hoffmeister V. H., Kämpgen K., Kimeswenger S., Nielbock M., Siebenmorgen R., 2004, A&A, 427, 849
- Chini & Wargau (1998) Chini R., Wargau W. F., 1998, A&A, 329, 161
- Davis et al. (2006) Davis C. J., Nisini B., Takami M., Pyo T.-S., Smith M. D., Whelan E., Ray T. P., Chrysostomou A., 2006, ApJ, 639, 969
- Ducati et al. (2001) Ducati J. R., Bevilacqua C. M., Rembold S. B., Ribeiro D., 2001, ApJ, 558, 309
- Fazio et al. (2004) Fazio G. G. et al., 2004, ApJS, 154, 10
- Felli et al. (1984) Felli M., Massi M., Churchwell E., 1984, A&A, 136, 53
- Finger et al. (1998) Finger G., Biereichel P., Mehrgan H., Meyer M., Moorwood A. F., Nicolini G., Stegmeier J., 1998, in Fowler A. M., ed., proc. SPIE 3354, Infrared detector development programs for the VLT instruments at the European Southern Observatory. The International Society for Optical Engineering, p. 87
- Flaherty et al. (2007) Flaherty K. M., Pipher J. L., Megeath S. T., Winston E. M., Gutermuth R. A., Muzerolle J., Allen L. E., Fazio G. G., 2007, ApJ, 663, 1069
- Hartigan et al. (2005) Hartigan P., Heathcote S., Morse J. A., Reipurth B., Bally J., 2005, AJ, 130, 2197
- Hartung et al. (2003) Hartung M. et al., 2003, in Iye M., Moorwood A. F. M., eds., proc. SPIE 4841, CONICA design, performance and final laboratory tests. The International Society for Optical Engineering, p. 425
- Heathcote et al. (1996) Heathcote S., Morse J. A., Hartigan P., Reipurth B., Schwartz R. D., Bally J., Stone J. M., 1996, AJ, 112, 1141
- Hoffmeister et al. (2006) Hoffmeister V. H., Chini R., Scheyda C. M., Nürnberger D., Vogt N., Nielbock M., 2006, A&A, 457, L29
- Hoffmeister et al. (2008) Hoffmeister V. H., Chini R., Scheyda C. M., Schulze D., Nürnberger D., Vogt N., 2008, ApJ, submitted
- Hollenbach & McKee (1989) Hollenbach D., McKee C. F., 1989, ApJ, 342, 306
- Ito et al. (2008) Ito M., Yamashita T., Sako S., Takami H., Hayano Y., Terada H., 2008, ApJ, 672, 398
- Itoh (2001) Itoh Y., 2001, in Zinnecker H., Mathieu R., eds., proc. of IAU Symp. 200, Twisted Jets from L1551 IRS5. The Astronomical Society of the Pacific, San Francisco, p. 261
- Jiang et al. (2002) Jiang Z. et al., 2002, ApJ, 577, 245
- Krumholz et al. (2007) Krumholz M. R., Klein R. I., McKee C. F., 2007, ApJ, 656, 959
- Krumholz & Thompson (2007) Krumholz M. R., Thompson T. A., 2007, ApJ, 661, 1034
- Kumar et al. (2003) Kumar M. S. N., Fernandes A. J. L., Hunter T. R., Davis C. J., Kurtz S., 2003, A&A, 412, 175
- Kurtz (2005) Kurtz S., 2005, in Cesaroni R., Churchwell E., Felli M., Walmsley C. M., eds., proc. IAU Symp. 227, Hypercompact HII regions. Cambridge University Press, p. 111
- Nielbock et al. (2003) Nielbock M., Chini R., Müller S. A. H., 2003, A&A, 408, 245
- Nürnberger et al. (2007) Nürnberger D. E. A., Chini R., Eisenhauer F., Kissler-Patig M., Modigliani A., Siebenmorgen R., Sterzik M. F., Szeifert T., 2007, A&A, 465, 931
- Pascucci et al. (2007) Pascucci I. et al., 2007, ApJ, 663, 383
- Reipurth & Bally (2001) Reipurth B., Bally J., 2001, ARAA, 39, 403
- Román-Zúñiga et al. (2007) Román-Zúñiga C. G., Lada C. J., Muench A., Alves J. F., 2007, ApJ, 664, 357
- Rousset et al. (2003) Rousset G. et al., 2003, in Wizinowich P. L., Bonaccini D., eds., proc. SPIE 4839, NAOS, the first ao system of the VLT: on-sky performance. The International Society for Optical Engineering, p. 140
- Russeil (2003) Russeil D., 2003, A&A, 397, 133
- Sako et al. (2005) Sako S. et al., 2005, Nature, 434, 995
- Siebenmorgen & Krügel (2000) Siebenmorgen R., Krügel E., 2000, A&A, 364, 625
- Stark et al. (2006) Stark D. P., Whitney B. A., Stassun K., Wood K., 2006, ApJ, 649, 900
- Steinacker et al. (2006) Steinacker J., Chini R., Nielbock M., Nürnberger D., Hoffmeister V., Huré J.-M., Semenov D., 2006, A&A, 456, 1013
- Tielens & Hollenbach (1985) Tielens A. G. G. M., Hollenbach D., 1985, ApJ, 291, 722
- Werner et al. (2004) Werner M. W. et al., 2004, ApJS, 154, 1
- Yorke & Sonnhalter (2002) Yorke H. W., Sonnhalter C., 2002, ApJ, 569, 846