The Period-Luminosity Relation for the Large Magellanic Cloud Cepheids Derived from Spitzer Archival Data
Abstract
Using Spitzer archival data from the SAGE (Surveying the Agents of a Galaxy’s Evolution) program, we derive the Cepheid period-luminosity (P-L) relation at , , and microns for Large Magellanic Cloud (LMC) Cepheids. These P-L relations can be used, for example, in future extragalactic distance scale studies carried out with the James Webb Space Telescope. We also derive Cepheid period-color (P-C) relations in these bands and find that the slopes of the P-C relations are relatively flat. We test the nonlinearity of these P-L relations with the statistical test, and find that the , and P-L relations are consistent with linearity. However the P-L relation presents possible but inconclusive evidence of nonlinearity.
Subject headings:
Cepheids — distance scale1. Introduction
The Cepheid period-luminosity (P-L) relation is an important component in extragalactic distance scale and cosmological studies. The most widely used P-L relations in the literature are obtained from Large Magellanic Cloud (LMC) Cepheids in optical (e.g., see Madore & Freedman, 1991; Tanvir, 1999; Udalski et al., 1999a; Sandage et al., 2004; Kanbur & Ngeow, 2006) and near infra-red (NIR) (e.g., see Madore & Freedman, 1991; Gieren et al., 1998; Groenewegen, 2000; Nikolaev et al., 2004; Persson et al., 2004; Ngeow et al., 2005) bands. In addition, there are also some LMC P-L relations obtained for MACHO (Nikolaev et al., 2004; Ngeow et al., 2005) and EROS (Bauer et al., 1999) bands. Recently, Ngeow & Kanbur (2007) applied a semiempirical approach to derive the LMC P-L relation in Sloan bands: still within optical and/or NIR regimes. Therefore, Cepheid P-L relations are well-developed for wavelengths ranging from optical to NIR.
In contrast, there are currently no P-L relations available for wavelengths longer than the band in the literature. The main motivation for having a P-L relation at these longer wavelengths is in order to apply it in future extragalactic distance scale studies. The Near Infrared Camera (NIRCam) and the Mid-Infrared Instrument (MIRI), that are scheduled to be installed on the James Webb Space Telescope (JWST), will operate in the NIR and mid-infrared: a wavelength range of 0.6-5 microns and 5-27 microns, respectively111See the links given in http://www.stsci.edu/jwst/instruments/. It is possible that extragalactic Cepheids will be discovered and/or (re-)observed (for those galaxies that were observed by the Key Project) by the JWST. Hence, P-L relations at longer wavelengths are needed in order to use JWST to derive a Cepheid distance to these galaxies. In this Paper, we derive the LMC P-L relations at , , and microns from the Spitzer archival data. As far as we are aware, this is the first time such a relation has been derived.
In addition to the P-L relations, we can also derive period-color (P-C) relations and construct color-color plots and the color-magnitude diagrams (CMD) for LMC Cepheids in these Spitzer bands. In Section 2 we discuss our data selection. In Section 3 we present our analysis and results for the P-L relations. Section 4 we show the P-C relations, the CMD and the color-color plot for the Cepheids in our sample. Our conclusion is given in Section 5. Extinction is ignored in this Paper because it is expected to be negligible in the Spitzer’s IRAC bands (hereafter IRAC band).
2. Data Selection
The SAGE (Surveying the Agents of a Galaxy’s Evolution, Meixner et al., 2006)222See http://sage.stsci.edu/index.php is a program to survey the LMC using the Spitzer satellite. As a result it has detected about 4 million sources in the LMC with Spitzer’s IRAC instrument (with an angular resolution of arcsecond). The data are publicly available via the IRSA’s Gator Catalog Query333See http://irsa.ipac.caltech.edu/applications/Gator/. To find LMC Cepheids in the SAGE database, we first obtained the right ascension (RA) and declination (DEC) of the LMC Cepheids from the OGLE (Optical Gravitational Lensing Experiment, Udalski et al., 1999b) database. We only obtained the Cepheids that were classified as fundamental mode Cepheids (labelled as FU) from the OGLE database, where the classification was mainly based on the P-L relation and the Fourier decomposition technique (Udalski et al., 1999b). The initial list of 771 Cepheids was cross-correlated with a list of ”good” Cepheids given in Kanbur & Ngeow (2006). The details regarding selection criteria used to remove “bad” Cepheids, including possible overtone Cepheids, can be found in Kanbur & Ngeow (2006) and will not be repeated here. This left 627 OGLE LMC Cepheids. To increase the sample size and to extend the period coverage to longer period (OGLE Cepheids truncated at days due to CCD saturation), we added non-OGLE Cepheids from the Sebo et al. (2002) catalog. As in previous studies (for example, see Udalski et al., 1999a; Kanbur & Ngeow, 2006; Ngeow et al., 2005; Sandage et al., 2004, and the reference therein), we applied a period cut of days to our sample to avoid inclusion of overtone Cepheids. The number of Cepheids left in our sample is 737.
| SAGE Catalog | SAGE Archive | |
|---|---|---|
| 886 | 912 | |
| 13 | 4 | |
| 724 | 733 | |
| st. deviation | st. deviation | |
| st. deviation | st. deviation | |
| st. deviation | st. deviation |
Note. — Units for , and are in arcsecond.

The IRSA’s Gator Catalog Query provides two SAGE datasets: the SAGE Winter ’07 IRAC Catalog (hereafter SAGE Catalog) and the SAGE Winter ’07 IRAC Archive (hereafter SAGE Archive). The difference between the SAGE Catalog and the SAGE Archive can be found in Meixner et al. (2006) and in the SAGE document444See http://irsa.ipac.caltech.edu/applications/Gator/
GatorAid/SAGE/SAGE_SSCdatadocument_delivered.pdf, and will not be repeated here. The search on the SAGE Catalog and Archive were performed with a search radius of arcseconds. The results are summarized in Table 1. In this table, is the total number of matched sources. However there are several Cepheids which do not have any matched sources within the search radius: the number of these Cepheids is given as . For those Cepheids with multiple matched sources, the sources with a minimum “distance” or separation from the input RA and DEC of the LMC Cepheids were selected to remove the duplicated SAGE sources. The number of matched sources left in the sample is summarized as in Table 1. The mean “distance”, , between the input Cepheid locations and the locations of the matched sources, and the mean difference in RA and DEC, and respectively, for the remaining Cepheids are presented in Table 1 as well. Figure 1 shows the distribution of the “distance” or the separation between the remaining Cepheids and the matched sources from both of the SAGE Catalog and the SAGE Archive.
Running the same query on SAGE Winter ’07 MIPS Catalog returned and matched sources with and arcsecond search radius, respectively. We therefore do not consider the detections from the MIPS catalog in this Paper.
3. The Period-Luminosity Relation
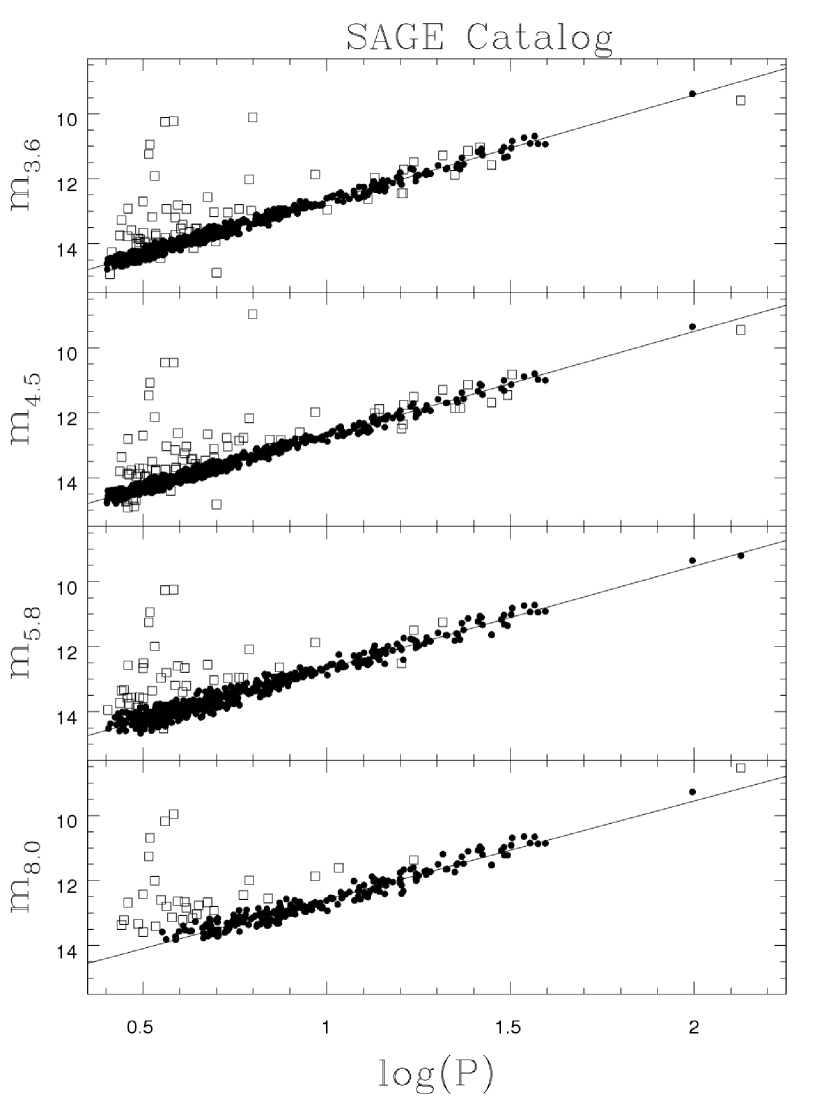
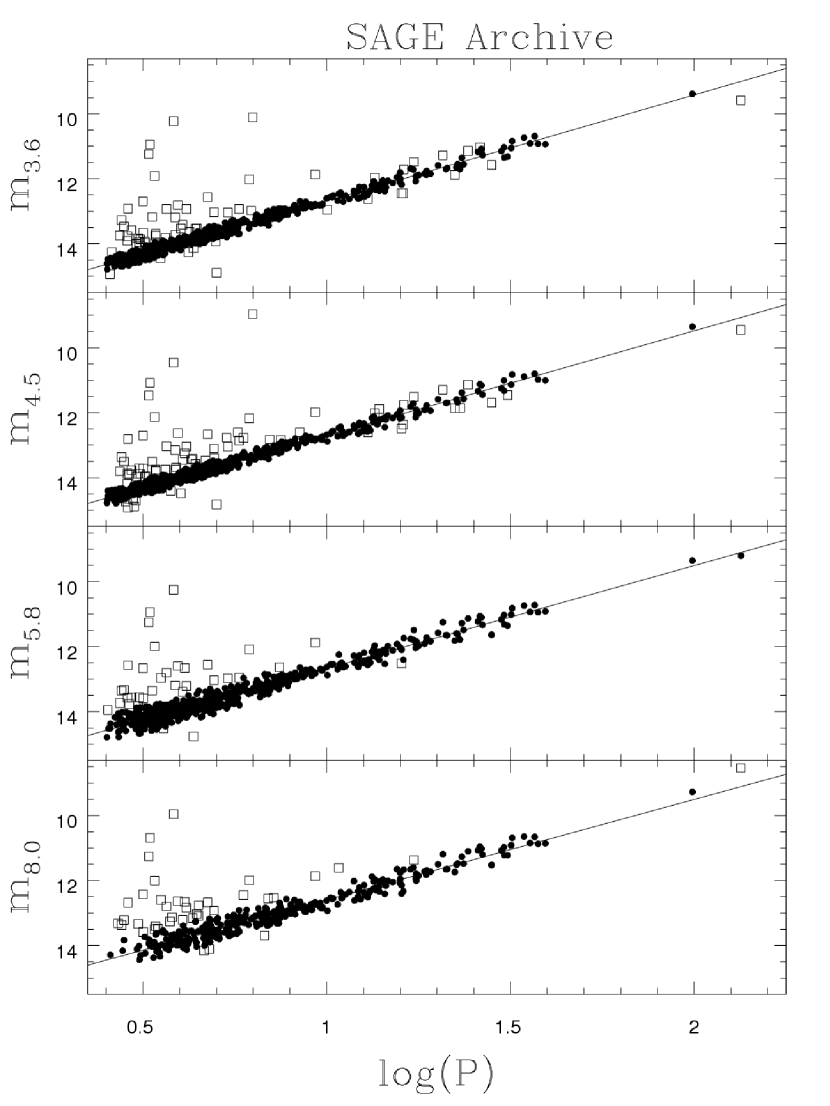
Initial plots of the P-L relations for all matched sources display a tight P-L relation with some obvious outliers. These outliers are probably due to the mis-match of the Cepheids with the input SAGE database, blending of other sources along the line-of-sight, or other physical reasons. These reasons are difficult to track down because we only have the data from the publicly available database and not the source images. Therefore we apply an iterative outlier removal algorithm (the sigma-clipping algorithm, as in Udalski et al., 1999a) to remove the outliers. For each iteration, P-L relations are fitted to the data and outliers located more than away from the fitted regression lines are removed, where is the dispersion of the regression lines. This process is repeated several times until the solutions from the regression become stable. The rejected outliers are represented as open squares in Figure 2.
| Band | Slope | Zero-Point | ||
|---|---|---|---|---|
| SAGE Catalog | ||||
| 0.104 | 613 | |||
| 0.104 | 618 | |||
| 0.169 | 534 | |||
| 0.183 | 215 | |||
| SAGE Archive | ||||
| 0.104 | 628 | |||
| 0.103 | 635 | |||
| 0.175 | 561 | |||
| 0.193 | 319 | |||
Note. — is the dispersion of the P-L relation.
Figure 2 displays the P-L relations in the IRAC bands and Table 2 presents the results from fitted regression lines after outliers have been removed. When fitting the P-L relations, we do not stipulate constraints that the number of Cepheids should be the same in all four bands and/or a given Cepheid is detected in all four bands because the number of Cepheids in the band is much smaller than in other bands. Table 2 finds that the IRAC band P-L relations obtained using data from the SAGE Catalog and the SAGE Archive are in very good agreement. A small discrepancy is seen for the P-L relation, perhaps due both to the different numbers of Cepheids in the two catalogs (there are % more Cepheids from the SAGE Archive than in the SAGE Catalog), and also the lack of Cepheids fainter than mag. in the SAGE Catalog (see lower-left panel of Figure 2). In Figure 3, we give the reported errors on the magnitudes as a function of magnitude from the SAGE database. This figure clearly shows the truncation of mag. at for our Cepheid sample in the SAGE Catalog. Furthermore, there is a clear cut-off of the errors for the band data555This cut-off is still visible if we include a large number of non-Cepheid data from the SAGE Catalog. from the SAGE Catalog, which is absent in other panels in Figure 3. The lack of mag. and the cut-off of the errors at band could be due to the more stringent criteria for the SAGE Catalog than the SAGE Archive (see Meixner et al., 2006, and the SAGE document given in footnote 4). For these reasons, we only consider the data from SAGE Archive in the rest of this Paper.
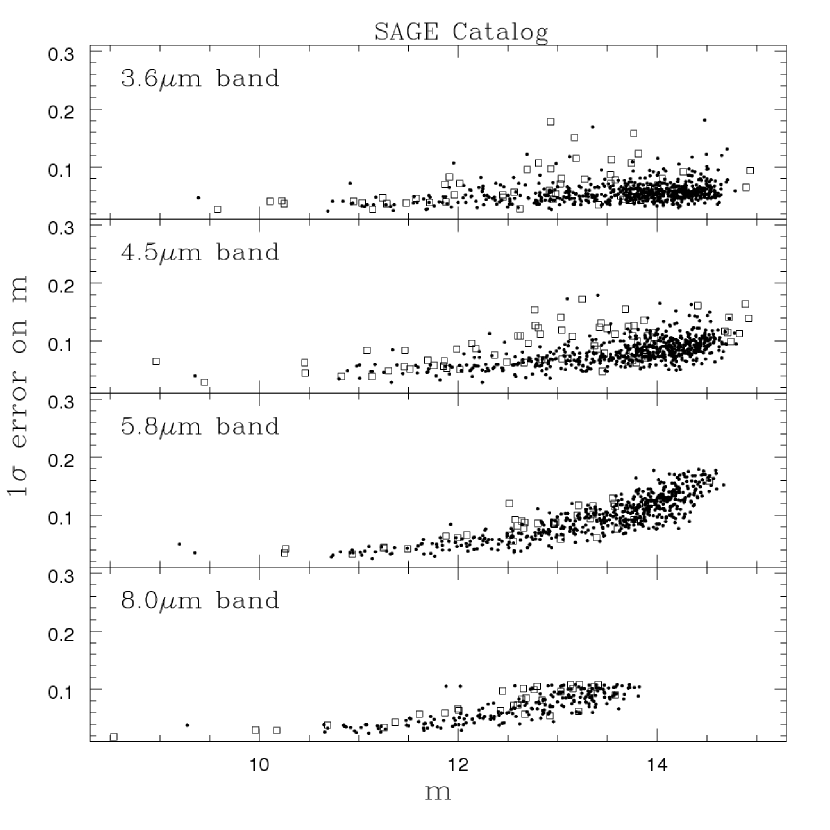
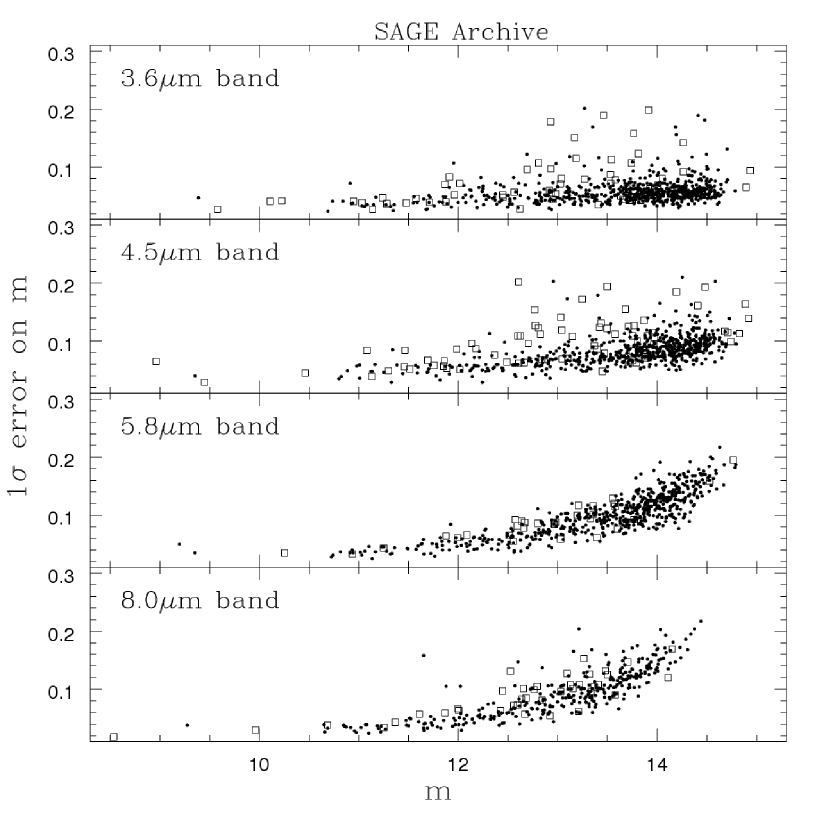
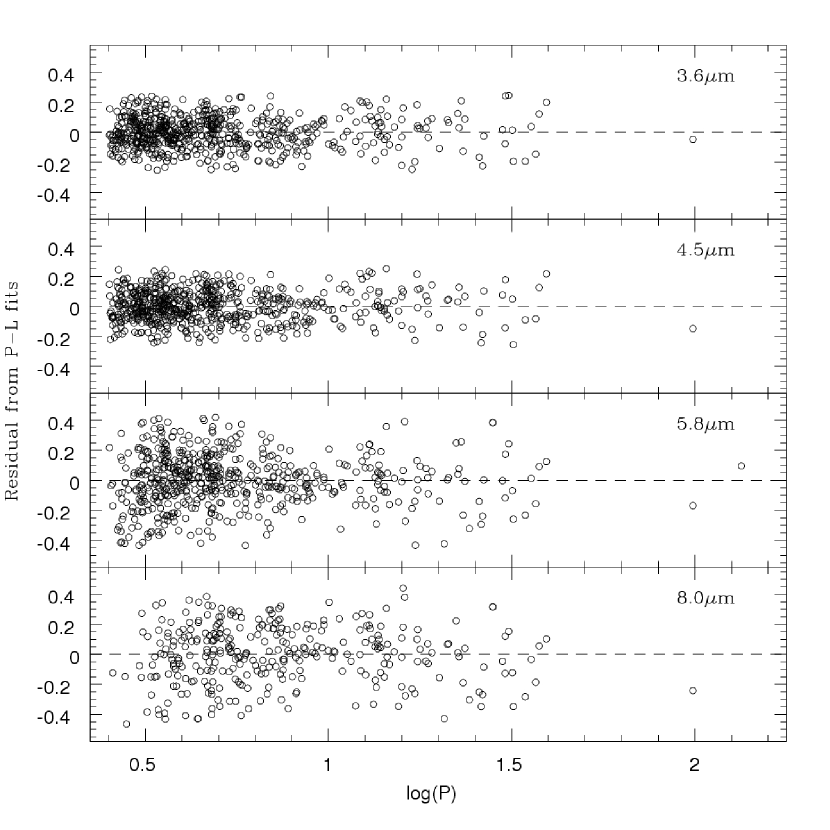
Figure 4 presents the residual plots from the fitted P-L relation in each bands. The residuals for , and band are more or less evenly distributed around the regression lines. However the residuals for band exhibit a deficit on one side of the regression at . This could suggest that the band P-L relation may not be linear, and this will be investigated further in Section 3.4. Interestingly, the smallest dispersion of the P-L relations seems to occur at in all four bands.
3.1. Sensitivity of the P-L Relations with Various Period Cuts


Even thought period cut of has been applied to our sample to avoid the contamination of overtone Cepheids at the short period end (see Section 2), the short period Cepheids in our sample may still be influenced by the overtone Cepheids, the increasing sensitivity of blending and the increasing of measurement errors in the IRAC band (as shown in Figure 3) for the faint (hence short period) Cepheids. These may bias the P-L relations when comparing to those presented in Table 2, and a cut at a longer period may be required to avoid the bias due to these effects. In Figure 5, we present the slopes and zero-points of the fitted P-L relations with various period cuts from to to our sample. This figure suggests that the slopes are consistent (within the error bars) at different period cuts up to . A similar result is also found for the zero-points. This suggests that increasing the period cuts up to will not greatly affect the results presented in Table 2, and the various sources that could bias the P-L relations may not be important. However at , the number of Cepheids in the sample decreases to in , and bands, and to in band. Hence we retain our results given in Table 2 in this Paper.
3.2. Random Phase Correction and the P-L Relations in the IRAC Band

In optical bands accurate mean magnitudes from the light curves are used to fit for the P-L relations. In contrast, the magnitudes obtained from the SAGE database are flux averaged over several observations (see Meixner et al., 2006, for the details of the SAGE observing strategy). Since information regarding the time of observation of each data point is not available to us, these averaged magnitudes may not necessarily correspond to the mean magnitudes of the Cepheids. Nevertheless, it is well-known that the amplitude of Cepheid light curves decreases as wavelength increases. From Figure 6, it can be seen that the amplitude decreases from to band, and flattens out at and band. Extrapolating this trend to longer wavelengths may imply that the amplitudes in the IRAC bands could either be the same as in band, or become smaller or larger as wavelength increases. Therefore, we assume that the amplitudes will be small and these “random-phased” magnitudes are close to the mean magnitudes in those bands. In bands, there are well-developed methods to estimate the mean magnitudes from single epoch (or a few epochs) random phase observations, as presented in Nikolaev et al. (2004) and Soszyński et al. (2005). However, both methods either require the epoch of observation to be known or the existence of a template constructed from well-observed light curves. Clearly, both requirements are not present for the data we studied in this Paper. Nevertheless, the use of random-phase magnitudes from single epoch observations to derive the P-L relation has a precedent in the literature (see, for example, Groenewegen, 2000).
The influence of (single epoch) random phase magnitudes is expected to be minimal in the band. In order to test the validity of this assumption we use 2MASS band data that are available from the SAGE database. We repeat the fitting of the band P-L relation in the same way as for the IRAC bands. The results are presented in Table 3. We compare our band P-L relations with the band LMC P-L relation that is given in Fouqué et al. (2007). There are two main reasons for selecting the P-L relation from Fouqué et al. (2007) for our comparison. Firstly, Cepheids used in Fouqué et al. (2007) are entirely based on the OGLE sample. This is similar to our sample that consists mostly of OGLE Cepheids. Secondly, random phase correction with the method described in Soszyński et al. (2005) and extinction correction have been applied to the 2MASS band data used in Fouqué et al. (2007). This is in contrast to the data used in this Paper.
Table 3 reveals that without applying any random phase correction, the slope of the band P-L relation from the SAGE database is identical to the band P-L relation given in Fouqué et al. (2007). This suggests that the random phase correction may not have a large influence on the band slope, probably due to the small amplitude in the band. The difference between the Fouqué et al. (2007) P-L relation zero points and the results found with the SAGE database is mag. Assuming the mean extinction toward the LMC is mag. (for example, see Freedman et al., 2001) and using the total-to-selective extinction () of in the band (Fouqué et al., 2007), then about mag. of the mag. difference can be explained as due to the extinction. Therefore, we believe that the IRAC band P-L relations presented here will not be strongly influenced by the lack of random phase or extinction corrections.
| Source | Slope | Zero-Point | ||
|---|---|---|---|---|
| Catalog | 0.140 | 634 | ||
| Archive | 0.141 | 642 | ||
| F07 | 0.136 | 529 |
Note. — is the dispersion of the P-L relation. Catalog=SAGE Catalog; Archive=SAGE Archive; F07=Fouqué et al. (2007).
3.3. Comparison of P-L Relations at Different Bands
It has been well documented in the literature that the slopes of the P-L relation become progressively steeper from to band, while at the same time the dispersion of the P-L relation decreases (see, for example, Madore & Freedman, 1991; Berdnikov et al, 1996; Caputo et al., 2000; Fiorentino et al., 2002, 2007). This is expected in part due to the black-body curves with Cepheid-like temperatures. From , the temperature variation will dominate the luminosity variation in the optical bands (see, for example, Cox, 1980) and extends to band or even the band. In contrast, at band and/or the wavelengths longer than the band, the radius variation will dominate the temperature variation. Since the period-radius (P-R) relation is independent of wavelength, the slope of the P-L relation is expected to reach a maximum value at some characteristic wavelength and remain constant as the wavelength increases. Similarly, the dispersion is expected to reach a minimum at the same characteristic wavelength and remain steady at longer wavelengths. In Figure 7, we compare the slope, the zero-point and the dispersion of the P-L relation at various bands. For illustration purposes, we adopt the empirical and band P-L relations from Sandage et al. (2004) and Persson et al. (2004), respectively. To extend to longer wavelengths, we also add P-L relations in the IRAC bands from Table 2 (with results from SAGE Archive) in this figure.

Figure 7 attests to the fact that the slope of the P-L relation is the steepest around the to band region, and becomes shallower at longer wavelengths. In contrast, the zero-point of the P-L relation is a monotonic function of wavelength. The dispersion of the P-L relation displays a similar trend to the slope: the dispersion reaches a minimum around the and bands, and subsequently increases for longer wavelengths. A polynomial function in the form of was used to fit the data points in Figure 7. Here represents either the P-L slopes, zero-points or dispersion. From the polynomial fits, the steepest P-L slope of seems to be located at a wavelength of microns. The minimum dispersion of occurs at the same wavelength. This suggests that the P-L relations from band to band will provide a more accurate distance scale measurement than the optical bands. However, observations from optical bands are still required to detect Cepheid variables. Furthermore, the bottom panel of Figure 7 implies that the dispersions at and bands are similar to the bands, suggesting also that omission of random phase corrections may not be too serious an oversight.

Figure 7 provides evidence that the slopes and dispersions for the and band P-L relations are consistent both with each other and with the band P-L relation. However, the slopes and dispersions for the and band P-L relations are shallower and larger, respectively than the theoretical expectation outlined previously. There are two possible causes for this. The first possibility is that measurement errors become larger toward the faint end of the and band P-L relations, as suggested in Figure 3. The second possibility is that the number of Cepheids in these two bands is less than those in the and bands. This is especially true for the band. Figure 8 presents the period distribution for our Cepheid sample: fewer Cepheids are indeed detected for in the band. This is also reflected in Table 2 where the number of Cepheids in the band (from the SAGE Archive), is about 43% to 50% less than the number of Cepheids in other bands. Meixner et al. (2006) reported the limiting magnitude in each band as mag. This may result in fewer detections around mag. in the band. In the case of the band, Figure 8 also suggests that, for , fewer Cepheids are detected when compared to the and bands.
3.4. Nonlinearity of the P-L Relations
| days | days | |||||||||
|---|---|---|---|---|---|---|---|---|---|---|
| Band | SlopeS | Zero-PointS | SlopeL | Zero-PointL | ||||||
| 0.101 | 550 | 0.126 | 78 | 1.78 | 0.170 | |||||
| 0.100 | 558 | 0.122 | 77 | 2.81 | 0.061 | |||||
| 0.176 | 471 | 0.175 | 90 | 0.55 | 0.579 | |||||
| 0.191 | 232 | 0.186 | 87 | 5.90 | 0.003 | |||||
Note. — is the dispersion of the P-L relation.
A number of recent studies have strongly suggested the LMC P-L relation in optical bands is nonlinear, in the sense that the relation can be broken into two P-L relations separated at/around 10 days (Tammann & Reindl, 2002; Kanbur & Ngeow, 2004; Sandage et al., 2004; Kanbur & Ngeow, 2006; Ngeow et al., 2005; Ngeow & Kanbur, 2006a, b; Kanbur et al., 2007b; Ngeow et al., 2008). In NIR, Ngeow et al. (2005) and Ngeow et al. (2008) found that the band LMC P-L relations are nonlinear but the band LMC P-L relation is marginally linear. Ngeow & Kanbur (2006b) outline a black-body argument for their result that the P-L relation could be linear in band but not in the optical and/or band. One possibility is that the temperature variation in Cepheid atmospheres, modulated at certain phases, periods and metallicities by the stellar photosphere-hydrogen ionization front interaction (Kanbur et al., 2004; Kanbur & Ngeow, 2006; Kanbur et al., 2007a), is responsible for the observed nonlinear P-L relation. Since the temperature variation for a black-body with Cepheid-like temperatures is minimal or even negligible at longer wavelengths, it is expected that the P-L relation becomes linear for wavelengths longer than the band. Therefore, another main motivation for this Paper is to study the linearity/nonlinearity of the LMC P-L relations in the IRAC band.
To test the nonlinearity of the P-L relations, we apply the -test as in our previous studies (Kanbur & Ngeow, 2004, 2006; Ngeow et al., 2005). The detailed description and formalism of the -test can be found in Weisberg (1980), Kanbur & Ngeow (2004) and Ngeow et al. (2005), and will not be repeated here. Simply speaking, in our -test, the null hypothesis is that the data can be fitted with a single regression line, and the alternate hypothesis is that two regression lines separated at 10 days are needed to fit the data. In our test, we set , the probability of the observed value under the null hypothesis, to be (equivalently at the 95% confidence level). This corresponds to for our data. Hence, indicates that the null hyopthesis can be rejected at the 95% confidence level or more for the P-L relation under scrutiny.
In Table 4, we present the results from the -test for the P-L Relations in IRAC band. The -test results indicate that the P-L relation is linear in the , and band but not in the band. The linearity of the P-L relation in , and band is expected from the black-body argument as outlined previously. However it is important to point out that the linearity/nonlinearity of the P-L relation in these bands does not necessary imply the P-L relation in the optical bands will be linear/nonlinear. The apparently nonlinear P-L relation is puzzling. Removing the longest period Cepheid in the band sample still leaves a nonlinear result with a value of . The relatively small number of Cepheids in band (see Figure 8) may cause the apparent nonlinear result though the test is sensitive to this. The similar trends of the measurement error plot, as shown in Figure 3, and the similar dispersions for the P-L relations in the and band, suggest the lack of short period Cepheids in band may be the reason for the nonlinear result, because the -test result finds that the P-L relation is linear. It is still inconclusive if the P-L relation is truely nonlinear or not and more data are needed in the future work to solve this problem.
4. The Period-Color Relation, the Color-Color Plot and the CMD
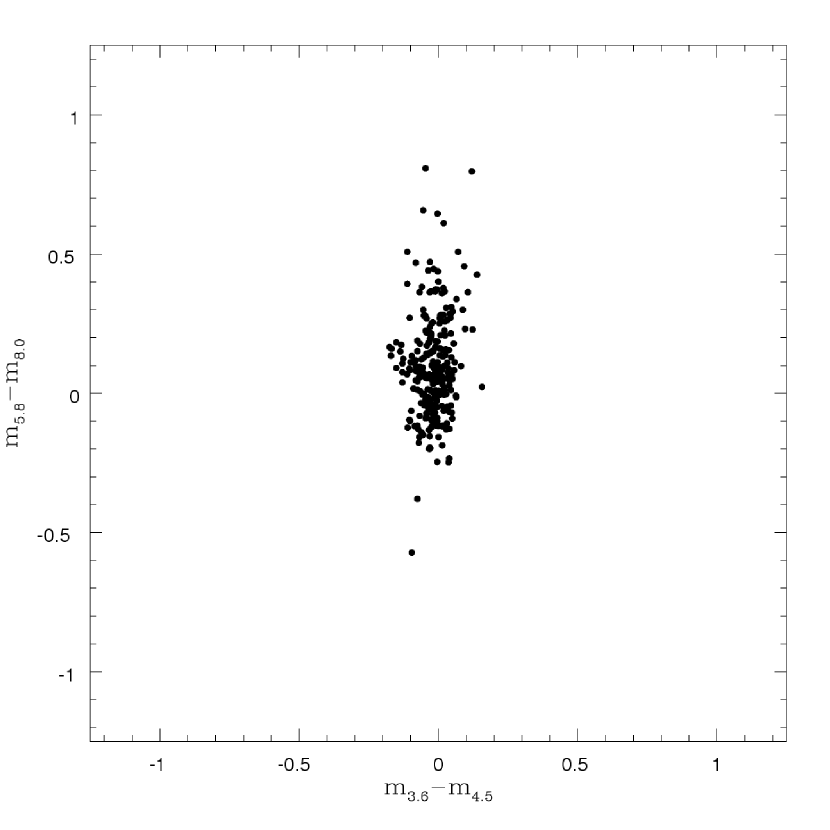
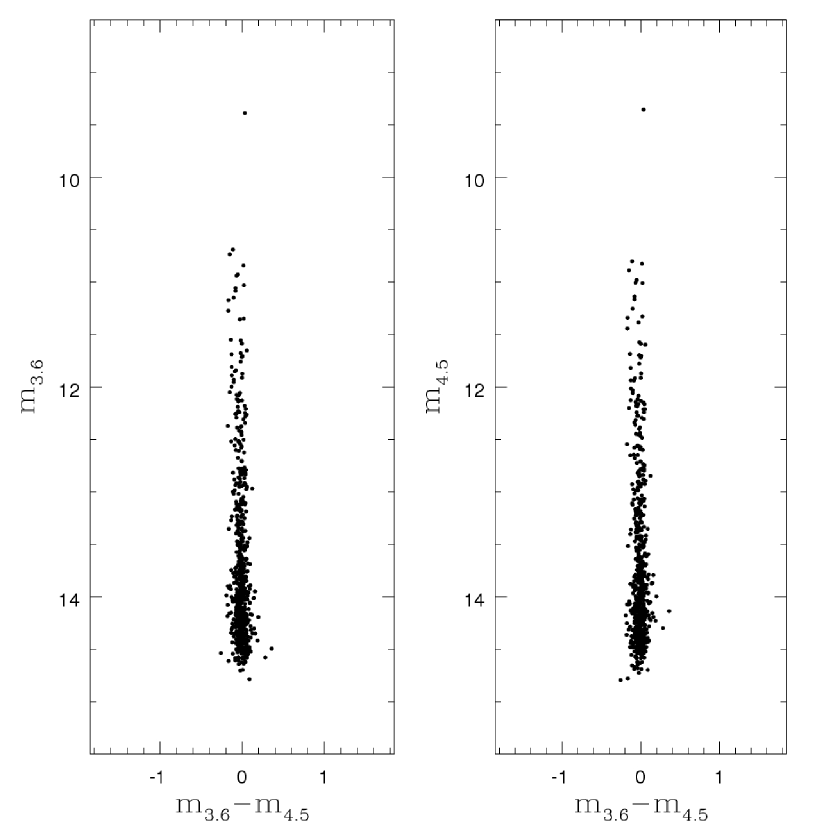
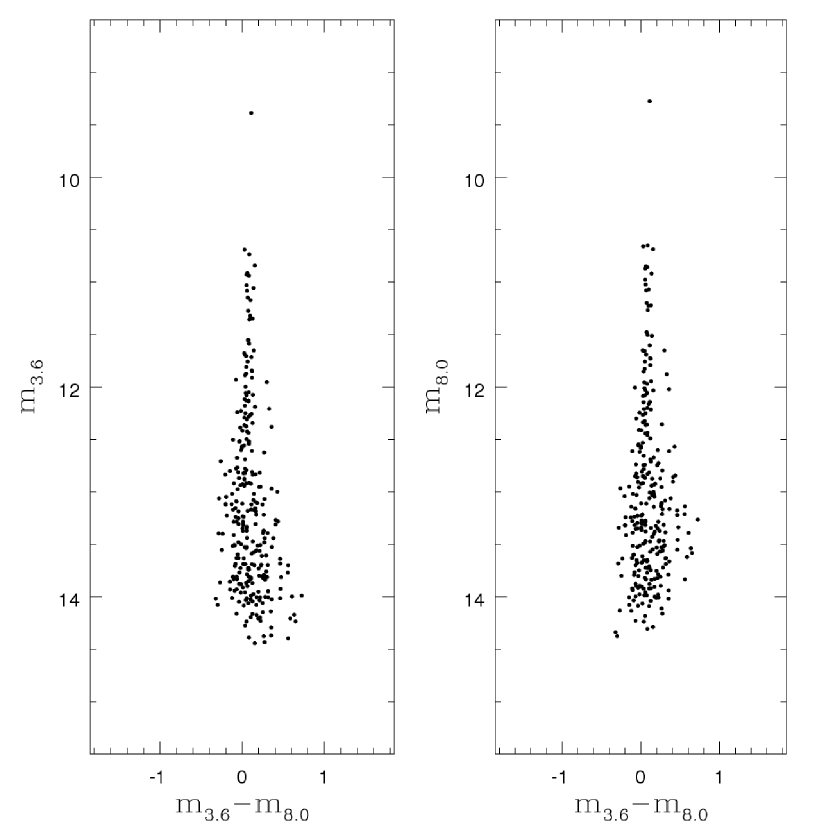
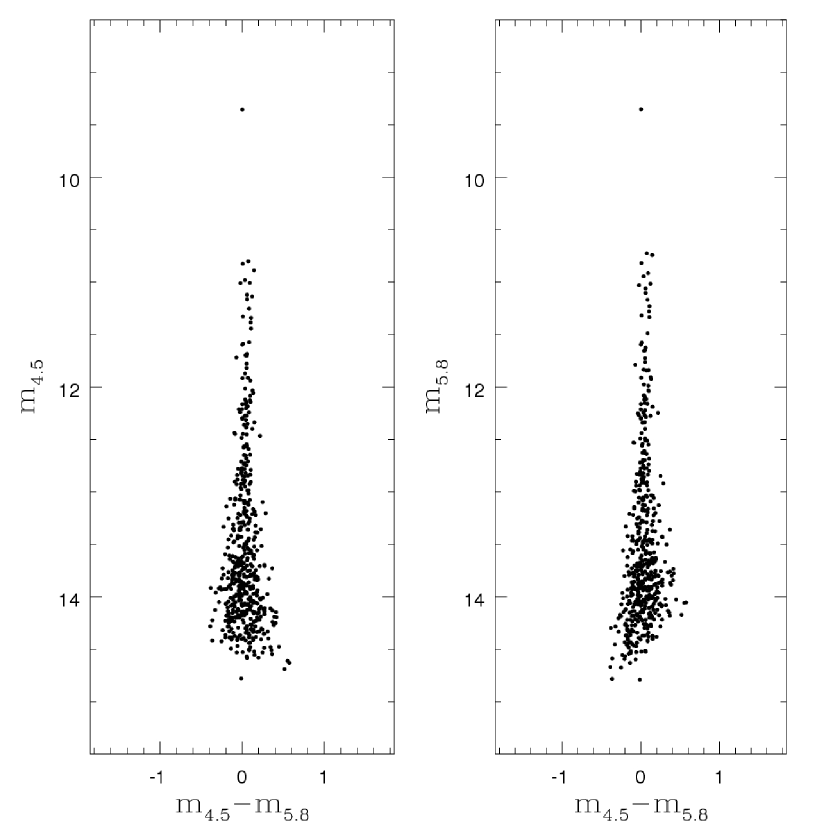
In addition to the P-L relations derived in previous sections, the SAGE Archive also permits the derivation of P-C relations, color-color plots and the CMD. The resulting P-C relations from the data are presented in Figure 9 and Table 5, while the color-color plots and CMD are presented in Figures 10 and 11, respectively.
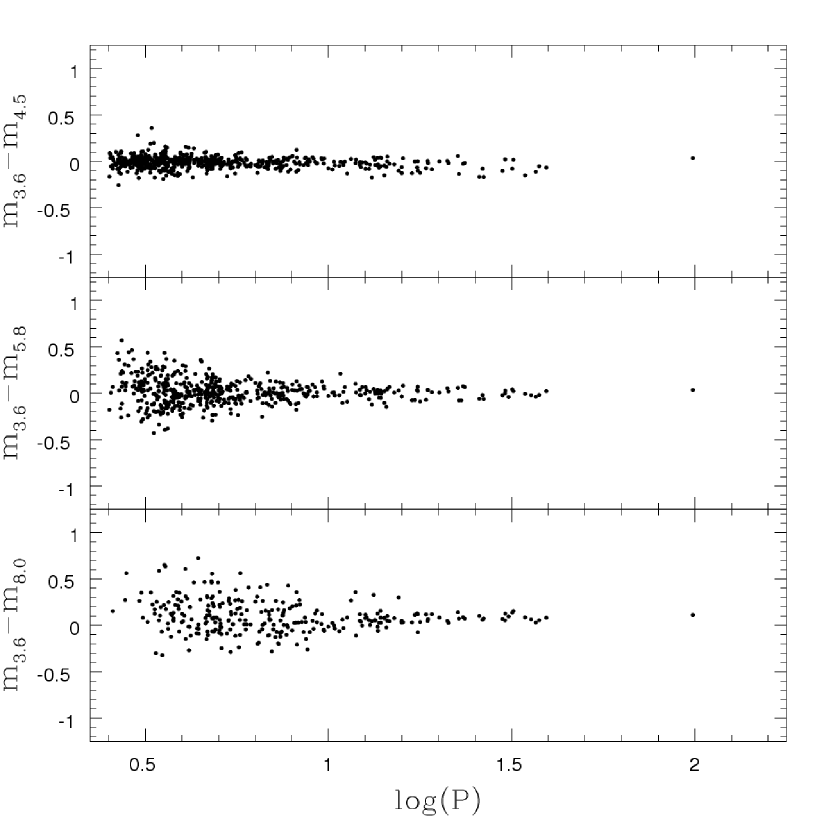
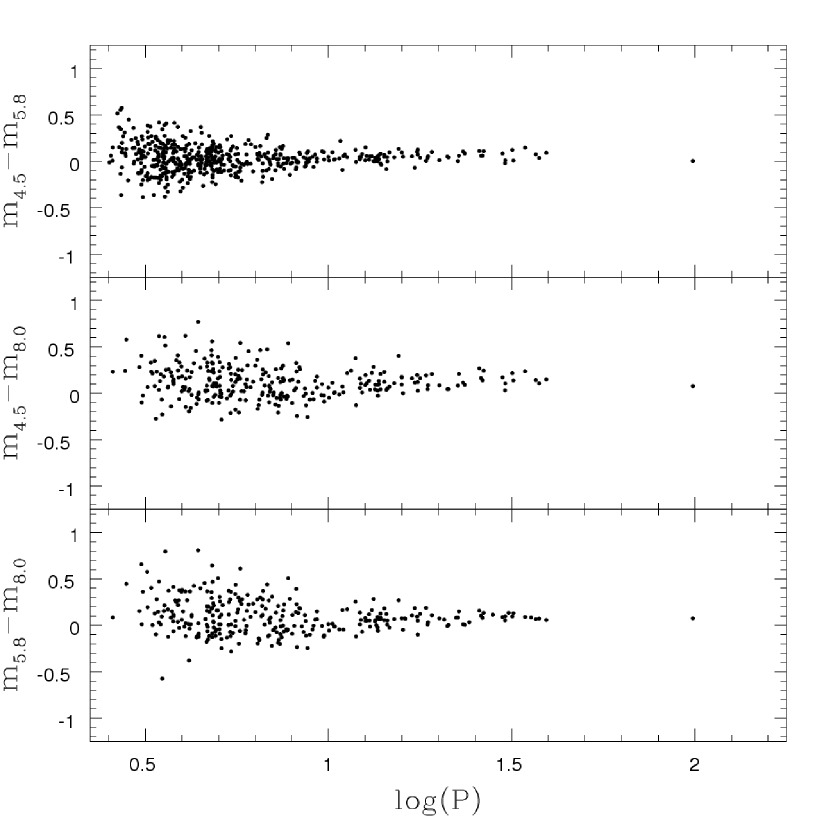
The IRAC band P-C relations are found to be relatively flat as compared to the P-C relations in the optical band, with the mean color being close to zero (especially for the P-C relation). This is not a surprise given that the slopes and the zero-points of the P-L relations in these bands are similar (see Table 2 and Figure 7). In fact black-body curves with Cepheid-like temperatures predict the P-C relation should vanish at these bands. Table 5 also finds that some P-C relations are identical to each other, including the & pair, and the , & P-C relations. Furthermore, all P-C relations presented in Figure 9 display a very tight sequence for Cepheids with . This is also seen in the CMD. In Table 6 we present the P-C relations separated at 10 days. The flatness of the P-C slope, the mean color of zero and the small dispersion of the P-C relation are clearly evident from this table for Cepheids with period longer than 10 days.


| Color | Slope | Zero-Point | ||
|---|---|---|---|---|
| 0.061 | 595 | |||
| 0.137 | 504 | |||
| 0.171 | 287 | |||
| 0.140 | 512 | |||
| 0.170 | 291 | |||
| 0.181 | 298 |
Note. — is the dispersion of the P-C relation.
| days | days | |||||||
|---|---|---|---|---|---|---|---|---|
| Band | SlopeS | Zero-PointS | SlopeL | Zero-PointL | ||||
| 0.061 | 521 | 0.059 | 74 | |||||
| 0.146 | 429 | 0.058 | 75 | |||||
| 0.189 | 213 | 0.079 | 74 | |||||
| 0.149 | 438 | 0.053 | 74 | |||||
| 0.185 | 217 | 0.092 | 74 | |||||
| 0.204 | 215 | 0.076 | 83 | |||||
Note. — is the dispersion of the P-C relation.
At the short period end of the P-C relations, the dispersion of the P-C relations gets broader (except for the P-C relation) as period decreases. This feature is also seen from Figure 11 toward the faint end of the CMD. Probably this could be due to the relatively large measurement errors at the faint (or short period) end, because the measurement errors in color can reach up to mag. as suggested from Figure 3. In addition, Figures 9 and 11 imply a lack of detections for the matched sources near , especially for the P-C relations that include the band. This could cause the short period P-C relations to deviate from flatness and mean zero color as given in Table 6. Because of these reasons, we did not test the nonlinearity of the P-C relations with the -test.
Nevertheless, the CMD presented in Figure 11 finds that the instability strip for LMC Cepheids is well defined in the IRAC band, especially with the color. The tightness of the color is also reflected in Figure 10, where the spread out of color is mainly from the short period Cepheids. The well occupied regions of the Cepheids in Figure 10 and the well defined CMD suggest that Figure 10 and 11 can be used to identify Cepheids in future studies.
5. Conclusion
In this Paper, we derive P-L relations for LMC Cepheids in IRAC , , and microns bands. These P-L relations can be potentially applied to future extragalactic distance scale studies with, for example, the JWST. The data are taken from the Spitzer’s archival database from the SAGE program. After properly removing the outliers, the fitted P-L relations are presented in Table 2. We have tested the P-L relations with various period cuts and found that our results are insensitive to period cuts up to . We also argue that the random phase corrections may not be important for IRAC band P-L relations. When comparing P-L relations from to bands, the slope of the P-L relation appears to be the steepest around band to band, while the dispersion of the P-L relation reaches a minimum between those bands. The shallower slopes and larger P-L dispersions in the and band are in contrast to the theoretical expectation. This could be due to the smaller number of Cepheids and larger measurement errors toward the faint end in these two bands. We also test the nonlinearity of the P-L relations in the IRAC band using the statistical test. As expected, the -test results show that the P-L relations are linear in , and microns band, but the P-L relation is found to be nonlinear. However, the nature of the nonlinear P-L relation is still inconclusive. For the P-C relations, it was found that the slopes of the P-C relation are relatively flat in the IRAC bands. Finally, the LMC Cepheids show a well-defined instability strip in the CMD and clustered in a small region in the color-color plot. This can potentially be used to identify Cepheids observed in the IRAC bands. Even though there may be some associated problems for the P-L relation, the , and perhaps the P-L relations can still be used in future distance scale studies.
References
- Bauer et al. (1999) Bauer, F., Afonso, C., Albert, J. N., Alard, C., Andersen, J., Ansari, R., Aubourg, B́., Bareyre, P., et al. (the EROS Collaboration), 1999, A&A, 348, 175
- Berdnikov et al (1996) Berdnikov, L. N., Vozyakova, O. V. & Dambis, A. K., 1996, Astronomy Letters, 22, 838
- Caputo et al. (2000) Caputo, F., Marconi, M. & Musella, I., 2000, A&A, 354, 610
- Cox (1980) Cox, J. P., 1980, Theory of Stellar Pulsation, Princeton University Press, Ed.
- Fiorentino et al. (2002) Fiorentino, G., Caputo, F., Marconi, M. & Musella, I., 2002, ApJ, 576, 402
- Fiorentino et al. (2007) Fiorentino, G., Marconi, M., Musella, I. & Caputo, F., 2007, ApJ in-press (arXiv:0707.0959)
- Fouqué et al. (2007) Fouqué, P., Arriagada, P., Storm, J., Barnes, T. G., Nardetto, N., Merand, A., Kervella, P., Gieren, W., et al., 2007, A&A, 476, 73
- Freedman (1988) Freedman, W., 1988, ApJ, 326, 691
- Freedman et al. (2001) Freedman, W., Madore, B., Gibson, B., et al., 2001, ApJ, 553, 47
- Gieren et al. (1998) Gieren, W., Fouqué, P. & Gómez, M., 1998, ApJ, 496, 17
- Groenewegen (2000) Groenewegen, M. A. T., 2000, A&A, 363, 901
- Kanbur & Ngeow (2004) Kanbur, S. & Ngeow, C., 2004, MNRAS, 350, 962
- Kanbur et al. (2004) Kanbur, S., Ngeow, C. C. & Buchler, J. R., 2004, MNRAS, 354, 212
- Kanbur & Ngeow (2006) Kanbur, S. & Ngeow, C., 2006, MNRAS, 369, 705
- Kanbur et al. (2007a) Kanbur, S., Ngeow, C. C. & Feiden, G., 2007a, MNRAS, 380, 819
- Kanbur et al. (2007b) Kanbur, S., Ngeow, C. C., Nanthakumar, A. & Stevens, R., 2007b, PASP, 119, 512
- Madore & Freedman (1991) Madore, B. & Freedman, W., 1991, PASP, 103, 933
- Meixner et al. (2006) Meixner, M., Gordon, K., Indebetouw, R., Hora, J., Whitney, B., Blum, R., Reach, W., Bernard, et al., 2006, AJ, 132, 2268
- Ngeow et al. (2003) Ngeow, C., Kanbur, Shashi M., Nikolaev, S., Tanvir, N. & Hendry, M., 2003, ApJ, 586, 959
- Ngeow et al. (2005) Ngeow, C., Kanbur, S., Nikolaev, S., Buonaccorsi, J., Cook, K. & Welch, D., 2005, MNRAS, 363, 831
- Ngeow & Kanbur (2006a) Ngeow, C. & Kanbur, S., 2006a, MNRAS, 369, 723
- Ngeow & Kanbur (2006b) Ngeow, C. & Kanbur, S., 2006b, ApJ, 650, 180
- Ngeow & Kanbur (2007) Ngeow, C. & Kanbur, S., 2007, ApJ, 667, 35
- Ngeow et al. (2008) Ngeow, C., Kanbur, S. & Nanthakumar, A., 2008, A&A, 477, 621
- Nikolaev et al. (2004) Nikolaev, S., Drake, A. J., Keller, S. C., Cook, K. H., Dalal, N., Griest, K., Welch, D. L. & Kanbur, S., 2004, ApJ, 601, 260
- Persson et al. (2004) Persson, S., Madore, B., Krzemiński, W., Freedman., W., Roth, M. & Murphy, D., 2004, AJ, 128, 2239
- Sandage et al. (2004) Sandage, A., Tammann, G. A. & Reindl, B., 2004, A&A, 424, 43
- Sebo et al. (2002) Sebo, K., Rawson, D., Mould, J., Madore, B., Putman, M., Graham, J., Freedman, W., Gibson, B. & Germany, L., 2002, ApJS, 142, 71
- Soszyński et al. (2005) Soszyński, I., Gieren, W. & Pietrzyński, G., 2005, PASP, 117, 823
- Tanvir (1997) Tanvir, N., 1997, in The Extragalactic Distance Scale, Edited by M. Livio, Space Telescope Science Institute Series, Cambridge University Press, pg. 91
- Tanvir (1999) Tanvir, N., 1999, in Harmonizing Cosmic Distance Scales in a Post-Hipparcos Era, Ed. Daniel Egret & Andre Heck, ASP Conference Series, Vol. 167, pg. 84
- Tammann & Reindl (2002) Tammann, G. A. & Reindl, B., 2002, Astrophys. & Space Sci., 280, 165
- Udalski et al. (1999a) Udalski, A., Szymanski, M., Kubiak, M., Pietrzynski, G., Soszynski, I., Wozniak, P. & Zebrun, K., 1999a, Acta Astron., 49, 201
- Udalski et al. (1999b) Udalski, A., Soszynski, I., Szymanski, M., Kubiak, M., Pietrzynski, G., Wozniak, P. & Zebrun, K., 1999b, Acta Astron., 49, 223
- Weisberg (1980) Weisberg, S., 1980, Applied Linear Regression, John Wiley & Sons, Ed.