Isolated X-ray–infrared sources in the region of interaction of the supernova remnant IC 443 with a molecular cloud
Abstract
The nature of the extended hard X-ray source XMMU J061804.3+222732 and its surroundings is investigated using XMM-Newton, Chandra, and Spitzer observations. This source is located in an interaction region of the IC 443 supernova remnant with a neighboring molecular cloud. The X-ray emission consists of a number of bright clumps embedded in an extended structured non-thermal X-ray nebula larger than 30′′ in size. Some clumps show evidence for line emission at 1.9 keV and 3.7 keV at the 99% confidence level. Large-scale diffuse radio emission of IC 443 passes over the source region, with an enhancement near the source. An IR source of about 14′′ 7′′ size is prominent in the 24 m, 70 m, and 2.2 m bands, adjacent to a putative Si K-shell X-ray line emission region. The observed IR/X-ray morphology and spectra are consistent with those expected for J/C-type shocks of different velocities driven by fragmented supernova ejecta colliding with the dense medium of a molecular cloud. The IR emission of the source detected by Spitzer can be attributed to both continuum emission from an HII region created by the ejecta fragment and line emission excited by shocks. This source region in IC 443 may be an example of a rather numerous population of hard X-ray/IR sources created by supernova explosions in the dense environment of star-forming regions. Alternative Galactic and extragalactic interpretations of the observed source are also discussed.
Subject headings:
ISM: individual (IC 443) — supernova remnants — X-rays: ISM1. Introduction
The energy release and the ejection of nucleosynthesis products by supernovae (SNe) events are of great importance for our understanding of the physics of the interstellar medium (ISM). The mixing of the ejected metals with the surrounding matter is of special interest when a SN occurs in a molecular cloud, which may cause further star-forming activity.
Optical and UV studies of the structure of SN remnants (SNRs) have revealed a complex metal composition of ejecta and the presence of isolated high-velocity ejecta fragments interacting with surrounding media. The most prominent manifestations of this phenomena are the fast moving knots observed in some young “oxygen-rich” SNRs, such as the Galactic SNRs Cas A (e.g., Chevalier & Kirshner 1979; Fesen et al. 2006), Puppis A (Winkler & Kirshner 1985), G292.0+1.8 (e.g. Winkler & Long 2006), and also N132D in the LMC and 1E 0102.2–7219 in the SMC (e.g. Blair et al. 2000).
Ballistically moving ejecta fragments of SNRs can be considered as a class of hard X-ray sources. The prototype was observed in the Vela SNR (Aschenbach, Egger, & Trümper 1995; Miyata et al. 2001). A massive individual fragment moving supersonically through a molecular cloud can have a luminosity 10 in the 1–10 keV band, and is observable with XMM-Newton and Chandra at a few kpc distance (Bykov 2002, 2003). Its X-ray emission is expected to consist of two components. The first one is thermal X-ray emission from the hot shocked ambient gas behind the fragment bow shock, with a spectrum of an optically thin thermal plasma of an ISM-cloud abundance. The second emission component is nonthermal; the interaction of fast electrons accelerated at the fragment bow-shock with the fragment body produces a hard continuum as well as line emission (X-ray and IR), including the K-shell lines of Si, S, Ar, Ca, Fe, and other elements ejected by SN. Detection of the X-ray line emission would help distinguish an ejecta fragment from the other possible source of hard continuum emission associated with a SNR, namely, a pulsar wind nebula (PWN).
A young SNR of an age of a few thousands years interacting with a molecular cloud can produce hundreds of X-ray sources associated with isolated ejecta fragments. They should be particularly numerous in starforming regions like those in the Galactic center region, where young core-collapsed supernovae in or near molecular clouds are expected to be present in abundance. The expected observational appearance of isolated ejecta fragments in a molecular cloud differs from what is seen in the Vela SNR. Ejecta fragments interacting with a dense molecular cloud are slowed down and crushed, and they are generally more bright. We will argue here that the X-ray emission spectra of ejecta fragments in a molecular cloud may be dominated by hard non-thermal components, because a powerful but very soft thermal component could be heavily absorbed. On the other hand, the spectra of fast supernova ejecta fragments propagating in a tenuous plasma, as it is the case in the Vela SNR, would be long-lived, less luminous and dominated by thermal emission.
The present paper focuses on IC 443. This is a SNR of a medium age, estimated by Chevalier (1999) to be 30,000 years, for which the number of X-ray sources from ejecta fragments should be much smaller than in a young SNR (possibly, only a few). It is, however, the best and most reliable laboratory to study this phenomenon since there are only very few examples of clearly established SNR-cloud interactions.
IC 443 (G189.1+3.0) is an evolved SNR of about 45′ size at a distance of 1.5 kpc (e.g. Fesen & Kirshner 1980). Radio observations of IC 443 (e.g. Braun & Strom 1986; Green 1986; Leahy 2004) show two half-shells. This appearance is probably due to interaction of the SNR with a molecular cloud that seems to separate the two half-shells. The molecular-cloud material has a torus-like structure (Cornett, Chin & Knapp 1977; Burton et al. 1988; Troja, Bocchino, & Reale 2006), that can be interpreted as a sheet-like cloud first broken by the expanding pre-supernova wind and then by the SNR blast wave. Plenty of evidence for shock-excited molecules in this region has been found (e.g. DeNoyer 1979; Burton et al. 1988; Dickman et al. 1992; Turner et al. 1992; van Dishoeck, Jansen, & Phillips 1993; Tauber et al. 1994; Richter, Graham, & Wright 1995; Cesarsky et al. 1999; Snell et al. 2005). The complex structure of the interaction region, with evidence for multiple dense clumps, is seen in 2MASS images (e.g. Rho et al. 2001). Three OH (1720 MHz) masers were found in IC 443 (Claussen et al. 1997; Hewitt et al. 2006, and references therein).
Soft X-ray maps of IC 443 based on ROSAT data (Asaoka & Aschenbach 1994) and recent radio observations (Leahy 2004) suggest that another SNR, G189.6+3.3, is seen in the IC 443 field (see also the XMM-Newton study by Troja, Bocchino, & Reale 2006). This makes the multiwavelength observational picture even more complex to interpret.
The field of IC 443 was observed in X-rays with HEAO 1 (Petre et al. 1988), Ginga (Wang et al. 1992), ROSAT (Asaoka & Aschenbach 1994), ASCA (Keohane et al. 1997; Kawasaki et al. 2002), BeppoSAX (Preite-Martinez et al. 2000; Bocchino & Bykov 2000), Chandra (Olbert et al. 2001; Bykov, Bocchino, & Pavlov 2005; Gaensler et al. 2006; Weisskopf et al. 2007), XMM-Newton (Bocchino & Bykov 2001, 2003; Troja, Bocchino, & Reale 2006), and RXTE (Sturner, Keohane, & Reimer 2004).
The X-ray emission of IC 443 below 4 keV is dominated by a number of thermal components (e.g., Petre et al. 1988; Asaoka & Aschenbach 1994; Kawasaki et al. 2002; Troja, Bocchino, & Reale 2006). The thermal-emission morphology is center-filled, with soft emission filaments visible at energies below 0.5 keV. A gradient of X-ray surface brightness at the SNR limb was found, as well as strong variations of absorbing column density , which indicates the complex molecular-cloud environment of IC 443 in the southern part of the remnant (e.g. Asaoka & Aschenbach 1994).
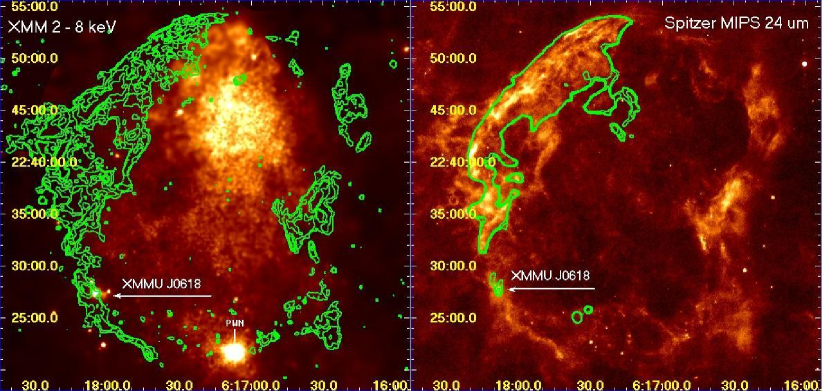
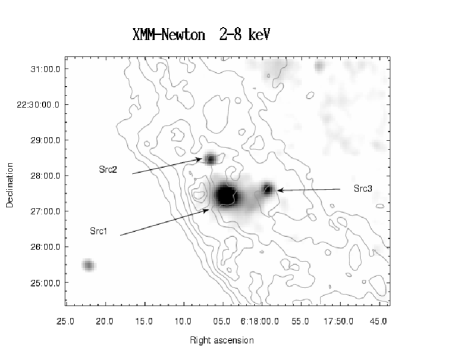
ASCA observations have established that the hard X-ray emission of IC 443 (above 4 keV) is dominated by localized sources in the southern part of the remnant (Keohane et al. 1997). In XMM-Newton observations Bocchino & Bykov (2003; BB03 hereafter) found 12 sources with fluxes over 10 in the 2–10 keV band. Six of the detected sources are located in a relatively small, of size, region projected onto the molecular cloud in the South-Eastern part of IC 443. BeppoSAX MECS observations (4–10 keV) showed two sources, 1SAX J0617.1+2221 and 1SAX J0618.0+2227, with evidence from the BeppoSAX PDS for the presence of hard emission up to 100 keV for the former (Bocchino & Bykov 2000). Observations of this source by Chandra (Olbert et al. 2001; Gaensler et al. 2006; Weisskopf et al. 2007) and XMM-Newton (Bocchino & Bykov 2001) established its plerionic nature. Leahy (2004) argued that the pulsar that powers this plerion is associated with G189.6+3.3 rather than IC 443. The nature of the second hard source – 1SAX J0618.0+2227 – remained unknown. This source, the brightest in the region (excluding the plerion), was resolved with XMM-Newton into two sources – the extended XMMU J061804.3+222732 (of 20′′ size) and the point-like XMMU J061806.4+222832. We will call them Src 1 and Src 2 respectively (note that the sources were listed as Src 11 and Src 12 in BB03). The position of XMMU J061804.3+222732 in the remnant is illustrated in Figures 1 and 2.
A dedicated Chandra observation of Src 1 has revealed a complex structure of a few bright clumps embedded in extended emission of 20′′ size (Bykov, Bocchino, & Pavlov 2005; BBP05 hereafter). The brightest clumps are the extended Src 1a and the point-like Src 1b. The apparent position of the source in a SNR – molecular cloud interaction region naturally leads to SNR-related interpretations. The observed X-ray morphology of Src 1 and the spectra of its components are consistent with expectations for a SN ejecta fragment interacting with a dense ambient medium. Alternatively, Src 1 could be interpreted as a PWN associated with either IC 443 or G189.6+3.3 (BBP05). However, one cannot exclude the extragalactic origin of the source, that is discussed in some detail in Section 4.7.
IC 443 is a candidate counterpart of the EGRET -ray source 3EG J0617+2238, with a flux of about 510-7 cm-2 s-1 above 100 MeV (Esposito et al. 1996). The spectrum of Src 1 extrapolated into the EGRET range is consistent with that of 3EG J0617+2238 (BBP05). Also the position of Src 1 is consistent (albeit marginally) with that of 3EG J0617+2238. Such a -ray luminosity can be expected for both the fragment and PWN interpretations. The forthcoming GLAST mission (e.g. Johnson 2006) will be able to provide an accurate position and spectrum of 3EG J0617+2238, thus helping to solve the issue. Src 1 lies far away from the 99% error circle of the TeV-regime source recently reported by MAGIC (Albert et al. 2007) in the Western part of IC 443 field. The apparent position of TeV MAGIC source is close to the 1720 MHz OH maser detected by Claussen et al. (1997).
We present here new results of a deep 80 ks observation of the region with XMM-Newton, imaging of the region with the Spitzer infrared observatory, and a new analysis of VLA radio observations. In § 2 a combined analysis of the new XMM-Newton observations and all the previous high-resolution X-ray data from Chandra and XMM-Newton is presented, including images, spectra, and time variations in the X-ray domain. In § 3 archival radio (VLA), IR (2MASS and Spitzer MIPS), and optical (POSS-II) data are used to constrain the nature of Src 1. A discussion of the obtained results and future prospects are presented in § 4.
2. X-ray data analysis
XMMU J061804.3+222732 (Src 1) was observed with XMM-Newton in 2000 and 2006, and with Chandra in 2000 and 2004 (Table 1). CIAO v.3.0 with CALDB v.3.2.2 was used for Chandra data processing, SAS v.20060628_1801-7.0.0 for XMM-Newton data processing, and the HEASOFT 6.1 suite, including XSPEC v.12.3, for spectral fitting.
In the course of XMM-Newton data reduction, patterns 0–4 of EPIC-PN detector events and patterns 0–12 of MOS events were used. To filter out the periods of enhanced particle background, we applied a standard method of soft flare detection111http://heasarc.gsfc.nasa.gov/docs/xmm/abc/node7.html. The filtering did not significantly change the good time for the data taken in 2000, but reduced it in the dataset of 2006.
In the Chandra observation of the year 2000, Src 1 is offset 176 from the ACIS aim point, on chip S4. To increase the quality of the ACIS chip S4 data the standard procedure was used to create an event2 file from the archival event1 file, including a run of the destreak task. As a result, the good time of the observation decreased from 11.5 to 9.6 ks. An appropriate webscript222http://asc.harvard.edu/cal/ASPECT/fix_offset/fix_offset.cgi was used to correct the Chandra event files for the systematic position offset.
| Obs ID | Observatory | Instrument | Date of observation | Exposure | Good time |
|---|---|---|---|---|---|
| (YYYY-MM-DD) | (ks) | (ks) | |||
| 760 | Chandra | ACIS-S | 2000-04-10/11 | 11.5 | 9.6 |
| PN | 23.2 | 19.5 | |||
| 0114100301 | XMM | MOS1 | 2000-09-27 | 25.6 | 25.1 |
| MOS2 | 25.6 | 25.1 | |||
| 4675 | Chandra | ACIS-S | 2004-04-12/13 | 58.4 | 56.2 |
| PN | 79.9 | 52.9 | |||
| 0301960101 | XMM | MOS1 | 2006-03-30/31 | 81.6 | 67.6 |
| MOS2 | 81.6 | 68.2 |
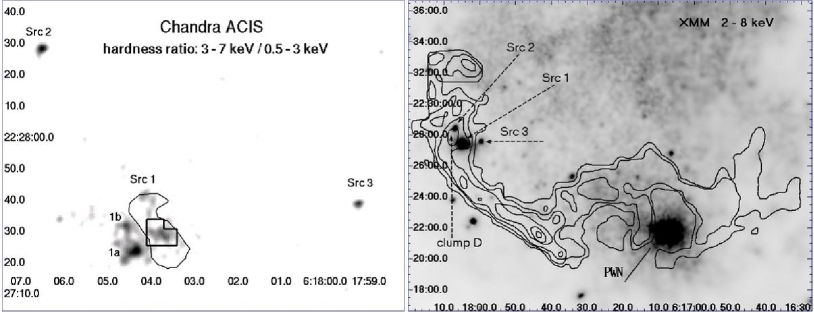
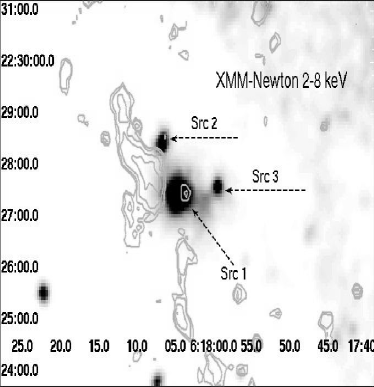
Figure 1 shows a wide-field view of IC 443, both in X-rays and in the medium IR 24 m band. Two X-ray images of the source region of interest here, obtained with Chandra and XMM-Newton , are presented in Figure 2. The coordinates of Src 1a and Src 1b obtained from the Chandra data with the celldetect algorithm (, and , respectively) do not differ from those reported by BBP05, as well as the position of Src 2 (). A nearby source, which we refer to as Src 3, is located at . In addition, the XMM-Newton data show evidence for an extended ‘bridge’ of diffuse emission between Src 1 and Src 3 (see Figures 1, 2, and 6). On the timescale of about 6 years, covered by the XMM-Newton observations used here (Table 1), it is not possible to detect a proper motion of the sources at a 1.5 kpc distance if they move with a transverse velocity 3000 km s-1.
 |
 |
 |
 |
 |
 |
 |
2.1. Source spectra
The line of sight to the source region intersects the supernova shell(s), the interior of the remnant, and the molecular cloud, each having different physical parameters. Therefore, the X-ray emission detected along the line of sight has multiple thermal and nonthermal components, in addition to the Galactic background. A SNR shell can be characterized by a power-law emission spectrum, the hot low-density interiors — by thermal plasma emission, and a dense molecular cloud may cause an appreciable absorption.
We have performed a series of spectral studies of Srcs 1, 2, and 3, the results being presented in Table 2 (power-law models), Table 3 (thermal models), and in the text of this subsection. Mekal thermal plasma models were used (e.g. Kaastra 1992) and the wabs model for absorption was applied (Morrison and McCammon 1983). Because of strong gradients in the soft X-ray surface brightness, one should carefully choose regions for spectral analysis. For the Chandra analysis, circular source regions of 10′′ radius surrounded by 10′′ –wide background annuli were used. For XMM-Newton, whose PSF is broader, source regions of 20′′ radius and annuli with 10′′ width were used. That results in an underestimation of a source flux caused by subtraction of the source photons regarded as background photons due to the wide XMM-Newton PSF wings. The effect is estimated to be about 20% of the source flux. That may account for the differences in the Chandra and XMM-Newton normalizations of the fitted source flux reported in Table 2. However, the fitted power-law indices and absorption values are not affected.
When comparing the Chandra and XMM-Newton spectra, such enlarged source extraction regions were also used for the Chandra data. For the spectral fitting, the count rate spectra were grouped with a minimum of 15 counts per bin. Table 2 summarizes the results of spectral fitting for Src 1, Src 2, and Src 3 with an absorbed power-law (using the wabs model for absorption; Morrison and McCammon 1983). Thermal plasma models for Src 1 and Src 3 yield very high and poorly constrained values of the temperature. However, the spectrum of Src 2 can be as well described with a mekal model as an absorbed emission of thermal plasma (see Table 3).
The high angular resolution of Chandra ACIS is useful for studying the spectra of the substructure of Src 1 in more detail. A elliptical source region around Src 1a, and a 2′′ radius source region around Src 1b were selected. For both regions, the background counts were extracted from an annulus with inner radius of 10′′ and outer radius of 20′′ centered between the two sources. The spectrum of Src 1a can be described as an absorbed ( = (1.10.8)1022 cm-2) power-law with photon index = 1.5 and a thermal plasma component with keV. The reduced of this fit is 0.71 at 14 d.o.f. The spectrum of Src 1b can be described as an absorbed ( = 1.21022 cm-2) power-law with photon index = 2.0. The reduced of this fit is 0.73 at 9 d.o.f. The quoted errors are at the 90% confidence level (for one interesting parameter). The confidence contours for the spectral parameters of the whole Src 1 are shown in Figure 3. These results are in a good agreement with those obtained by BBP05.
The best-fit value of for a power-law model of Src 1a (that dominates the 10′′ radius Src 1 in Table 2, line 4) is well below that for the South-Eastern region of IC 443 obtained with ROSAT and XMM-Newton (71021 cm-2). If one assumes that Src 1a, Src 1b and the extended hard emission are at the same column density 71021 cm-2, one has to add a soft thermal component (of T 0.1 keV) for Src 1a (See Fig. 3 in BBP05). Results of such fits, with the additional optically thin thermal plasma emission (mekal) component for Src 1a, are presented in Table 1 of BBP05. Such a component is localized in Src 1a and can be explained if the source is a supersonic ejecta fragment (given a range of shock velocities up to 300 km/s).
Moreover, BBP05 showed that a satisfactory fit can be also obtained with a blackbody component used instead of mekal. Such a blackbody plus power-law fit, with a temperature of about 0.1 keV, radius of about 3 km, and power-law index of about 1.3 (at fixed = 71021 cm-2) can be understood — if Src 1a is a pulsar wind nebula — as a combination of thermal emission from the surface of a neutron star plus nonthermal emission from the neutron star magnetosphere and/or surrounding pulsar wind nebula.
It should be noted that the high plasma temperatures obtained to fit a thermal model to the Chandra spectrum of the region of a 20′′ radius around Src 1 are due to a contribution of hard spectra of Src 1a, Src 1b and their neighbourhood. If one considers the spectrum of this circle region with a removed inner circle of 11′′ radius surrounding Src 1a and Src 1b (the resulting annulus is named Src 1* in Table 3), one obtains a fit with = 1.1 1022 cm-2, T = 5.3 keV with = 0.93 at 78 d.o.f.
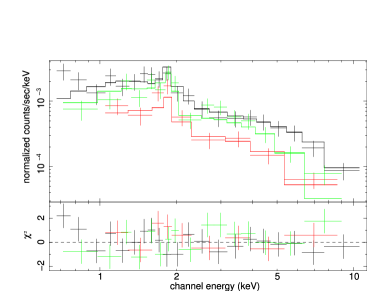
A line feature centered at keV is seen (Figure 4, top row) at the 99% confidence level in the XMM-Newton spectrum extracted from the extended nebula of Src 1 — the L-shaped region shown in the left panel of Fig. 2. The combined MOS1 + PN + ACIS spectrum of the L-shaped region can be modeled as an absorbed =(0.30.2)1022cm-2] power-law with =1.1 and a possible Si line at 1.90.1 keV of a fixed 0.1 keV width.
To investigate the Chandra spectrum of the point-like Src 3, source counts were extracted from a small circle of 2′′ radius. The background counts were taken from an annulus with the inner radius of 3′′ and the outer radius of 10′′ . The spectrum is shown in Figure 4 (bottom row). It contains a feature at 3.7 keV that is possibly due to an Ar emission line. There is, however, an alternative possible interpretation of the line as a redshifted Fe K line that assumes that Src 3 is extragalactic.
The XMM-Newton spectrum of the faint bridge between Src 1 and Src 3 can be modeled either as absorbed (=0.51022 cm-2) thermal plasma (T = 5.5 keV) emission with = 0.79 at 74 d.o.f. or as an absorbed (=0.61022 cm-2) power-law of photon index = 2.0 with = 0.74 at 74 d.o.f.
The 20′′ –aperture Chandra spectra of the studied sources Src 1, Src 2 and Src 3 can be simultaneously modeled by an absorbed (=0.81022 cm-2) power-law of the photon index = 1.80.2 with = 1.1 at 315 d.o.f. or by a thermal plasma (mekal) model with =(0.60.11022 cm-2, T=12 keV with = 1.1 at 315 d.o.f.
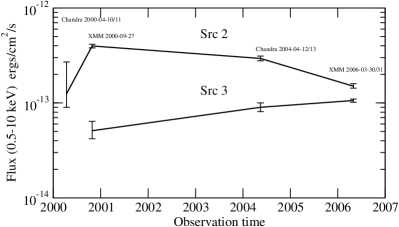
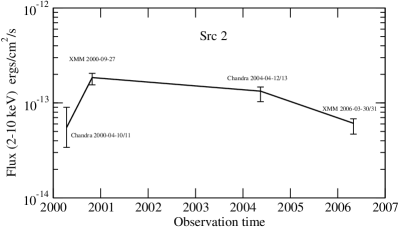
Using all the data available, we found that Src 1 has not shown a significant time variation, its flux being consistent with that originally obtained by BB03. Some evidence (at the 90% confidence level) is found for time variation in the unabsorbed flux of Srcs 2 and 3, as illustrated in Fig. 5. The unabsorbed flux of Src 2 in the 0.5–10 keV band decreased between 2000/09 and 2006/03 with 99% confidence. In the 2–10 keV band the flux increased between 2000/04 and 2000/09 and later decreased with 90% confidence. The unabsorbed flux of Src 3 increased between 2000/09 and 2006/03 with 90% confidence. More observations are needed to firmly conclude on the issue.
 |
 |
 |
 |
3. Radio, IR and optical data analysis
3.1. VLA data analysis
A radio image of IC 443 was obtained from archival VLA333The VLA of the NRAO is a facility of the NSF, operated under cooperative agreement by Associated Universities, Inc. data obtained in 1997 at 1465 MHz from observations in the C and D arrays. The interferometric image has an angular resolution of 141 132. To recover information at all spatial frequencies, the synthesis data were combined with single dish data from the survey at 1408 MHz carried out with the 100 m MPIfR telescope (Reich, Reich & Fürst 1990). The final high fidelity image has an angular resolution of 378 343, PA = 46.5o, and an average rms noise mJy/beam. The total integrated flux density over the whole IC 443, Jy, is in a good agreement with the total integrated flux obtained from single dish observations ( Jy, Mufson et al. 1986), which assures the accuracy of flux density estimates over selected portions of the SNR.
Figure 1 (right panel) shows the contours of the 20 cm emission of SNR IC 443 superimposed on a 24 m Spitzer map. The radio map for the source region of interest made from interferometric data only is shown in Figure 6 as contours on a 2–8 keV XMM-Newton X-ray image. This figure shows that Src 1 lies at the periphery of IC 443, far from the main SNR radio shell (that is situated in the North-East of the remnant), but near a localized radio excess. At the angular resolution and sensitivity of the present data, no radio continuum source, either point-like or extended, could be associated with any of the X-ray sources. The local radio flux density, obtained by integrating the radio emission over the region containing 97% of the XMM-Newton counts of XMMU J061804.3+222732, is () mJy.
3.2. Spitzer MIPS imaging and photometry
The field of IC 443 was the target of Spitzer MIPS scan observations r4616960 (catalog r4616960), r4616960 (catalog r4617216), and r4616960 (catalog r4617472) performed on 2005 November 9 (PI: G. Rieke). The Multiband Imaging Photometer for Spitzer (MIPS) aboard the Spitzer Space Telescope (Werner et al. 2004) is capable of imaging and photometry in broad medium-IR spectral bands centered at 24m, 70m, and 160 m, and low-resolution spectroscopy between 55m and 95m (Rieke et al. 2004). The 24m band covers the range of 21.3m – 26.1m, the 70m band covers the range of 61.5m – 80.5m. Srcs 1, 2, and 3 were outside the field of view of the Spitzer IRAC near-IR camera.
We used the standard MOPEX 030106 software (Makovoz et al. 2006) to construct mosaic images and extract point sources from the archival BCD-level data (pre-processed by the S13 pipeline) according to the recipes in the Spitzer cookbooks444http://ssc.spitzer.caltech.edu/documents/datademos/ and the MIPS data handbook555http://ssc.spitzer.caltech.edu/mips/dh/mipsdatahandbook3.2.pdf. The first frames of each sequence were ignored. A total of 5940 individual frames were mosaiced for each of the MIPS bands. The net exposure of the mosaic maps is equal to 65–92 frames (2.62 s each) for the 24m band and 12–15 frames (3.15 s each) for the 70m band (different parts of the map were obtained with different effective exposures). Outlier detection was performed to exclude moving and solar system objects. A wide-field Spitzer MIPS image of the whole remnant is shown in Figure 1.
Using the APEX software suite (Makovoz et al. 2006), we detected two point-like sources, at ′′ and at ′′ . The sources were detected only in the 24m band with fluxes 1.770.07 mJy (S/N = 8.2) and 1.890.07 mJy (S/N = 8.0), respectively. The latter source coincides with the absorbed near-IR source 2MASS J06180406+2227345 detected only in the Ks band (, , ). The dereddened Ks (2.02 – 2.30 m) flux of the source ranges from 0.64 to 1.21 mJy (considering the uncertainty of the extinction value), that is (1.2–2.2)10-13 ergs cm-2 s-1.
According to the extinction maps of Schlegel, Finkbeiner & Davis (1998), the total Galactic absorption towards Src 1 corresponds to . This sets an upper limit because the source is only 1.5 kpc away. Moreover, the method of Schlegel et al. (1998) is known to overestimate the extinction for dense regions by a factor of 1.3–1.5 (e.g., Arce & Goodman 1999). Thus, it is likely that –4, consistent with the earlier estimates by van Dishoeck, Jansen, & Phillips (1993).
There is another bright point-like source, 2MASS J06180359+2227227 = HST N8JT007783, projected onto the area of Src 1. The source is clearly seen in the optical and near-IR bands (, , , , ). The dereddened Ks flux of the source ranges from 20.1 to 27.6 mJy, that is (3.6–5.0)10-12 ergs cm-2 s-1. Most likely, 2MASS J06180359+2227227 is a foreground star.
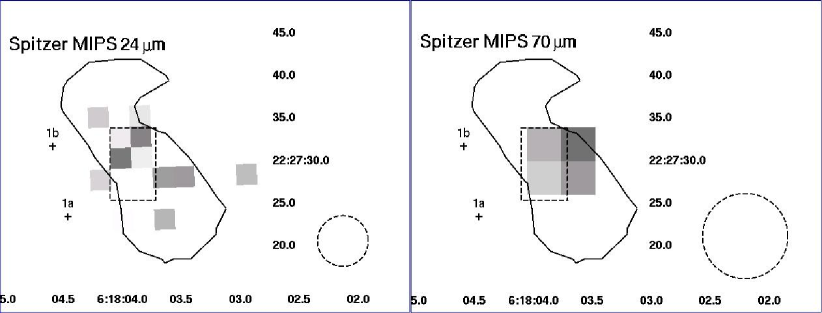
An extended excess of IR emission is seen in the 24m mosaic map (left panel of Figure 7), coinciding with the extended emission region detected with Chandra ACIS in the western part of Src 1 and with 2MASS J06180378+2227314, an extended (14′′ 7′′ ) source of near-IR emission listed in the 2MASS XSC catalog with observed isophotal666http://www.ipac.caltech.edu/2mass/releases/allsky/doc/sec4_5e.html Ks = 12.860.12. The excess is also seen in the 70m band (right panel of Figure 7), its apparent size being comparable with the beam size. The aperture photometry estimates of the excess (with aperture corrections applied) are mJy (90% err.) 1.1 mJy (3 error of the pipeline) for the 24m band and 840 mJy (90% err.) 170 mJy (3 error of the pipeline) for the 70m band. The apertures of a 6′′ and 8′′ radius were used for the 24m and 70m bands, respectively. These values correspond to (2.8)10-13 ergs cm-2 s-1 for the 24m band and (9.7)10-12 ergs cm-2 s-1 for the 70m band. Notice, that the latter value is actually an upper limit. Depending on the extinction value, the dereddened flux of 2MASS J06180378+2227314 is 6.4–10.7 mJy, that is (1.2–1.9)10-12 ergs cm-2 s-1 in the Ks band.
The extended source is seen neither in the J and H bands of the 2MASS survey (Skrutskie et al. 2006) nor in the archival blue, red, and infrared images of the POSS-II survey (Reid et al. 1991). With the daophot package (Stetson 1987) integrated into the NOAO IRAF software suite, the following upper limits were obtained for 2MASS J06180378+2227314: 6.610-13 ergs cm-2 s-1 in the 2MASS J band, 2.910-13 ergs cm-2 s-1 in the 2MASS H band, 8.010-11 ergs cm-2 s-1 in the POSS-II blue band (3750–5500 Å), 3.010-12 ergs cm-2 s-1 in the POSS-II red band (5900–7100 Å), and 3.010-11 ergs cm-2 s-1 in the POSS-II IR band (7350–8750 Å). The limits assume the estimated extinction for the source ().
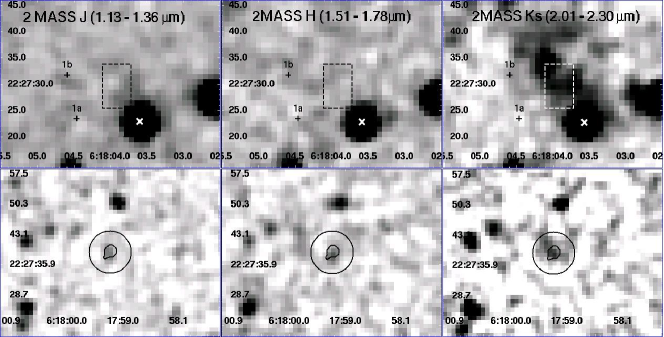
The point-like X-ray source Src 3 is also seen as a weak IR source in all the bands of the 2MASS survey, with , , (see lower panels of Figure 8).
| * | ||||||
|---|---|---|---|---|---|---|
| * | ||||||
| Source(radius)/Background | Observatory, year | Source counts | aa is in units of 1022 cm-2. | bbNormalization parameter is the spectral flux in photons cm-2 s-1 keV-1 at 1 keV. | /dof | |
| * | ||||||
| Src 1 (20′′ )/bkg2 | XMM 2000 A | 1064/505/507 | 1.13/124 | |||
| Src 1 (20′′ )/bkg2 | XMM 2006 A | 4574/1899/2150 | 1.05/418 | |||
| Src 1 (20′′ )/bkg2 | Chandra 2004 | 2973 | 0.84/151 | |||
| Src 1 (10′′ )/bkg1 | Chandra 2004 | 1314 | 0.97/73 | |||
| Src 2 (20′′ )/bkg2 | XMM 2000 A | 955/418/470 | 0.94/107 | |||
| Src 2 (20′′ )/bkg2 | XMM 2006 B | –/944/1003 | 0.88/105 | |||
| Src 2 (20′′ )/bkg2 | Chandra 2004 | 1829 | 0.98/94 | |||
| Src 2 (10′′ )/bkg1 | Chandra 2004 | 1270 | 1.05/66 | |||
| Src 3 (20′′ )/bkg2 | XMM 2000 B | –/235/225 | 1.15/26 | |||
| Src 3 (20′′ )/bkg2 | XMM 2006 A | 2730/940/1080 | 1.10/234 | |||
| Src 3 (20′′ )/bkg2 | Chandra 2004 | 1251 | 1.10/66 | |||
| Src 3 (10′′ )/bkg1 | Chandra 2004 | 620 | 1.36/34 |
Note. — ‘A’ means PN, MOS1, MOS2 data combined, while ‘B’ means MOS1 and MOS2 data combined; ‘bkg1’ denotes a background annulus with inner radius of 10′′ and outer radius of 20′′ , ‘bkg2’ denotes a background annulus with inner radius of 20′′ and outer radius of 30′′ . The source counts in the third column are given as PN/MOS1/MOS2 for XMM and ACIS for Chandra. All errors quoted in the table are at the 90% confidence level for one interesting parameter.
| * | ||||||
|---|---|---|---|---|---|---|
| * | ||||||
| Source(radius)/Background | Observatory, year | Source counts | aa is in units of 1022 cm-2. | bb Mekal model normalization parameter: , where D is the angular size distance to the source in cm, and is the electron and hydrogen density in , integration is done over source volume. | /dof | |
| * | ||||||
| Src 1 (20′′ )/bkg2 | XMM 2000 A | 1064/505/507 | 1.1/124 | |||
| Src 1 (20′′ )/bkg2 | XMM 2006 A | 4574/1899/2150 | 1.1/418 | |||
| Src 1 (20′′ )/bkg2 | Chandra 2004 | 2973 | 0.85/151 | |||
| Src 1 (10′′ )/bkg1 | Chandra 2004 | 1314 | 79.8 | 0.93/73 | ||
| Src 1* (20′′ )/bkg2 | Chandra 2004 | 1781 | 0.93/78 | |||
| Src 2 (20′′ )/bkg2 | XMM 2000 A | 955/418/470 | 1.1/107 | |||
| Src 2 (20′′ )/bkg2 | XMM 2006 B | –/944/1003 | 0.98/105 | |||
| Src 2 (20′′ )/bkg2 | Chandra 2004 | 1829 | 1.2/94 | |||
| Src 2 (10′′ )/bkg1 | Chandra 2004 | 1270 | 1.4/66 | |||
| Src 3 (20′′ )/bkg2 | XMM 2000 B | –/235/225 | 1.2/26 | |||
| Src 3 (20′′ )/bkg2 | XMM 2006 A | 2730/940/1080 | 1.2/234 | |||
| Src 3 (20′′ )/bkg2 | Chandra 2004 | 1251 | 1.1/66 | |||
| Src 3 (10′′ )/bkg1 | Chandra 2004 | 620 | 1.3/34 |
Note. — ‘A’ means PN, MOS1, MOS2 data combined, while ‘B’ means MOS1 and MOS2 data combined; ‘bkg1’ denotes a background annulus with inner radius of 10′′ and outer radius of 20′′ , ‘bkg2’ denotes a background annulus with inner radius of 20′′ and outer radius of 30′′ . The source counts in the third column are given as PN/MOS1/MOS2 for XMM and ACIS for Chandra. All errors quoted in the table are at the 90% confidence level for one interesting parameter. Src 1* is the annulus region of Src 1(20′′ ) with the removed 11′′ radius circle containing Srcs 1a and 1b.
4. Discussion
Below we discuss the multiwavelength data obtained for the region that includes Src 1 and Src 3 and some implications of the data analysis. We will refer to this extended source as J0618.
The results of the multiwavelength data analysis presented above can be summarized as follows. The hard extended X-ray source Src 1 consists of ‘clumps’, both extended (Src 1a) and point-like (Src 1b), which emit hard X-ray continuum. There are signatures of a thermal component of temperature 0.2 keV in the spectrum of Src 1a, and of X-ray line emitting clumps side by side with an extended IR source. The X-ray morphology of the extended source J0618 is complex. Src 3 is point-like according to the Chandra observations. The XMM-Newton image in Figure 2 shows evidence for an extended bridge of diffuse emission connecting Src 1 with Src 3. Longer observations are needed to establish firmly the possible presence of this faint bridge and of an X-ray halo around Src 3 (see e.g. Figure 6).
The X-ray spectra of Srcs 1a and 1b and Src 3 are characterized by power-law components with photon indices 1.5. The spectrum of the Src 1 region shows a feature at about 1.8 keV with a flux of a few times 10 at the 90% confidence level, which might be attributed to a Si K-shell line. A feature at 3.7 keV was found in the X-ray spectrum of Src 3 at the 99% confidence level, which might be attributed to an Ar K-shell line, unless the line is a redshifted Fe K line of an extragalactic source. A firm detection of the lines from the localized clumps with XMM-Newton is hampered by the presence of strong hard non-thermal continuum emission.
An extended source of IR emission was found at the North-Western edge of Src 1 with a dereddened flux in the 24m band of Spitzer MIPS of about 310-13 ergs cm-2 s-1 and an upper limit for the 70m band of about 10-11 ergs cm-2 s-1. The near-IR flux of the source is about 210-12 ergs cm-2 s-1 in the 2MASS Ks band. The source is not seen in the J and H bands of the 2MASS survey, nor in the POSS-II optical bands. The upper limits are 10-13 ergs cm-2 s-1 for the H band, 10-13 ergs cm-2 s-1 for the J band, 10-11 ergs cm-2 s-1 for the POSS-II infrared band (0.7–0.9 m), 10-12 ergs cm-2 s-1 for the POSS-II red band (0.6–0.7 m), and 10-11 ergs cm-2 s-1 for the POSS-II blue band (0.4–0.6 m). These upper limits will be used below to constrain the model we propose for J0618.
Earlier studies of molecular emission from the extended region of apparent interaction of the IC 443 SNR with the neighboring molecular cloud have indicated the presence of emission from both fast and slow shocks (e.g. Burton et al. 1988; Dickman et al. 1992; van Dishoeck et al. 1993, Snell et al. 2005). Molecular clouds are known to have highly inhomogeneous internal structure (e.g. Blitz 1993). A molecular cloud consists of numerous dense clumps with a rather small volume filling factor, embedded in an interclump matter of a modest density of 5–20 . The presence of a wide range of dense molecular emission clumps down to about 1′′ scale has been established in the cloud around Src 1 by Richter, Graham, and Wright (1995).
The apparent coincidence of the extended structured non-thermal X-ray continuum source J0618 with local excesses of IR emission can be understood in the framework of a model of interaction of a molecular cloud with a fast ballistically moving object. If the object was ejected by a SNR, it could be either a massive fast moving ejecta knot or a pulsar wind nebula. In both cases shock waves will be driven into the cold matter of the cloud. Such a scenario and the expected properties of the emitted IR and X-ray radiation will be discussed below. A large power [above 1035 erg s-1] released by a fragment of velocity about 300 km s-1 being decelerated by a dense cloud is emitted as UV photons. The UV emission will create an HII region surrounding the fragment. The detected Spitzer emission and all of the IR/optical upper limits are consistent with the continuum emission of an HII region of a temperature about 104 K and a number density above 100 cm-3. However, to explain the detected near-IR flux of the source in the 2MASS Ks band one should consider an additional emission component most likely due to line emission of shocked molecular hydrogen. The radio, IR, and optical emission of the HII region surrounding J0618 will be addressed in Sections 4.2 and 4.3.
4.1. X-ray emission from isolated fast ejecta fragments
An important distinctive feature of J0618 is the presence of extended non-thermal hard X-ray emission. This can be explained in the framework of a model of interaction of a massive isolated ejecta fragment moving with a velocity above 300 through a molecular cloud. In the model by Bykov (2002, 2003), X-ray emission from an ejecta fragment of 0.2 – 0.3 pc size ( at 1.5 kpc, the angular size of such a fragment in IC 443), interacting with a molecular cloud was estimated. The fragment mass was assumed to be , containing of Si. The “knot” traveled through an inter-clump medium of a number density with a velocity of (the corresponding postshock temperature is keV). The model predicts a hard continuum emission with a photon index and 1.8 keV Si line emission with a flux of . The K-shell lines are excited by both non-thermal and thermal electrons.
In the case of J0618, a slightly more massive fragment highly structured due to interaction with the dense molecular clump would be more realistic. A range of sub-fragment velocities around the mean value 200–300 is consistent with the age of IC 443 of about 30,000 year advocated by Chevalier (1999). Such a fragment would provide line fluxes of a few times , consistent with the estimated fluxes of the putative Si and Ar lines (Figure 4) from J0618. The effects of clumping of the metal-rich ejecta would result in an intermittent spatial structure of X-ray line emission from the source. It is worth to mention that the intrinsic absorbing column of a fragment could be substantial ( ), especially if the fragment contains metal-rich ejecta material.
The relatively low velocity and the high absorbing column of an ejecta fragment in a dense molecular cloud makes its observational appearance to be very different from that observed in Vela shrapnel A. The observed emission of Vela shrapnel A is strongly dominated by an optically thin thermal component (of about 0.5 keV) of a shock heated plasma (Miyata et al. 2001). Contrary to the Vela case, a thermal emission of a thin plasma of temperature 0.1 keV is not the main component in the observed X-ray spectra of J0618 because of the high absorption. A hard non-thermal emission dominates the X-ray spectrum of J0618.
4.2. Energetics of an X-ray emitting SN ejecta fragment
The models of an isolated X-ray source involving the interaction of a supernova blast wave with dense ambient matter suggest that the keV emission is due to bremsstrahlung of shock-accelerated electrons (Bykov et al. 2000; Bykov 2002). Synchrotron X-ray emission would require electrons with TeV energies accelerated by shocks of speed well above 1,000 km s-1, which is hard to expect for a middle-aged SNR in a dense ambient medium, unless the moving object is a pulsar wind nebula.
The radiative efficiency of nonthermal bremsstrahlung is known to be low at keV energies. This means that to produce a hard X-ray continuum at a rate , an electron of energy dissipates energy at a rate via Coulomb losses in a medium of an average charge , and — see e.g. Akhiezer & Berestetsky (1957). Therefore, to produce the X-ray emission at the observed level of about by electrons accelerated to 50–100 keV, the dissipated power must be about . The total dissipated power . Here is the efficiency of electron acceleration by a shock, providing .The electron energy = 50 keV was assumed in the estimation. Since in an oxygen/silicon-rich gas an enhanced metallicity of an ejecta fragment (dependent on mixing of the ejecta with the ambient matter) could somewhat compensate the bremsstrahlung inefficiency providing . Note that the power required to produce radio-emitting relativistic electrons in clump D is also just above .
The upstream ram pressure power dissipated at the forward shock of a ballistically moving fragment, , is the source of gas heating and particle acceleration. Here is the shock radius of J0618 (measured in 20′′ ). The mechanical power in the shock model must not exceed , resulting in the condition to be fulfilled. Therefore, ejecta fragments of velocity moving through a cloud of density will have , if . Thus, the observed patchy structure of the X-ray emission that is apparent in the Chandra ACIS images of J0618 could be attributed to structured metal clumps of the ejecta of IC 443.
How can one directly detect or constrain the power dissipated by the shock in the model of IC 443 ejecta fragment ballistically moving through a molecular cloud? The gas temperature behind the standard single-fluid strong MHD shock can be estimated as . For a shock with energetic particle acceleration efficiency 10% that we consider here the postshock temperature should be reduced by a factor of about 1.2 to account for the effects of the energy flux carried away with energetic particles (see e.g. Bykov 2002). The postshock gas cooling distance estimated by Hartigan, Raymond, and Hartmann (1987) is about 1.810 cm. The shock of a velocity 300 in the molecular cloud is radiative with the cooling layer angular size of 0.15′′ . If the extended structure of Src 1a seen in Figure 2 of BBP05 is indeed due to the thermal emission of hot postshock gas then 0.03 would explain both the extension of about 5′′ and the luminosity of soft thermal component below 10 discussed in BBP05. Most of the shock power, however, is not in the soft X-ray emission of shock heated gas, but rather in UV–optical emission of the radiative shock dominated by UV lines of OVI at 1035 Å, Lyα and He II at 304 Å(e.g. Hartigan, Raymond, and Hartmann 1987).
At the same time the UV photons produced by the radiative bow shock of ejecta fragment with a luminosity , will be absorbed and reprocessed, mostly to IR emission, in an expanding HII region surrounding the bow shock of J0618. Note here that the shape of the HII region could be different from that of the non-thermal X-ray nebulae, but it should overrun the bow shock of J0618. From the apparent position of J0618 in the molecular cloud and the estimated fragment velocity one may conclude that it entered the molecular cloud about 1,000 years ago. Assuming that all of the UV photons produced by the radiative bow shock are absorbed in a spherical layer of an homogeneous ambient matter, one can obtain the estimation of the HII region radius of about 610 cm (see e.g. Spitzer 1978). In fact, the geometry of J0618 is more complex than a spherical HII region because of the motion of the extended emitting fragment and because of the strong inhomogeneity of the ambient molecular cloud down to the arcsecond scale as was observed by Richter, Graham, and Wright (1995). In the interclump matter of density below 100 the scale size of the HII region would exceed the apparent X-ray size of J0618. On the other hand, the number density of the clump D located in a close vicinity of J0618 was estimated by van Dischoeck et al. (1993) to be above 10 and the size of the HII region is consistent with the size of the 24 m emission excess around clump D [of about (2–3)10] apparent in Spitzer image presented in the right panel of Figure 6. Although very simplified, such a model allows us to estimate the radio, IR, and optical emission of the shock-produced HII region.
4.3. Radio–IR–optical continuum and line emission of the HII region
The emission of the HII region consists both of continuum emission of a thin thermal plasma of a kinetic temperature about 10,000 K and of a rich emission line spectrum (see e.g. Spitzer 1978). The specific appearance and the chemistry of the mostly neutral photodissociation region in molecular clouds were reviewed by Hollenbach and Tielens (1999). In the standard case the interstellar HII regions are powered by massive luminous stars. In the case of J0618 the source of the ionizing radiation is an extended fast moving bow shock and the ionized region is likely unsteady. That makes an accurate modelling of the system rather complicated, so we shall present here some approximate estimations of the expected IR/optical fluxes from the HII region. The observed 24 m Spitzer MIPS, 2MASS Ks and 1.4 GHz radio emission, as well as the upper limits provided by the other Spitzer, 2MASS and POSS-II observations of J0618 were modelled as continuum emission of a hot ionized plasma of a temperature ranging from 8,000 to 20,000 K. The modelled fluxes were corrected for interstellar extinction for a wide range of AV values below 8, since A 8 roughly corresponds to 1.51022 cm-2 – the maximal value allowed by the fits to the Chandra data presented in Fig. 3. Thus all the optical and IR measurements of J0618 were used to constrain both the kinetic temperature of the HII region and the parameter , where is the electron number density in the HII region measured in units of 103 cm-3, and is defined in Section 4.2. It was found that the measured 24 m flux of the source can be explained by a thermal continuum of a 10,000 K temperature HII region and 0.03 with A 6. Since the continuum emissivity is the apparent patchy image of 24 m emission could be due to the clumpy structure of the ejecta fragment.
The continuum emission from the HII region is consistent with the upper limits obtained from Spitzer, 2MASS and POSS-II observations of J0618. The radio flux density from such an HII region is about 30 mJy. The flux density obtained by integrating the 1.4 GHz radio emission over a larger (an arcminute scale size) region with VLA was about 60 mJy. Therefore the 1.4 GHz radio flux is not in a conflict with the HII region model for the parameter 0.03. We found also that the flux of the hydrogen recombination Hα line from the HII region is below the upper limit of 10-12 ergs cm-2 s-1 obtained from the POSS-II red band (0.6–0.7 m) observation discussed above.
The estimated parameter 0.03 corresponds roughly to 160 . The bow shock radius estimated from X-ray image is 1 implying that the derived electron density in the bright part of the HII region in J0618 is dominated by the compressed postshock flow. Then the preshock ambient density in the radiative shock can be estimated from , providing the ambient gas density , generally consistent with that expected in the interclump matter of a molecular cloud. A substantial part of the powerful UV emission from the radiative shock of J0618 will irradiate the nearby dense molecular clump D providing another HII region of a surface brightness and high luminosity well in excess of that from J0618 that is clearly seen in Fig. 6. In the frame of the ejecta fragment model of J0618 we estimated that at least a substantial amount of 24 m flux from clump D [that is about (2–3)10] can be attributed to the HII region excited by the UV emission from the nearby source J0618.
That model provides, however, only about one third of the observed 2MASS Ks band flux of J0618, and that can not be simply relaxed with an appropriate HII region parameters choice. Thus, an extra contribution in the 2MASS Ks band at the level of 10-12 ergs cm-2 s-1 is required. That contribution may come, most likely, from the emission lines of the shocked molecular hydrogen in J0618 and would require the presence of C-type molecular shocks of velocity 30 km s-1 in the close vicinity of J0618. Moreover, the atomic fine-structure lines could contribute to the 24 m emission detected by Spitzer MIPS if supernova ejecta drive J-type shocks of about 100 (and faster) into dense molecular clumps. We discussed above only the emission produced by the forward bow shock of the fragment, however slower reverse shock will also be present and since the ejecta fragment body is likely very inhomogeneous the real structure is likely even more complex. Relevant line emission models will be briefly reviewed in the next subsection.
4.4. IR-line emission in radiative shock models
Atomic fine structure lines of [OI] (63 m) and [FeII] (26 m) could dominate the emission in the Spitzer MIPS 70m and 24m bands. The lines are known to trace fast radiative shocks in molecular cloud material. A comprehensive study of radiative shocks in interstellar clouds has been done by Hollenbach and McKee (1989; HM89 hereafter). They have shown that the intensity ratio of [OI](63 m)/[FeII](26 m) is about 10 for a shock wave in a cloud of a density 103 . They estimated the [OI] (63 m) IR line intensity as ergs s-1 sr-1 for a shock of a velocity =150 and demonstrated that it scales roughly linearly with . The combination of optical line emission of OI at 6300 Å, CII (2326 Å), and OII (3726 Å) provides the dominating gas coolant in transparent systems of 10. The line intensities were obtained by HM89 under the assumption of standard solar composition with account for the interstellar gas depletion to dust grains. The IR-optical line intensities from shocks driven by (and into) metal-rich ejecta could be produced with lower pre-shock number densities ncl than those modeled by HM89, and should be re-scaled respectively. This can reduce the pre-shock density required to match the observed fluxes.
Applying the HM89 model intensities to an IR source of an angular area (measured in units of 100 arcsec2) as discussed in section 3.2, one obtains a [FeII] (26 m) line flux . Here is the pre-shock number density in units of 10 and is the shock velocity in 10. To reach the 24m flux of about as estimated from the Spitzer MIPS data, one would need . As the estimated emission area is , one needs to account for the observed IR emission. The [FeII](26 m) line could provide a sizeable part of the 24 m Spitzer MIPS flux. The associated model flux of the [OI] (63 m) line, is consistent with the upper limit derived above. It is apparent from Figure 2 that Src 1 is located near the shocked molecular clump D presented in a map by van Dishoeck, Jansen, & Phillips (1993). Typical densities of molecular clumps, studied by van Dishoeck et al. (1993) are . The condition can be matched by either a slow shock of velocity in the outskirts of clump D, or by a fast shock of in the interclump medium.
Near-IR metastable lines of FeII at 1.3 m and 1.7 m have a rather flat shock velocity dependence above 100. The intensity of the brighter FeII line at 1.3 m scales roughly linearly with , and it is about . This estimate is close to, but still consistent with the upper limit of the flux in the 2MASS J band discussed in Section 3.2. A near-IR NI (1.04 m) line flux was predicted by HM89 to be at the level comparable with that of [OI] (63 m), and a SI (1.1 m) line flux similar to that of FeII at 1.3 m.
From the apparent lack of extended emission in the POSS-II red band (0.6–0.7 m) the flux upper limit for OI (6300 Å) can be estimated as ergs cm-2 s-1 (assuming the reasonable extinction to Src 1 as ). The flux limit is below the value predicted by HM89 for the OI(6300 Å)/[FeII](26 m) ratio for a transparent system with shock velocity 1. However, the line ratio is increasing with shock velocity for , and, for example, a fast J-type (see Draine 1980 for a definition of J- and C-type shocks) radiative shock of in a medium of , could explain both the observed [FeII] 26 m line flux and the derived upper limit for the OI (6300 Å) line flux. Note that optical line fluxes from a radiative shock propagating into oxygen-rich ejecta material could be reduced by heat-conduction effects (e.g. Borkowski & Shull 1990).
An important diagnostic IR-line ratio sensitive to the shock velocity is [NeII](12.8 m)/[FeII](26 m). The ESO VLT Spectrometer and Imager for the Mid-Infrared (VISIR) is an optimal instrument for observations in the two mid-infrared atmospheric windows: the 8–13 m N band with a 192 192 FOV and the 16.5–24.5 m Q band with a 323 323 FOV (Lagage et al. 2006). The spectrometer could detect [NeII](12.8 m) predicted by the radiative shock model of HM89 and the continuum emission from Src 1 HII region, thus discriminating between the two models.
The model of a single fast radiative J-type shock developed by HM89 underpredicts the near-IR flux (above ) observed in the Ks band from the extended source 2MASS J06180378+2227314, closely associated with the Spitzer MIPS 24 m excess (Figure 7). Thus, a combination of fast and slow shocks is needed to explain the IR emission from J0618. The same conclusion has been made in most of the studies of molecular emission of the south-western region of IC 443. Burton et al. (1990) argued that both fast dissociative J-type and slow C-type shocks must be present in the extended southern cloud of IC 443 to explain the observed line fluxes [see also Snell et al. (2005) for a recent discussion]. Analyzing different shock models, including a time-dependent one, Snell et al. (2005) concluded that no single-shock model can explain the existing observations, and a range of shock velocities is required.
4.5. Shocks in a molecular cloud driven by ejecta fragments
A wide range of shock velocities in a molecular cloud is required to explain the IR and X-ray observations of Src 1. Slow molecular C-type shocks are required to explain the observed 2MASS Ks band emission.
Molecular emission occurs when a fast ejecta fragment collides with molecular clumps of different densities, , producing multiple shocks of velocities . This can explain the shock velocity range of , required to explain both the fluxes detected by Spitzer MIPS and 2MASS Ks and the upper limits on the optical lines.
In the considered case the presence of a fast shock of velocity 300 seems to be required to explain the X-ray data discussed above. Moreover, it is apparent from Figure 1 that while the 1.4 GHz radio emission is dim in the south-eastern part of the shocked molecular cloud in comparison with that at the north-east, there is a localized excess in the vicinity of molecular clump D adjacent to J0618. If the radio emission is the synchrotron emission produced by relativistic electrons in the GeV regime in a likely enhanced magnetic field of the dense clump D, then the model requires the presence of a fast shock of velocity well above 100 to accelerate the relativistic particles in the vicinity of Src 1.
The shock ram pressure estimations for multiple shock models were discussed by many authors (e.g. Burton et al. 1990; Richter, Graham, and Wright 1995; Cesarsky et al. 1999; Snell et al. 2005). A fast shock of velocity 50–100 incident on a clump of a moderate number density – would have a high ram pressure –. It seems to be uneasy to attribute the estimated range of ram pressures to a uniform SN blast wave colliding with a cloud. A SN blast-wave ram pressure, as estimated from the properties of shocked X-ray emitting gas inside the remnant, is smaller. On the other hand, strong ram-pressure inhomogeneities can be produced if a molecular cloud is hit by SN ejecta driving the blast wave. The ejecta are likely to be rather fragmented. Each can be considered as an ensemble of ejecta fragments with a range of velocities and densities produced by early ejecta instabilities. The fragments could provide a wide range of ram pressures in the molecular cloud (up to 10) driving shocks of different velocities, which are required to explain the observational data. Isolated fast moving dense ejecta fragments could penetrate deeper into the dense parts of the cloud driving the high-pressure shocks on relatively small scales.
4.6. Time variability and ejecta fragments statistics
The lifetime of an isolated ejecta fragment in a dense medium is an important factor with regard to time variability of the X-ray emission. A fast moving knot is decelerating due to the interaction with the ambient gas. The drag deceleration time of a fragment of velocity , mass and radius can be estimated as years. Here and . The number density of the ambient matter is in units of 103, and the fragment velocity in units of 10. Hydrodynamical crushing of a fast knot occurs on a timescale (e.g. Chevalier 1975; Sutherland & Dopita 1995; Wang & Chevalier 2001, and references therein). The density contrast ( is the knot density) is of the order of 1 for a large enough fragment, and for large enough clumps. To reach its apparent position in the molecular cloud of IC 443, an isolated ejecta fragment must be massive enough, , to overcome strong drag deceleration in the dense matter, as discussed below.
Particle acceleration occurs on a few-years timescale if the fast particle diffusion coefficient does not exceed 10 (see Bykov 2002 for a discussion). Thus, given the fragment lifetime estimated above, some time variability of the X-ray emission, both in hard continuum and lines, can be expected on a few-years timescale (and longer) for a fragment of velocity in a dense ambient matter with , typical for molecular clumps. Variable X-ray emission has been recently observed with Chandra in a few molecular clouds in the Galactic Center region by Muno et al. (2007). Using the above estimates, one can argue that variable X-ray emission could be produced due to an interaction of metal-rich supernova ejecta with dense clumps of molecular clouds.
According to the – distribution of X-ray emitting knots simulated by the method of Bykov (2003), the probability of another similarly bright ejecta fragment getting into the field is rather low because of the short lifetime of the fragment in a dense molecular clump. However, some smaller and less massive fragments propagating in the interclump medium could be seen in the cloud as weak point-like X-ray sources of luminosities . In order to firmly identify the sources as such fragments, a deeper observation is required.
The hydrodynamic simulations available (Klein, McKee, & Colella 1994; Wang & Chevalier 2001) predict a complex irregular structure of the fragment body due to hydrodynamic instabilities. In this case the X-ray image would show an irregular patchy structure, instead of a smooth regular head-tail structure. The patches are due to emission of dense pieces of the fragmented knot illuminated by the shock-accelerated energetic particles. The observed morphology of X-ray emission with bright clumps of a few arcsec size in Src 1, such as Src 1a and Src 1b, as well as Src 3, can be explained in that model. It is worth to note that ballistically moving ejecta fragments could have rather large non-radial velocities (with respect to the apparent center of SN explosion). The non-radial velocity components will be substantial if the fragments originate from ejecta instabilities at relatively late evolution stages.
Thus, one can conclude that the morphology, spectra, and X-ray luminosity of the J0618 complex are generally consistent with those expected for a ballistically moving SN ejecta fragment interacting with a molecular cloud, though it is worth to discuss also some alternatives.
4.7. Alternative interpretations of J0618
A possible interpretation of the extended hard X-ray source J0618 associating it with an interaction of the ejecta of SNR IC 443 with the nearby molecular cloud has been discussed above in some detail. Another SNR-related possible interpretation is a low luminosity pulsar wind nebula originating either from IC 443 or from another SNR G189.6+3.3, advanced by BBP05.
Extragalactic sources could also contribute to the observed appearance of J0618. Spectra the of point-like sources Src 2 and Src 3 could be interpreted as that of AGNs. Within such an interpretation the feature at about 3.7 keV in the spectrum of Src 3 could correspond to a redshifted (with 0.6 1) Fe emission line. Moreover, one could speculate on the association of the extended Src 1 with a high- cluster of galaxies. The angular size of Src 1 ( 1′ at photon energies 2 keV) would suggest in that case a redshift 0.5 (see e.g. Rosati 2004 for a review of high- clusters). The thermal fit of the diffuse Src 1* presented in Table 3 with the temperature about 5 keV is consistent with the cluster interpretation.
Optical and IR identifications of galaxies (of a few arcsecond scale size at 1) in the hypothetical cluster are the most obvious test to check the interpretation and measure the redshift of the putative cluster. With the optical data available and given the substantial absorption (3 6), it is possible to identify the objects not fainter than mV = 17–19, while the brightest galaxies in most of the known X-ray clusters at 1 are of m 19–20. Thus a dedicated optical-IR study is needed to confirm or reject the high- galaxy cluster interpretation. The observed extension of the 2MASS Ks source correlated with observed diffuse X-ray emission is not easy to understand in the cluster of galaxies interpretation; it rather supports a Galactic SNR-related origin of J0618.
5. Conclusions
The multi-wavelength observations presented here indicate a possible physical connection of the X-ray source J0618 with the neighboring IR Spitzer and 2MASS sources. That connection, if real, can be understood in a scenario where J0618 originates in an interaction of the IC 443 SNR with the adjacent molecular cloud. The correlation would require the presence of both fast and slow shocks in the clumpy molecular-cloud material. The X-ray line features apparent in the spectra of the clumps favor a scenario in which the shocks are produced by a fast ballistically moving SN ejecta fragment penetrating into a structured molecular cloud. The model provides a physical picture coherent with the current observational data, although alternative scenario cannot be rejected yet.
Alternatively, Src 1 can be interpreted as a massive X-ray cluster of galaxies at a redshift 0.5. High-resolution arcsecond-scale observations and fine spectroscopy are required to distinguish between these very different scenarios.
If the SNR-ejecta interpretation is confirmed by further observations, the source J0618 in the IC 443 could be a prototype of a rather numerous population of hard X-ray – IR sources created by SN explosions in the dense environments of star-forming regions. Such sources would be particularly abundant in the Galactic Centre region.
References
- (1)
- (2) Akhiezer, A.I., & Berestetsky, V.B. 1957, Quantum Electrodynamics, transl. by Consultants Bureau Inc. (Oak Ridge: Tech. Information Service Ext.)
- (3)
- (4) Albert, J., et al., 2007, ApJ, 664, L87
- (5)
- (6) Arce, H.G., Goodman, A.A., 1999, ApJ, 512, L135
- (7)
- (8) Asaoka, I., & Aschenbach, B. 1994, A&A, 284, 573
- (9)
- (10) Aschenbach, B., Egger, R. & Trümper, J. 1995, Nature, 373, 585
- (11)
- (12) Blair, W.P., et al. 2000, ApJ, 537, 667
- (13)
- (14) Blitz, L. 1993, in Protostars and Planets III, ed. E.H. Levy & J.I. Lunine, (Tucson: Univ. of Arizona), 125
- (15)
- (16) Bocchino, F., & Bykov, A.M. 2000, A&A, 362, L29
- (17)
- (18) Bocchino, F., & Bykov, A.M. 2001, A&A, 376, 248
- (19)
- (20) Bocchino, F., & Bykov, A.M. 2003, A&A, 400, 203 (BB03)
- (21)
- (22) Borkowski, K.J. & Shull, J.M. 1990, ApJ, 348, 169
- (23)
- (24) Braun, R., Strom, R.J. 1986, A&A, 164, 193
- (25)
- (26) Bykov, A.M. 2002, A&A, 390, 327
- (27)
- (28) Bykov, A.M. 2003, A&A, 410, L5
- (29)
- (30) Bykov, A.M., Chevalier, R.A., Ellison, D.C. & Uvarov, Yu.A., 2000, ApJ, 538, 203
- (31)
- (32) Bykov, A.M., Bocchino, F., & Pavlov, G.G. 2005, ApJ, 624, L41 (BBP05)
- (33)
- (34) Burton, M.G. 1987, Quarterly Journal of the RAS, 28, 269
- (35)
- (36) Burton, M. G., Geballe, T. R., Brand, P. W. J. L., & Webster, A. S. 1988, MNRAS, 231, 617
- (37)
- (38) Burton, M.G., Hollenbach, D.J., Haas, M.R., & Erickson, E.F. 1990, ApJ, 355, 197
- (39)
- (40) Cesarsky, D., Cox, P., Pineau des Forets, G., van Dishoeck, E.F., Boulanger, F., & Wright, C.M. 1999, A&A, 348, 945
- (41)
- (42) Chevalier, R.A. 1975, ApJ, 200, 698
- (43)
- (44) Chevalier, R.A. 1999, ApJ, 511, 798
- (45)
- (46) Claussen, M.J., Frail, D.A., Goss, W.M., & Gaume, R.A. 1997, ApJ, 489, 143
- (47)
- (48) Cornett, R. H., Chin, G., & Knapp, G. R. 1977, A&A, 54, 889
- (49)
- (50) DeNoyer, L.K. 1979, ApJ, 232, L165
- (51)
- (52) Dickman, R. L., Snell, R. L., Ziurys, L. M., & Huang, Y.-L. 1992, ApJ, 400, 203
- (53)
- (54) Draine, B.T. 1980, ApJ, 241, 1021
- (55)
- (56) Esposito, J. A., Hunter, S. D., Kanbach, G., & Sreekumar, P. 1996, ApJ, 461, 820
- (57)
- (58) Fesen, R.A., & Kirshner, R.P. 1980, ApJ, 242, 1023
- (59)
- (60) Johnson, R.P. 2006, AIP Conf. Proc., 842, 1010
- (61)
- (62) Gaensler, B.M., Chatterjee, S., Slane, P.O., van der Swaluw, E., Camilo, F., & Hughes, J.P. 2006, ApJ, 648, 1037
- (63)
- (64) Green, D.A. 1986, MNRAS, 221, 473
- (65)
- (66) Hartigan, P., Raymond, J., & Hartmann, L. 1987, ApJ, 316, 323
- (67)
- (68) Hewitt, J.W., Yusef-Zadeh, F., Wardle, M., Roberts, D.A.,& Kassim, N.E., 2006, ApJ, 652, 1288
- (69)
- (70) Hollenbach, D., & McKee, C.F. 1989, ApJ, 342, 306
- (71)
- (72) Hollenbach, D.J., & Tielens, A.G.G.M. 1999, Rev. Mod. Phys., 71, 173
- (73)
- (74) Kaastra, J.S. 1992, An X-Ray Spectral Code for Optically Thin Plasmas, (Internal SRON-Leiden Report, updated version 2.0)
- (75)
- (76) Kawasaki, M.T., Ozaki, M., Nagase, F., Masai, K., Ishida, M., & Petre, R. 2002, ApJ, 572, 897
- (77)
- (78) Keohane, J.W., Petre, R., Gotthelf, E.V., Ozaki, M., & Koyama, K. 1997, ApJ, 484, 350
- (79)
- (80) Klein, R.I., McKee, C.F., & Colella, P. 1994, ApJ, 420, 213
- (81)
- (82) Lagage, P.-O., Pantin, E., Durand, G., Smette, A., Doucet, C., Belorgey, J., & Pel, J.-W. 2006, Proc. SPIE, 6269, 626913
- (83)
- (84) Leahy, D.A. 2004, AJ, 127, 2277
- (85)
- (86) Makovoz, D., Roby, T., Khan, I. & Booth, H., 2006, Proc. SPIE, 6274, 10
- (87)
- (88) Mewe, R., Gronenschild, E.H.B.M., & van den Oord, G.H.J. 1985, A&AS, 62, 197
- (89)
- (90) Miyata, E., Tsunemi, H., Aschenbach, B. & Mori, K. 2001, ApJ, 559, L45
- (91)
- (92) Morrison, R., McCammon, D., 1983, ApJ, 270, 119
- (93)
- (94) Mufson, S.L., McCollough, M.L., Dickel, J.R., Petre, R., White,R., & Chevalier, R. 1986, AJ, 92, 1349
- (95)
- (96) Muno, M., Baganoff, F.K., Brandt, W.N., Park, S., & Morris, M.R. 2007, ApJ 656, L69
- (97)
- (98) Olbert, C.M., Clearfield, C.R., Williams, N.E., Keohane, J.W., & Frail, D.A. 2001, ApJ, 554, L205
- (99)
- (100) Petre, R., Szymkowiak, A.E., Seward, F.D., & Willingale, R. 1988, ApJ, 335, 215
- (101)
- (102) Preite-Martinez A., Feroci, M., Strom, R.G., & Mineo, T. 2000, AIP Conf. Proc., 510, 73
- (103)
- (104) Reich, W., Reich, P. & Fürst, E. 1990, A&AS, 83, 539
- (105)
- (106) Reid, I.N. et al. 1991, PASP, 103, 661
- (107)
- (108) Rho, J., Jarrett, T.H., Cutri, R.M., & Reach, W.T. 2001, ApJ, 547, 885.
- (109)
- (110) Richter, M.J., Graham, J.R., & Wright, G.S. 1995, ApJ, 454, 277
- (111)
- (112) Rieke, G.H., et al. 2004, ApJS, 154, 25
- (113)
- (114) Rosati, P. 2004, in Clusters of Galaxies, ed. J.S. Mulchaey& A.Dressler, A.Oemler, (Cambridge University Press), 72
- (115)
- (116) Schlegel, D.J., Finkbeiner, D.P., Davis, M., 1998, ApJ, 500, 525
- (117)
- (118) Skrutskie, M.F. et al., 2006, AJ, 131, 1163
- (119)
- (120) Snell, R.L., Hollenbach, D., Howe, J.E., Neufield, D.A., Kaufman, M.J., Melnick, G.J., Bergin, E.A. & Wang, Z. 2005, ApJ, 620, 758
- (121)
- (122) Spitzer, L. 1978, Physical processes in the interstellar medium, New York Wiley-Interscience
- (123)
- (124) Stetson, P.B. 1987, PASP, 99, 191
- (125)
- (126) Sturner, S., Keohane, J., & Reimer, O. 2004, Adv. Sp. Res., 33, 429
- (127)
- (128) Sutherland, R.S. & Dopita, M.A. 1995, ApJ, 439, 381
- (129)
- (130) Tauber, J. A., Snell, R. L., Dickman, R. L., & Ziurys, L. M. 1994, ApJ, 421, 570
- (131)
- (132) Troja, E., Bocchino, F., & Reale, F. 2006, ApJ, 649, 258
- (133)
- (134) Turner, B. E., Chan, K.-W., Green, S., & Lubowich, D. A. 1992, ApJ, 399, 114
- (135)
- (136) van Dishoeck, E.F., Jansen, D.J., & Phillips, T.G. 1993, A&A 279, 541
- (137)
- (138) Wang, C.-Y. & Chevalier, R.A. 2001, ApJ, 549, 1119
- (139)
- (140) Wang, Z.R., Asaoka, I., Hayakawa, S., & Koyama, K. 1992, PASJ, 44, 303
- (141)
- (142) Weisskopf, M.C., Karovska, M., Pavlov, G. G., Zavlin, V. E., Clarke, T. 2007, Ap&SS, 308, 151
- (143)
- (144) Werner, M.W., et al. 2004, ApJS, 154, 1
- (145)
- (146) Winkler, P.F. & Long, K.S. 2006, AJ, 132, 360