11email: jrssutil@hotmail.com 22institutetext: Departamento de Física, EPS, Universidad de Jaén, Campus Las Lagunillas s/n, Edif. A3, 23071 Jaén, Spain
22email: jmarti@ujaen.es, jcombi@ujaen.es, ajmunoz@ujaen.es 33institutetext: Dpto. de Ing. Mecánica y Minera, EPS, Universidad de Jaén, Campus Las Lagunillas s/n, Edif. A3, 23071 Jaén, Spain
33email: peter@ujaen.es 44institutetext: Departament d’Astronomia i Meteorologia, Universitat de Barcelona, Martí i Franquès, 1, 08028 Barcelona, Spain
44email: jmparedes@ub.edu 55institutetext: Astrophysics, Cavendish Laboratory, J. J. Thomson Avenue, Cambridge CB3 0HE, UK
55email: guy@mrao.cam.ac.uk
Faint arc-minute extended radio emission around Cygnus X-3
Abstract
Aims. We revisit the vicinity of the microquasar Cygnus X-3 at radio wavelengths. We aim to improve our previous search for possible associated extended radio features/hot spots in the position angle of the Cygnus X-3 relativistic jets focusing on shorter angular scales than previously explored.
Methods. Our work is mostly based on analyzing modern survey and archive radio data, mainly including observations carried out with the Very Large Array and the Ryle Telescopes. We also used deep near-infrared images that we obtained in 2005.
Results. We present new radio maps of the Cygnus X-3 field computed after combining multi-configuration Very Large Array archive data at 6 cm and different observing runs at 2 cm with the Ryle Telescope. These are probably among the deepest radio images of Cygnus X-3 reported to date at cm wavelengths. Both interferometers reveal an extended radio feature within a few arc-minutes of the microquasar position, thus making our detection more credible. Moreover, this extended emission is possibly non-thermal, although this point still needs confirmation. Its physical connection with the microquasar is tentatively considered under different physical scenarios. We also report on the serendipitous discovery of a likely Fanaroff-Riley type II radio galaxy only away from Cygnus X-3.
Key Words.:
stars: individual: Cygnus X-3 - Radio continuum: stars - X-rays:binaries1 Introduction
Cygnus X-3 is one of the X-ray binaries considered as the prototype of the family of galactic sources with relativistic jets, i.e., microquasars. It was originally discovered in X-rays by Giacconi et al. (1967). This system made headlines more than three decades ago when its first strong radio outbursts were detected, as described in Gregory et al. (1972) and subsequent papers. Such flaring events have been repeating since then, typically one or two times per year, with flux density increments of almost two orders of magnitude above the normal quiescent level of Jy at cm wavelengths (Waltman et al. (1994)). At present, Cygnus X-3 is considered to be a high-mass X-ray binary (HMXB) with a WN Wolf-Rayet (WR) companion star of WN8 type (see e.g. van Kerkwijk et al. (1996) and Koch-Miramond et al. (2002)). The nature of the compact object is not well constrained, and neither a neutron star nor a black hole accreting from the WR star can be ruled out (see e.g. Ergma and Yungelson (1998) and Mitra (1998)). The observed X-ray (Parsignault et al. (1972)) and infrared (Becklin et al. (1973)) modulation of 4.8 h is believed to be connected with the system orbital period, which is rather short for an HMXB. Orbital-phase-resolved spectra of Cygnus X-3 in the near infrared are consistent with it (Hanson et al. (2000)). The distance has been estimated to be approximately 9 kpc (Predehl et al. (2000)), which agrees with a strong interstellar absorption ( mag, van Kerkwijk et al. (1996)) that renders the optical counterpart undetectable in the visual domain.
| Date | wavelength | VLA | Number of | Bandwidth | Number of | Project | Time on |
|---|---|---|---|---|---|---|---|
| (cm) | configuration. | IFs | (MHz) | visibilities | id. | source (hrs) | |
| 1992 Jun 8 | 6 | DnC | 2 | 50 | 432229 | UT002 | 5 |
| 1997 May 4 | 6 | B | 2 | 50 | 718939 | AM551 | 5.7 |
| 2000 Aug 29 | 6 | D | 2 | 50 | 29167 | AH669 | 0.33 |
Galactic microquasars such as Cygnus X-3 are known to release a significant amount of energy in the form of collimated relativistic jets into their surrounding inter-stellar medium (ISM). For Cygnus X-3, the averaged energy injection rate of its relativistic jets is estimated to be at least erg s-1 (Martí et al. (2005)), i.e., enough to supply erg (10% of a supernova explosion) during the expected lifetime of the WR star. The Cygnus X-3 jets have been repeatedly resolved as sub-parsec transient radio features, propagating at a significant fraction of the speed of light in the north-south direction, thanks to interferometric radio techniques from arc-second (Martí et al. (2001)) to milli arc-second angular scales (e.g. Geldzahler et al. (1983); Miller-Jones et al. (2004); Tudose et al. 2007a ). However, up to now there is no robust evidence of interaction between the relativistic ejecta of the system and the surrounding ISM on larger, few pc scales. This is in contrast with other microquasars, such as Cygnus X-1 or Circinus X-1, where a clear signature of interaction between their relativistic jets and the ISM does exist with a ring-like or lobe morphology several pc wide (Gallo et al. (2005); Tudose et al. 2007b ). Additional examples of relativistic jet/ISM interaction come from the also pc-scale lobes of the Galactic Centre Annihilator 1E1740.72942 (Mirabel et al. (1992)) or GRS 1758258 (Martí et al. (2002)). The detection of such ring/lobe features is a useful tool to better constrain the system’s energetics.
The search for large scales features associated with the Cygnus X-3 radio jets has been a concern of the authors during recent years. Two HII regions located from Cygnus X-3 along the jet position angle were first tentatively proposed as possible large scale lobes (Martí et al. (2000)). However, no further evidence for a physical connection could be found beyond the mere geometric alignment. A closer search revealed later the existence of two possible hot spot candidates (HSCs) associated with Cygnus X-3, thus suggesting an analogy with Fanaroff-Riley type II (FR II) radio galaxies (Martí et al. (2005)). The apparent hot spots were two faint radio sources with non-thermal spectra at angular distances of 707 and 436 from Cygnus X-3. The line joining them was also within one degre of the almost North-South position angle of the inner arc-second radio jets (Martí et al. (2001)). Unfortunately, follow up radio and near infrared observations of both the HSCs and the Cygnus X-3 nearby environment did not confirm the proposed hot spot nature and indicated that they were most likely background or foreground objects (Martí et al. (2006)). This fact left open again for Cygnus X-3 the issue of searching for signatures of energy deposition from its relativistic jets into the ISM.
In this context, the main purpose of this paper is to present new very deep radio images of Cygnus X-3 and its environment obtained after combining multi-epoch archive and survey data, together with our own observations. The resulting maps enable us to put very strong limits for any extended or compact radio features that could be associated to Cygnus X-3 on a scale of a few pc. We also report on several extended radio features in the field with apparent non-thermal spectra that were previously unknown. Their possible connection with the microquasar is discussed from a skeptical point of view.
2 Deep VLA radio map of the Cygnus X-3 vicinity
2.1 Archive VLA 6 cm data analyzed in this paper
Most observations used in this paper come from archive data obtained with the Very Large Array (VLA) operated by the National Radio Astronomy Observatory (NRAO) in the USA. By similarity with the Cygnus X-1 or Circinus X-1 cases, the possible large scales radio features around Cygnus X-3 (if any) are likely to be a few pc extended and, therefore, with few arc-minute angular sizes. The more compact D configuration of the VLA appears thus as the best choice for our detection purposes at these angular scales. Concerning wavelength, we decided to use 6 cm data which provides a Full-Width Half Maximum (FWHM) primary beam of about . Then, a 1 to 10 pc feature would be well covered within the more sensitive, inner part of the primary beam.
Surprisingly, the NRAO data archive contains no VLA observations for Cygnus X-3 in the pure D configuration of the array and with more than a half hour of integration time. The archive data more closely matching our requirements comes from the hybrid DnC configuration. We also included one B configuration run for enhanced angular resolution in addition to sensitivity on arc-minute scales. The log of the observing runs that we have combined into a single radio image is given in Table 1.

The data were processed using the AIPS software package of NRAO following the standard procedures for continuum calibration of interferometers. Moreover, the u-v data were self-calibrated in phase. Due to the significant flaring variability of the Cygnus X-3 core during the observations the standard CLEANing methods could not be applied directly. Instead, we proceeded following a method similar to that outlined in Martí et al. (2000). Therefore, we had to subtract a time-variable point source from the visibilities in the u-v plane using different AIPS tasks. First of all, we split the data in blocks of less than 5% amplitude variation. For each block, we derived the flux density of the component to be subtracted at the microquasar core position with task UVFIT. Afterwards, we removed it using UVSUB and all almost variability free blocks were finally recombined using DBCON.
The next step was to combine the data of the three projects we are handling. At this point, the UVFIX task of AIPS had to be used to set a common phase center to allow the appropriate combination of the visibilities. Finally, the DBCON task was used again to merge all data sets in Table 1 into a single file. This was performed with an appropriate weighting to enhance the short baselines of DnC+D configuration that give sensitivity to extended emission. A constant point source, with the average flux density of Cygnus X-3, was finally added at the position of the subtracted core.
2.2 Extended emission
We first mapped our multi-configuration data without using the long baseline visibilites provided by the B configuration of the array. Fig. 1 shows a contour plot of the field obtained using the IMAGR task of AIPS with the ROBUST parameter set to five and DnC+D data only. The primary beam correction has been applied to the radio map restricted to its 50% contour. Such a conservative choice was adopted to avoid any problem towards the otherwise noisy edges of the map. Remarkably, Fig. 1 shows that Cygnus X-3 is located just at the edge of an extended radio feature clearly visible towards the South and South-West direction. Despite some deep negative artifacts, likely due to missing short baselines and perhaps to the subtraction procedure as well, the reality of the extended emission is beyond doubt thanks to confirmation by independent radio instruments (see below). In addition, two clumps of extended emission are also present to the North and East from the microquasar, respectively, but well separated by several arc-minutes.
Despite the morphological suggestion from Fig. 1, it is not possible to conclude whether or not the extended emission is physically associated to Cygnus X-3. While unrelated extended emission from the Galactic Plane cannot be ruled out, we could also be seeing traces of a disturbed lobe with an emission plume extending sideways for as long as 5 pc at the Cygnus X-3 distance. Similar scaled-up effects are very often seen in the large scale lobes and plumes of radio galaxies, where the interaction of the jet pointing towards the observer with the intergalactic medium induces turns in the flow direction changing it by as much as . A representative example of this phenomenon is found, for instance, in the large lobes of 3C 264 (Lara et al. (2004)) where the most remarkable feature is the transition between a well collimated narrow jet at distances from the core below 80 pc, to a conical-shaped wide jet, with a large opening angle. The possibility than an analog physical process could take place in Cygnus X-3 is a scenario worth exploring based on this evidence. Moreover, as in 3C 264, we also find in our map a more distant patch of extended emission right at the expected position angle of the counterjet.
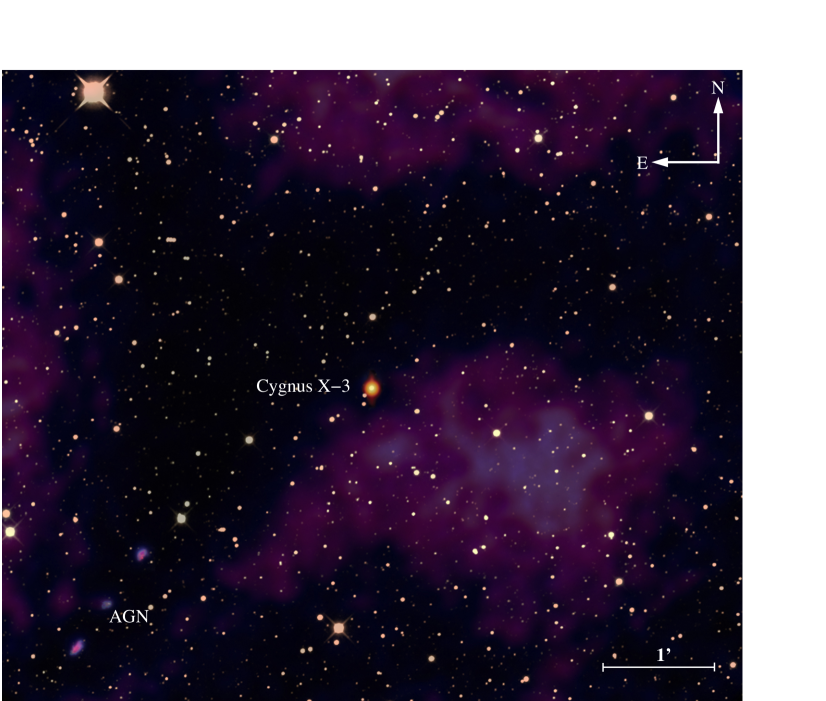
The resulting map obtained after combining the full DnC+D+B configuration data at 6 cm is presented in Fig. 2. It is part of a composite image containing both radio (this work) and near infrared data (Martí et al. (2006)). This montage is included to render a global and enhanced view of the different source components present in the complex Cygnus X-3 field (e.g. extended emission, compact cores, galactic and extragalactic jets, etc.) which otherwise would be difficult to visualize simultaneously. As quoted above, the Cygnus X-3 variable radio core was removed to avoid variability artifacts during the CLEANing process. A compact point source, with the average flux density level, was later added later at its location for illustration purposes. At this point, The synthesized beam was practically a circular Gaussian with 15 angular size and the map rms noise 9.5 Jy beam-1. Correction for primary beam response was also applied to the radio data up to a conservative response value of 50% for appropriate physical measurements. As a final cosmetic step, the extended radio emission next to Cygnus X-3 and whose nature is still unclear has been slightly smoothed for better display.
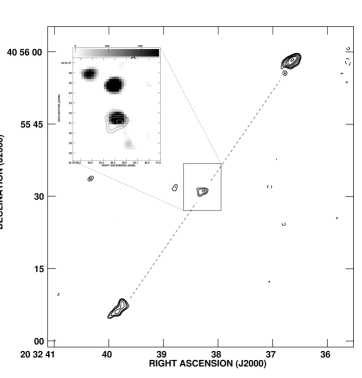
2.3 A triple radio source in the Cygnus X-3 field
The radio map in Fig. 2 is also deep enough to reveal a a triple radio source with a compact core and two aligned lobe/hot spots components previously unknown. The location of the proposed core is at coordinates 3829002 and 31002, with a 6 cm flux density of mJy. Its angular distance from Cygnus X-3 is 306. The overall morphology of this triple source consistent with a FR II radio galaxy, as shown in Fig. 3. The grey scale in Fig. 3 comes from previous near infrared -band observations (Martí et al. (2006)), where a point-like counterpart with magnitude is coincident with the compact core within astrometric error. Microquasars and AGNs are often considered as close relatives with the same accretion/ejection processes going on (Mirabel & Rodríguez (1999)). To our knowledge, the Fig. 2 map is the first case where representatives of both families can be simultaneously imaged and resolved within the same primary beam thus giving it a strong educational value. This fact also opens a possibility for proper motion studies of Cygnus X-3 using future very sensitive interferometers with respect to the FR II core.
3 An independent detection of extended emission in the Cygnus X-3 vicinity

The Ryle Telescope (Cambridge) has for some years been used in a ‘spare-time’ mode for monitoring of X-ray binaries; for details, see Pooley & Fender (1997). In recent years it has operated at 15 GHz (). Cygnus X-3 is unique in that it can show periods of very low (‘quenched’) flux density for some days immediately before major radio/X-ray flares (Waltman et al. (1994)). This fact is potentially useful in giving warning of the flares. Observations during this phase had demonstrated that there is some emission on larger angular scales which had so far been ignored or treated as a complication in the analysis. Essentially this emission is readily detected only on the shortest baseline of the telescope (about ), for only about two hours of the hour angle range. The apparent flux density at 15 GHz of this extended structure is about 35 mJy. The report of the VLA maps shown in this paper prompted a reanalysis of some recent data: we used 8 observations during the period 2006 Jan 20 – 29 (excluding Jan 26, when Cygnus X-3 reached 50 mJy). The mean flux density of this HMXB for the remaining days was about 3 mJy. The data, covering time-spans from about 1 h up to 12 h, were mapped and the resulting data cleaned. The synthesised resolution is . No attempt was made at any self-calibration or allowance for the variable nature of the core source. Neither has the map been corrected for the primary beam of the telescope.
The resulting image is shown in Fig. 4. This must be interpreted with some caution, since (a) the Fourier plane is clearly not well-sampled; (b) the structure extends over most of the primary beam of the telescope ( FWHM).
Despite the frequency difference, the agreement of the overall structure mapped by two independent interferometers in Figs. 1 and 4 gives robustness to the detection of arc-minute extended emission close to Cygnus X-3. The shape of the 2 cm emission is here more suggestive of a physical North-South elongated connection with Cygnus X-3 than at 6 cm. Moreover, the extended emission also appears reminiscent of an arc-like morphology opening towards the South and with the microquasar in the middle. Could we be seeing part of a ring-like structure similar to that detected around Cygnus X-1 by Gallo et al. (2005)? Having in mind all image limitations quoted above, it is currently difficult to discriminate among a lobe, ring or a simple unrelated emission scenario until better observations are available.
4 Spectral index map of the extended emission
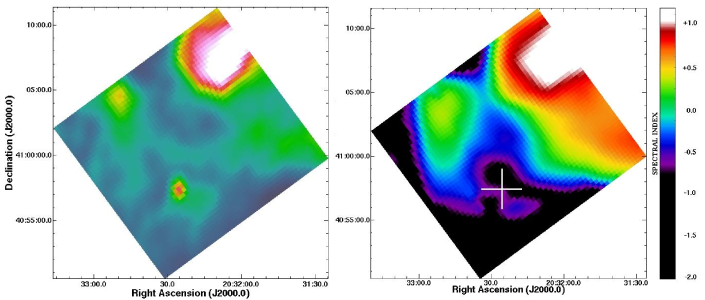
We also inspected the Canadian Galactic Plane Survey (CGPS, Taylor et al. (2003)) at 1.4 GHz and the Green Bank 4.85 GHz northern sky survey (GB6, Condon et al. 1991, 1993, 1994). Some traces of the extended feature quoted in previous sections are also visible around Cygnus X-3 in both surveys. Therefore, this adds even more confidence to its reality. In the left panel of Fig. 5 we display the CGPS image. These traces of extended emission are better seen here than in the GB6 single dish survey with lower angular resolution.
The presence of this extended emission around Cygnus X-3 in both surveys encouraged us to attempt a crude estimate of its spectral index. Our VLA (6 cm) and Ryle Telescope (2 cm) images are likely missing some flux density from very short baselines and we preferred not to use them for such purpose. Since we were only interested in extended emission, the central core of Cygnus X-3 was initially subtracted from both the CGPS and GB6 images. The CGPS image was later appropriately convolved with an elliptical Gaussian so that its one arc-minute angular resolution matched the lower one of the GB6 (about 3 arc-minute). In the process, we also transformed its brightness scale from brightness temperature to Jy beam-1. The CGPS image was also regrided from galactic to equatorial coordinates.
Once the CGPS and GB6 images were correctly matched, we combined them in order to create a map of spectral index (). The result is reported in the right panel of Fig. 5. Here, the spectral index of the extended radio feature under discussion hints at a negative value and suggesting a non-thermal emission mechanism. This would be in natural agreement with relativistic electrons accelerated in the termination shock of a distorted jet. In contrast, other bright extended radio sources in the field have values predominantly positive as expected from ordinary star forming regions with thermal emission mechanisms. In any case, true matching beam observations at different wavelengths are still needed to confidently constrain the spectral index value.
5 Constraining the system energetics
The possible Cygnus X-3 lobe or extended radio feature of other kind has an integrated flux density of about 133 mJy at the 6 cm wavelength and extends over a solid angle of about sr. These values have been measured using the full multi-configuration radio map in Fig. 2. For , this implies a radio luminosity of erg s-1 in the 0.1-100 GHz at 9 kpc. Assuming standard equipartition conditions, the minimum energy content is estimated as erg with the equipartition magnetic field being G.
The radio lobe dynamics in a microquasar environment using a simple analytic model has been studied by Heinz (2002). The typical size , when the lobe reaches pressure equilibrium with the ISM, is given by:
| (1) |
where represents the accumulated energy from multiple ejection events in units of erg and the external ISM pressure in units of erg cm-3. This equilibrium size is reached in a time scale of order:
| (2) |
being the corresponding external ISM number density in units of cm-3.
Assuming typical properties for intercloud gas in the Galaxy, such as cm-3 and a K temperature, a conceivable ISM pressure is obtained. From the equipartition estimates above, we can adopt for the total lobe energy content. Incidently, erg is roughly the total energy involved in a single major radio outburst of Cygnus X-3 (Martí et al. (1992)). Based on Eqs. 1 and 2, the expected lobe size is pc and the lobe equilibrium time yr. The resulting lobe dimension is within a factor of two from the estimated pc size, if our extended radio source is at the same distance as Cygnus X-3. The estimated lobe age would also be consistently shorter or comparable with the expected life time of the WR star ( yr) acting as mass donor and powering the outbursts of the system.
6 Conclusions
-
1.
We revisited the issue of large scale radio features associated to the microquasar Cygnus X-3. By combining different archive VLA observations, we have been able to create a very deep (rms noise 9.5 Jy beam-1) radio map with sensitivity to arc-minute angular scales. Cygnus X-3 appears superposed onto a diffuse radio emission with apparent non-thermal index with an angular size of a few arc-minutes extending South and South-West from it. The reality of such feature is independently confirmed by Ryle Telescope observations and when inspecting in detail maps from the CGPS and other survey data.
-
2.
With all cautions in mind, we tentatively suggest the possibility that such an extended emission could be physically associated to Cygnus X-3. It could be either a distorted lobe, plume or partial shell-like structure resulting from the accumulated flaring history of the microquasar interacting with the ISM. If connected with Cygnus X-3, the feature linear size would be pc. This is of the same order as extended lobes or bubbles seen around other microquasars. Based on simple equipartition assumptions, the observed size is roughly in agreement with expectations from simple theory of radio lobe dynamics.
-
3.
A triple radio source with FR II morphology has been also discovered at few arc-minute from Cygnus X-3 in our deep VLA map. In addition to provide a curious ‘family picture’ of two accreting sources in the same shot, the angular proximity of the FR II compact core could enable future proper motion studies of this microquasar using future generations of highly sensitive interferometers.
Acknowledgements.
The authors acknowledge support by grants AYA2004-07171-C02-02 and AYA2004-07171-C02-01 from the Spanish government, and FEDER funds. This has been also supported by Plan Andaluz de Investigación of Junta de Andalucía as research group FQM322. The NRAO is a facility of the NSF operated under cooperative agreement by Associated Universities, Inc. The Ryle Telescope is supported by the UK Science and Technology Facilities Council. This paper is also based on observations collected at the Centro Astronómico Hispano Alemán (CAHA) at Calar Alto, operated jointly by the Max-Planck Institut für Astronomie and the Instituto de Astrofísica de Andalucía (CSIC). J.A.C. is a researcher of the programme Ramón y Cajal funded jointly by the Spanish Ministerio de Educación y Ciencia (former Ministerio de Ciencia y Tecnología) and Universidad de Jaén. This research made use of the SIMBAD database, operated at the CDS, Strasbourg, France. This research used the facilities of the Canadian Astronomy Data Centre operated by the National Research Council of Canada with the support of the Canadian Space Agency. The research presented in this paper has used data from the Canadian Galactic Plane Survey a Canadian project with international partners supported by the Natural Sciences and Engineering Research Council.References
- Becklin et al. (1973) Becklin, E. E., Neugebauer, O., Hawkings, F., et al., 1973, Nat, 245, 302
- Condon et al. (1991) Condon, J. J., et al., 1991, AJ, 102, 2041
- Condon et al. (1993) Condon, J. J., et al., 1993, AJ, 106, 1095
- Condon et al. (1994) Condon, J. J., et al., 1994, AJ, 107, 1829
- Ergma and Yungelson (1998) Ergma, Ene., and Yungelson, L.R., 1998, A&A, 333, 151
- Gallo et al. (2005) Gallo, E., Fender, R. P., Kaiser, Ch., et al., 2005, Nat, 436, 819
- Geldzahler et al. (1983) Geldzahler, B. J., Johnston, K. J., Spencer, J. H., et al., 1983, A&A, 273, L65
- Giacconi et al. (1967) Giacconi, R., Gorenstein, P., Gursky, H., Waters, J. R. 1967, ApJ, 148, L119
- Gregory et al. (1972) Gregory, P. C., Kronberg, P. P., Seaquist, E. R., et al., 1972, Nat Phys Sci, 239, 114
- Hanson et al. (2000) Hanson, M. M., Still, M. D., Fender, R. P., 2000, ApJ, 541, 308
- Heinz (2002) Heinz, S., 2002, A&A, 388, L40
- Koch-Miramond et al. (2002) Koch-Miramond, L., Ábrahám, P., Fuchs, Y., Bonnet-Bidaud, J.M., Claret, A., 2002, A&A, 396, 877
- Lara et al. (2004) Lara, L., Giovannini, G., Cotton, W. D., Feretti, L., Venturi, T., 2004, A&A, 415, 905
- Martí et al. (1992) Martí, J., Paredes, J. M., Estalella, R., 1992, A&A, 258, 309
- Martí et al. (2000) Martí, J., Paredes, J. M., Peracaula, M., 2000, ApJ, 545, 939
- Martí et al. (2001) Martí, J., Paredes, J. M., Peracaula, M., 2001, A&A, 375, 476
- Martí et al. (2002) Martí, J., Rodríguez, L. F., Mirabel, I. F., Smith, I. A., 2002, 386, 571
- Martí et al. (2005) Martí, J., Pérez-Ramírez, D., Garrido, J. L., Luque-Escamilla, P., Paredes, J. M., 2005, A&A, 439, 279
- Martí et al. (2006) Martí, J., Pérez-Ramírez, D., Luque-Escamilla, P., Garrido, J. L., Paredes, J. M., Muñoz-Arjonilla, A.J., Sánchez-Sutil, J.R., 2006, A&A, 451, 1037
- Miller-Jones et al. (2004) Miller-Jones, J. C. A., Blundell, K. M., Rupen, M. P., et al., 2004, ApJ, 600, 368
- Mirabel & Rodríguez (1999) Mirabel, I. F., Rodríguez, L. F., 1999, ARA&A, 37, 409
- Mitra (1998) Mitra, A., 1998, ApJ, 499, 385
- Mirabel et al. (1992) Mirabel, I. F., Rodríguez, L.F., Cordier, B., et al., 1992, Nature, 358, 215
- Parsignault et al. (1972) Parsignault, D. R., Gursky, H., Kellogg, E. M., et al., 1972, Nat. Phys. Sci., 239, 123
- Predehl et al. (2000) Predehl, P., Burwitz, V., Paerels, F., Trümper, J. 2000, A&A, 357, L25
- Pooley & Fender (1997) Pooley, G. G., Fender, R. P., 1997, MNRAS 292, 925
- Taylor et al. (2003) Taylor, A. R., Gibson, S. J., Peracaula, M., et al., 2003, AJ, 125, 3145
- (28) Tudose, V., Fender, R.P., Garrett, R.P., Miller-Jones, J. C. A., et al., 2007a, MNRAS, 375, L11
- (29) Tudose, V., Fender, R. P., Kaiser, C. R., et al., 2007b, MNRAS, 372, 417
- van Kerkwijk et al. (1996) van Kerkwijk, M.H., Geballe, T.R., King, D.L., van der Klis, M., van Paradijs, J., 1996, A&A, 314, 521
- Waltman et al. (1994) Waltman, E. B., Fiedler, R. L., Johnston, K. L., Ghigo, F. D., 1994, AJ, 108, 179