The Detailed Evolution of E+A Galaxies into Early Types11affiliation: Based on observations with the NASA/ESA Hubble Space Telescope obtained at the Space Telescope Science Institute, which is operated by the Association of Universities for Research in Astronomy, Incorporated, under NASA contract NAS5-26555.
Abstract
Post-starburst, or E+A galaxies, are the best candidates for galaxies in transition from being gas-rich and star-forming to gas-poor and passively-evolving as a result of galaxy-galaxy interactions. To focus on what E+A galaxies become after their young stellar populations fade away, we present the detailed morphologies of 21 E+A galaxies using high resolution HST/ACS and WFPC2 images. Most of these galaxies lie in the field, well outside of rich clusters, and at least 11 (55%) have dramatic tidal features indicative of mergers. Our sample includes one binary E+A system, in which both E+As are tidally disturbed and interacting with each other. Our E+As are similar to early types in that they have large bulge-to-total light ratios (median = 0.59), high Sérsic indices, (), and high concentration indices (), but they have considerably larger asymmetry indices () than ellipticals, presumably due to the disturbances within a few caused by the starburst and/or the galaxy-galaxy interaction. We conclude that E+As will be morphologically classified as early-type galaxies once these disturbances and the low surface brightness tidal features fade. The color morphologies are diverse, including six E+As with compact (0.4 – 1.4 kpc) blue cores, which might be local analogs of high- ellipticals with blue-cores. The large fraction (70%) of E+As with positive color gradients indicates that the young stellar populations are more concentrated than the old. These positive color gradients (i.e., bluer nuclei) could evolve into the negative gradients typical in E/S0s if the central parts of these galaxies are metal enhanced. Our E+As stand apart from the E/S0s in the edge-on projection of the Fundamental Plane (FP), implying that their stellar populations differ from those of E/S0s and that E+As have, on average, a M/L that is 3.8 times smaller. The tilt of the E+A FP indicates that the variation among their stellar populations is closely tied to the structural parameters, i.e., E+As follow their own scaling relationships such that smaller or less massive galaxies have smaller M/L. We find a population of unresolved compact sources in nine E+As (45%), all of which have merger signatures. In the four E+As with suitable color data, the compact sources have colors and luminosities consistent with newly-formed star clusters. The bright end of the cluster LF is fainter in redder E+A’s, suggesting that the young star clusters fade or are disrupted as the merger remnant ages. In summary, the morphologies, color profiles, scaling relations, and cluster populations are all consistent with E+As evolving ultimately into early-types, making the study of E+As critical to understanding the origin of the red sequence of galaxies.
Subject headings:
galaxies: evolution — galaxies: interactions — galaxies: starburst — galaxies: star clusters — galaxies: stellar content1. Introduction
If some galaxies evolve from star-forming, gas-rich, disk-dominated galaxies (late-types) into quiescent, gas-poor, spheroid-dominated galaxies (early-types), we should find objects caught in the midst of this transformation. The best candidates are the so-called “E+A”, “K+A”, or ”post-starburst” galaxies (Dressler & Gunn, 1983; Couch & Sharples, 1987) due to their combination of late- and early-type characteristics, including both a significant young stellar population (age 1 Gyr) and a lack of on-going star formation. These galaxies have been spectroscopically identified by their strong Balmer absorption lines and absence of emission lines (e.g., [O II] and H) in various environments and at all redshifts (Zabludoff et al., 1996; Poggianti et al., 1999; Goto et al., 2003; Blake et al., 2004; Tran et al., 2003, 2004).
While the cause of the abrupt end of their star formation is poorly understood, there is strong evidence that galaxy-galaxy tidal interactions or mergers trigger the starburst in many cases. First, most E+A galaxies reside in low-density environments, such as poor groups, that are similar to those of star-forming galaxies (Zabludoff et al., 1996; Quintero et al., 2004; Blake et al., 2004; Balogh et al., 2005; Goto, 2005; Hogg et al., 2006; Yan et al., 2008). Therefore, many E+As must arise from a process common in the field, such as galaxy-galaxy interactions, instead of a mechanism limited to denser, hotter environments, such as ram pressure stripping (Gunn & Gott, 1972) or strangulation (Balogh et al., 2000). Second, a significant fraction of E+As have tidal features (Zabludoff et al., 1996; Yang et al., 2004; Blake et al., 2004; Tran et al., 2003, 2004; Goto, 2005). Third, optical and NIR colors show that the spectral signatures of E+As require enhanced recent star formation, rather than simply a truncation of star formation in a normal spiral galaxies (Balogh et al., 2005).
What will E+A galaxies become? In general, E+As are bulge-dominated, highly-concentrated (Quintero et al., 2004; Tran et al., 2004; Blake et al., 2004; Goto, 2005; Balogh et al., 2005), relatively gas-poor (Chang et al., 2001; Buyle et al., 2006), and kinematically hot systems (Norton et al., 2001). Therefore, in a statistical sense, E+As are likely to become E/S0 galaxies. However, due to a lack of spatial resolution in previous studies, we do not know whether the detailed properties of individual E+As, e.g., their bulge fractions, color gradients, internal kinematics, and newly formed stellar clusters, are consistent with their presumed evolution into early type galaxies. Using HST/WFPC2, Yang et al. (2004) showed that their morphological features are consistent with a transition from late to early types, but their sample contained only the five bluest E+As galaxies from the Las Campanas Redshift Survey (LCRS; Zabludoff et al. (1996)) and thus was not representative. As a result, we still do not know whether the entire population of E+As will evolve into E/S0s, whether there is a distinguishable subclass of E+As that evolves into E/S0s, or whether E+As evolve into typical E/S0s.
To answer these questions, we must understand how well E+As match the full range of E/S0 properties. Most fundamentally, are the global morphologies (e.g., bulge-to-total light ratios and concentration) of the whole LCRS E+A sample consistent with those of E/S0s? Second, E/S0s in the local universe become redder toward their center; these negative color gradients originate from metallicity gradients (Peletier et al., 1990). In contrast, E+As exhibit a wide range of color morphologies (Yang et al., 2004; Yamauchi et al., 2005). Can the color profiles of E+As evolve into those of the typical early types? Third, the number of globular clusters per unit luminosity is higher in early types than in late types (Harris & van den Bergh, 1981). If E+As are in transition from late to early types, one should find new star clusters formed during the starburst. Are there such clusters, and, if so, do their colors and numbers coincide with the expected evolution of the globular cluster systems of present-day E/S0s? Fourth, early-type galaxies lie on the Fundamental Plane (FP), an empirical scaling relation between the effective radius, the central velocity dispersion, and the mean surface brightness, with remarkably small scatter (Djorgovski & Davis, 1987; Dressler, 1987). Will E+As lie on the same FP once they evolve?
To determine whether E+As evolve into objects that are indistinguishable from the bulk of E/S0s, we present HST/ACS observations of the 15 remaining E+A galaxies from the Zabludoff et al. (1996) sample. We combine these with the previous HST/WFPC2 observations of five blue E+As (Yang et al., 2004) and of one serendipitously discovered E+A (Yang et al., 2006). The resulting high resolution imaging of the 21 confirmed E+A galaxies in the LCRS sample enables us to study the detailed color morphologies and the properties of the newly formed star cluster candidates at the sub-kpc scale. The detailed morphologies, color profiles, and cluster populations of many E+As are consistent with the galaxy-galaxy interaction scenario. We discuss how these features will evolve and then relate this evolution to the properties of E/S0s. Using existing kinematic data (Norton et al., 2001) and our HST photometry, we also address whether or not the various scaling relations of E+As are consistent with those of E/S0s.
This paper is organized as follows. We describe our E+A galaxy sample and the HST/ACS data reduction in §2. In §3, we examine the general morphology of E+As, including a discussion of tidal features (§3.1), surface brightness profiles (§3.2), structural parameters (§3.3), and concentration/asymmetry measures (§3.4). The color profiles, including a class of E+As with luminous blue cores (Yang et al., 2006), are presented in §4. We compare the scaling relations of E+As with those of E/S0s in §5. We present the properties of the newly-formed young star clusters in §6. We summarize in §7.
2. Observations and Data Reduction
2.1. LCRS E+A Sample
Our HST imaging sample consists of 21 nearby E+A galaxies spectroscopically identified from the 11,113 galaxy spectra of the Las Campanas Redshift Survey (LCRS; Shectman et al., 1996) with redshifts between 0.07 and 0.18 (Zabludoff et al., 1996). These E+As are required to have strong Balmer absorption features (average equivalent width 5.5Å) and little if any [O II] emission (EW[O II] 2.5 Å). Three-quarters of this sample are in the field, well outside rich cluster environments. The number of each E+A (e.g., EA01) is adopted from Zabludoff et al. (1996) and increases with increasing 4000 Å break () strength. is related to the galaxy’s color — bluer galaxies have smaller . For the remainder of this paper, we refer to each galaxy by its assigned number.
There have been two changes to the original sample since published. One of the original galaxies (EA20) was misclassified as an E+A due to noise in the region of the spectral line diagnostics (Norton et al., 2001). On the other hand, the morphologically disturbed companion galaxy of EA01 lies at the same redshift and also has an E+A spectrum (Yang et al., 2006). We include it in our sample and refer to it as EA01B, and to the original EA01 as EA01A. The EA01AB system is the first known binary E+A system and provides additional evidence that the E+A phase of galaxy evolution can be triggered by galaxy-galaxy interactions.
This LCRS sample is the most extensively studied E+A sample, with data that includes measurements of internal kinematics (Norton et al., 2001), H I content (Chang et al., 2001; Buyle et al., 2006), radio-continuum emission (Chang et al., 2001; Miller & Owen, 2001), NIR fluxes and morphologies (Galaz, 2000), HST optical morphologies (Yang et al., 2004), and spectral diagnostics of nuclear activity (Yang et al., 2006). Table 1 summarizes the basic data and inferred properties from the various studies. Throughout this paper, we adopt , , and .
2.2. HST ACS Observations
By combining the observations of six E+As with HST/WFPC2, EA01AB through EA05 (Yang et al., 2004, 2006), with the new ACS/WFC imaging of the remaining 15 E+As, we now have data for the complete LCRS sample. The ACS/WFC imaging is in the F435W and F625W bands, which closely match the Johnson and the SDSS bands, respectively. We chose these filters to match the two WFPC2 filters (F439W and F702W) used by Yang et al. (2004). Hereafter, we will refer to magnitudes in each of these filters as , , , and , respectively.
The F625W band images consist of three cosmic ray split exposures, one short (200s) and two long (350s) exposures, while the F435W band images consist of only two exposures. The exposure time for each split in F435W ranges from 500 to 550 sec depending on the galaxy’s location on the sky. These uneven exposure times per pointing and the number of splits were adopted to obtain both and band exposures within an orbit, thereby maximizing the efficiency of our HST program by avoiding unnecessary readout overheads.
The images are bias-subtracted and flat-fielded with the standard ACS calibration pipeline. We determine the offsets and rotations between the exposures by cross-correlating the bright field stars and then “drizzle” the individual frames into the geometrically corrected output frame using the Pyraf/Multidrizzle package. We use an output pixel scale of 0.05″per pixel and the square interpolation kernel for the drizzle.
We reject cosmic-rays using the standard Multidrizzle routine for the band images, which have three exposures, and the LACOSMIC algorithms (van Dokkum, 2001) and Multidrizzle together for the band images. Because there are only two images and each exposure is moderately deep, our band images do have coincident cosmic ray hits in the exposures. To address this problem, we identify cosmic rays in the individual images using LACOSMIC, fix the flagged pixels by interpolating across neighboring pixels, and then apply the standard drizzle process. We apply LACOSMIC in a conservative way to retain real objects (e.g., star clusters) and visually check the rejected cosmic rays within a 20″ radius from each E+A.
We use the Vega photometric system calibrated with the ACS WFC zero points, 25.779 () and 25.731 () from Sirianni et al. (2005), and correct for Galactic extinction using the reddening laws (Sirianni et al., 2005) and for an Sc type spectral energy distribution (SED). The color excess, , at each position is obtained from the Schlegel et al. (1998) maps. Because the LCRS sample is at high galactic latitude, the extinction correction is almost negligible for our sample. We do not include the errors from the extinction correction in our error budget.
2.3. Magnitude Transformation and K-correction
To compare our photometric measurements with our previous WFPC2 imaging, and with the color gradients (Johnson and Cousins ) and the Fundamental Plane data (Johnson and Gunn ) of early type galaxies in the literature, we establish the magnitude transformation relation between the ground, WFPC2, and ACS/WFC photometric systems using synthetic photometry of K+A type templates as outlined by Sirianni et al. (2005). Because the spectra of post-starburst galaxies depend strongly on burst strength and time elapsed since the burst, we build a library of K+A type spectra using stellar population synthesis models (Bruzual & Charlot, 2003, BC03). The model stellar populations are composed of a young burst population (A–type) and an old underlying population (K–type). We assume that the old stellar population started forming 5 or 10 Gyr ago and has since experienced an exponentially declining star formation rate ( = 2 Gyr). Superposed is a young stellar population with burst mass fraction, , which represents the fraction by mass of all stars formed in a brief, = 20–300 Myr, burst. We allow the burst mass fractions to range from 0.02 to 1.0. We also vary the metallicities of the old and young stellar populations between and . The purpose of this analysis is not to reconstruct the star formation history (SFH) of our galaxies, but to generate a grid of SEDs that covers the wide range of observed spectral parameters and broad-band colors.
Using this grid of SEDs and the IRAF/Synphot routine, we measure the Johnson , , , Cousins , Gunn , and magnitudes over time until 2 Gyr after the end of burst (well beyond when the galaxy would be classified as an E+A). We derive transformation equations by fitting to the data across the model grid using the following linear relations,
| (1) |
where TCOL and SCOL represent the target and source color (e.g., TCOL = and SCOL = ). In Table 2, we list the conversion parameters for the WFPC2, ACS, Landolt (i.e., Johnson + Cousins ) and Thuan-Gunn systems.
To compare the properties of E+As across a range of redshift (), one should apply K-corrections. In principle, the K-correction can be derived from the known SED of the object for an arbitrary redshift and filter. If SEDs are not available, but there are enough measurements of the broadband magnitudes, one can reconstruct the galaxy SED and calculate the K-correction (e.g., Blanton et al., 2003). However, neither flux-calibrated spectra nor multiple broadband colors are available for our sample.
Therefore, we adopt an alternative approach using the synthetic photometry of the described model K+A SED library. The procedure is similar to what we use to derive the magnitude transformation equations. Using the grid of SEDs, we redshift the rest frame spectra to the appropriate E+A redshift, , measure the observed and magnitudes, and calculate the differences from the corresponding rest frame magnitudes (i.e., K-corrections) as a function of color. For each E+A, we determine the K-correction at the measured () color and use the range of model values as an error estimate for the K-correction.
3. Morphology
3.1. Qualitative Description
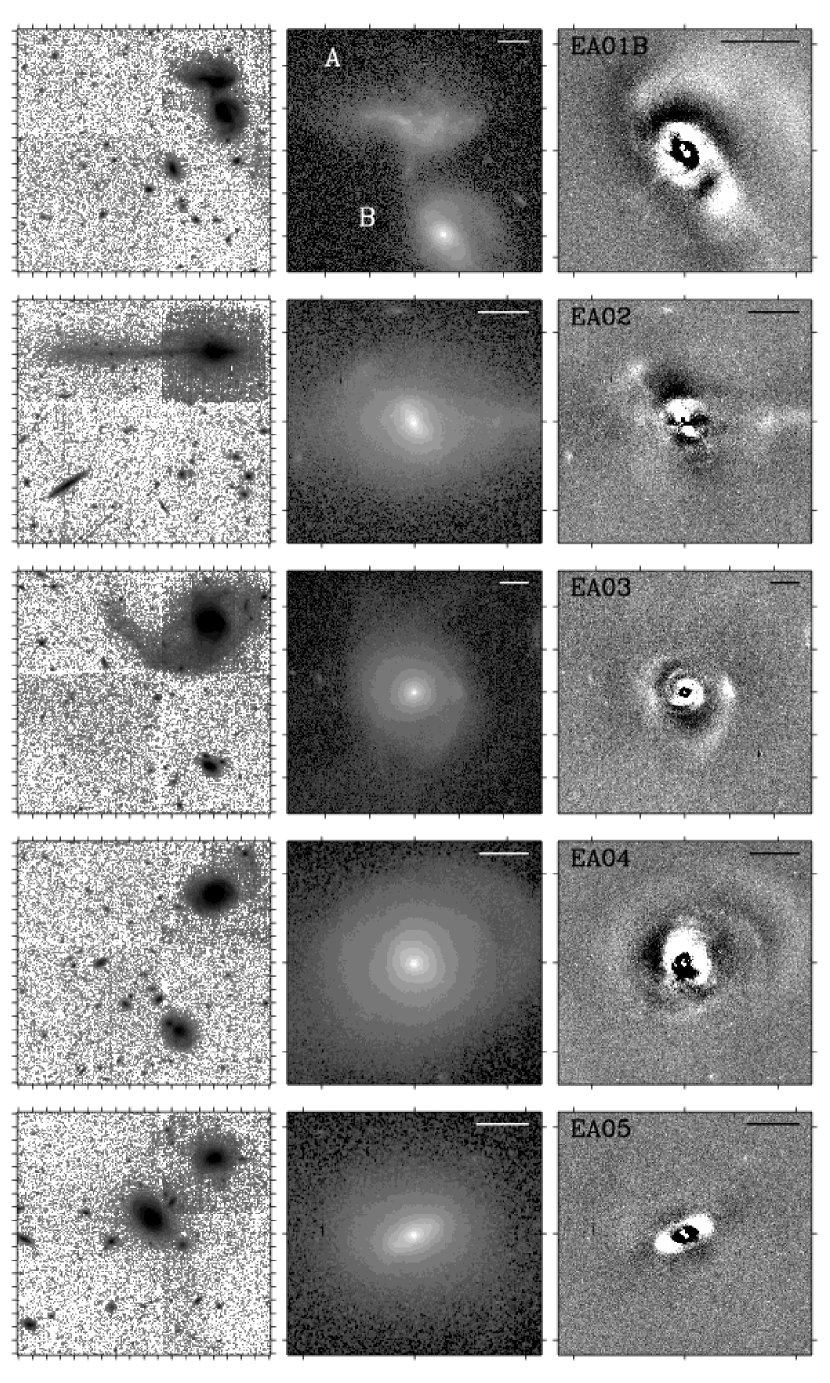
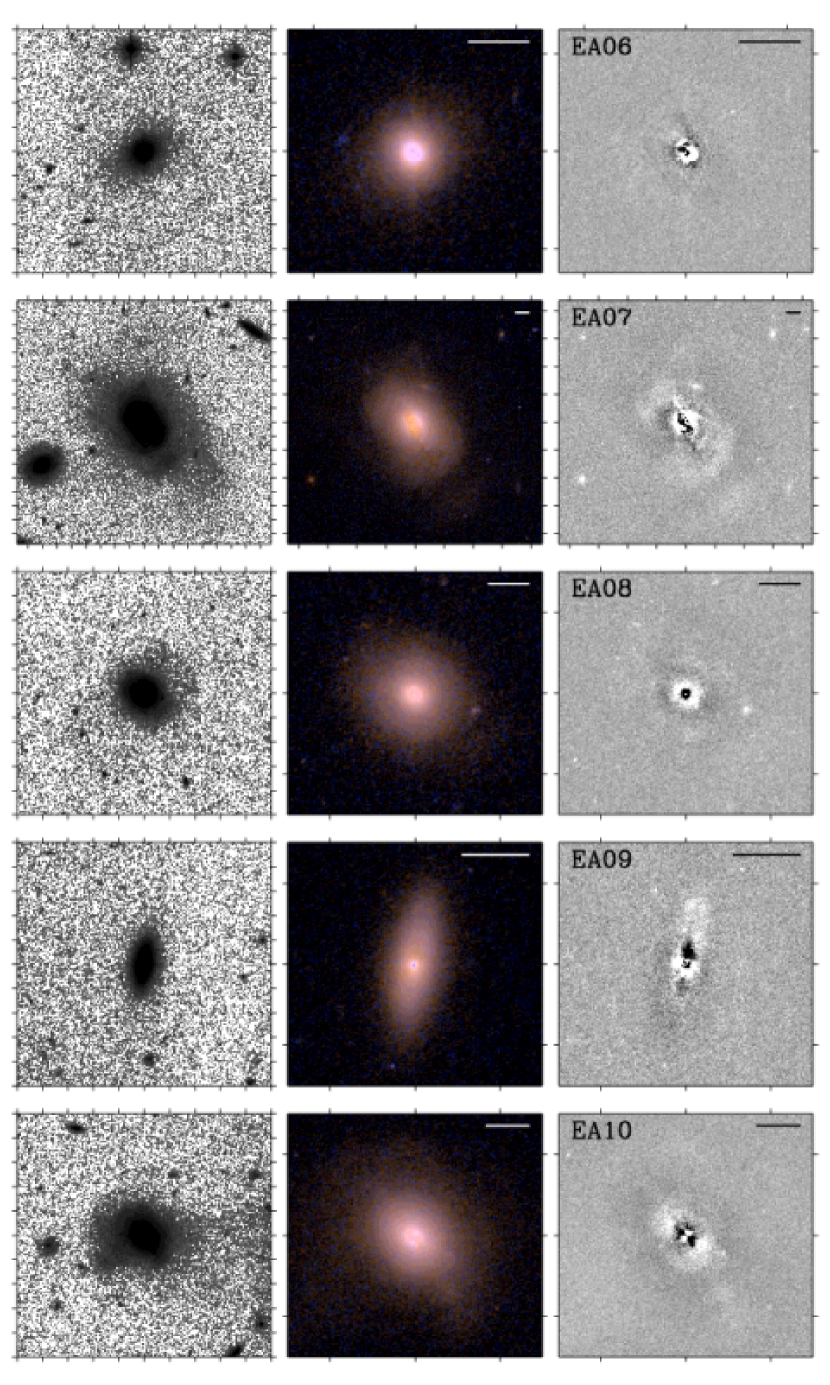
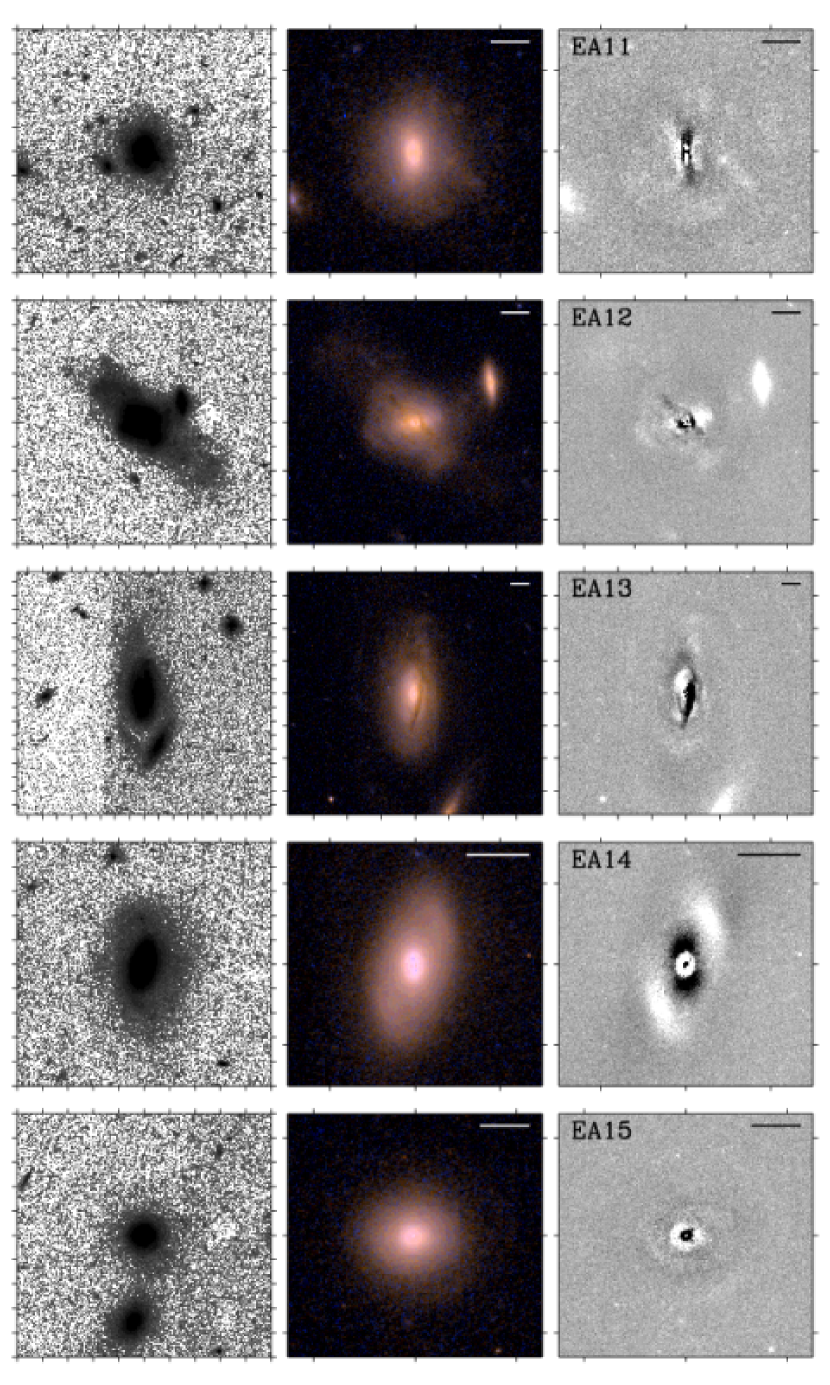
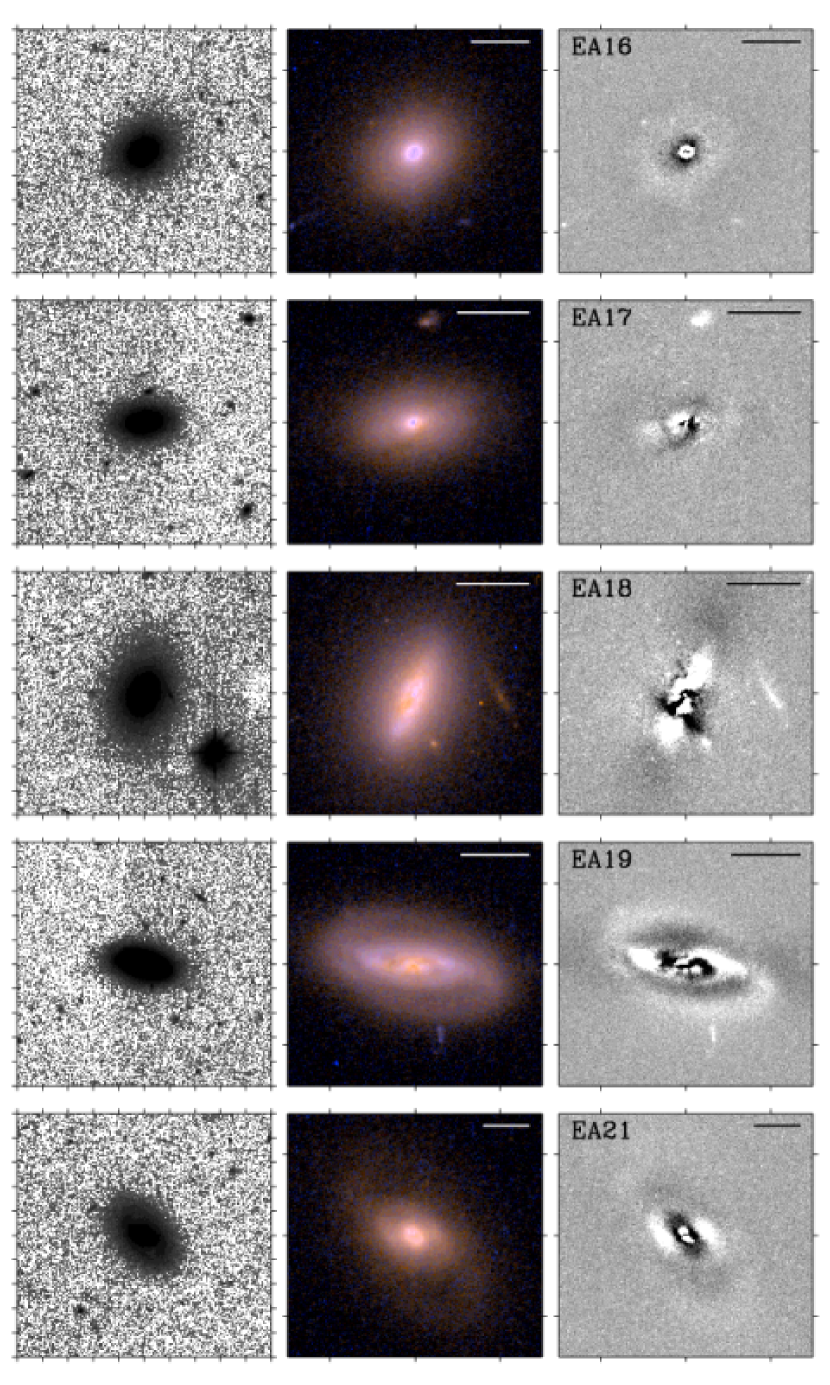
We show images of the six WFPC2 E+A galaxies in Figure 1. The leftmost panels are high contrast images in and reveal low surface brightness features. The middle panels are the band images (the band images are far more shallow). Figure 2 shows the ACS data for the remaining 15 E+As. The leftmost panels are the same as Figure 1. The middle panels here are the two-color composite images from the and bands. We adopt a color scheme employing the arcsinh stretch from Lupton et al. (2004). We bound each image with 4 arcsec tickmarks and include a 4 kpc horizontal scalebar. The right panels of both figures are the band residual images resulting from the subtraction of best-fit models (see §3.2).
High resolution HST images enable us to identify a wealth of small and large scale features. Readers are referred to Appendix A for detailed descriptions of the morphological features. Here we briefly describe our findings. First, the morphologies of E+As are extremely diverse, including train-wrecks, barred galaxies, blue-cores, and relaxed-looking disky galaxies. Given that our E+A sample was selected using uniform spectroscopic criteria, it is striking that the morphologies are so varied. Second, more than half (55%) of the E+As have tidal and/or disturbed features brighter than our detection limit ( mag arcsec-2), supporting the picture that galaxy-galaxy interactions/mergers are responsible for E+A phase. Five E+As also have apparent companion galaxies within 30 kpc that appear to be interacting with the E+A. Third, six E+As (30%) exhibit distinct compact blue cores with a characteristic size of 0.5″. Fourth, seven E+As show dust features, such as lanes and filamentary structures, in the two-color composites or the residual images. Only three of those have color profiles that are seriously affected by these dust lanes (§4).
3.2. Surface Photometry and Model Fitting
To compare E+A morphologies with those of early- and late-type galaxies in a quantitative way, we fit models to the surface photometry. First, to obtain the surface brightness profiles (and the color profiles in §4), we extract the one-dimensional azimuthally-averaged light profiles of the galaxies using the IRAF/ELLIPSE task. Because a large fraction of E+As are disturbed and have asymmetric features, we allow the model to follow the light distribution as closely as possible. Thus, we allow the center, major axis position angle, and ellipticity of each ellipse to change freely, but we force ellipses to not overlap by fitting over a limited radial range along the major axis. The only difference from our analysis of the previous WFPC2 imaging is that we forego point-spread function deconvolution because the errors in the drizzled ACS images are correlated.
To obtain global photometric parameters, such as effective radius , effective surface brightness , and Sérsic index , we use the two-dimensional image fitting algorithm GALFIT (Peng et al., 2002). GALFIT assumes a two-dimensional model profile for the galaxy with the following free parameters: the position of the center, (the total magnitude of the component), (the effective radius), (the Sérsic index), (the axis ratio defined as ), the major axis position angle, and (the diskiness/boxiness index, where indicates boxy). This index plays the same role as the Fourier coefficient term used often in isophote analysis (Jedrzejewski, 1987). As GALFIT explores parameter space, it convolves the model image with a point-spread function (PSF) and compares it to the data for each parameter set.
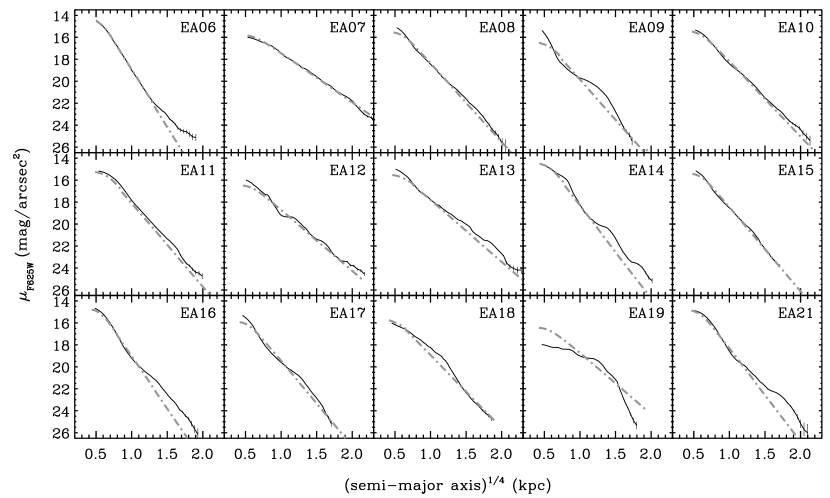
We use three types of model profiles with a pre-determined fixed sky background: 1) -law bulge plus an exponential disk, 2) single de Vaucouleurs -law profile, and 3) single Sérsic -law profile. Therefore, for each galaxy, we have three sets of structural parameters, unless bulge/disk decomposition proves to be impossible (e.g., EA01A and 19). Bulge-disk decomposition (model 1) is useful for determining whether there is a disk and for measuring a bulge fraction (). Model 2 is used mostly to compare the morphologies of E+As with those of normal ellipticals or S0 galaxies, and we use the derived parameters to place E+As on the Fundamental Plane (§5). Model 3 is flexible enough to distinguish early type galaxies () from disk-dominated late type galaxies (). We determine the adopted sky value using median values from 4040 pixel regions that appear free from tidal features or other large scale sources. The GALFIT input PSFs are evaluated using unsaturated stars in the ACS field with S/N higher than 100 as identified by the IRAF/DAOPHOT package. Because the number of available stars is often too small () in each E+A field, we generate the time- and spatially-averaged PSFs using all of the stars () in our HST observations. We fit the galaxy images with all three profiles and determine which profiles are the best fits based on the values and visual inspection of the residual images.
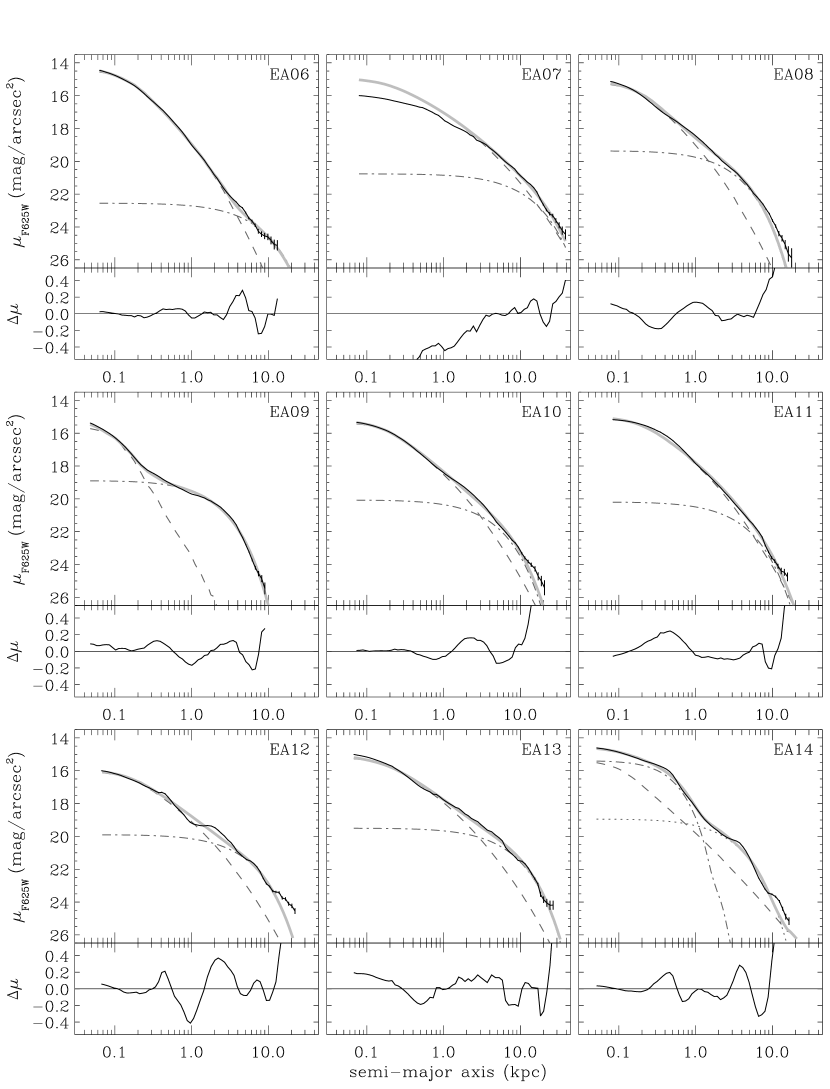
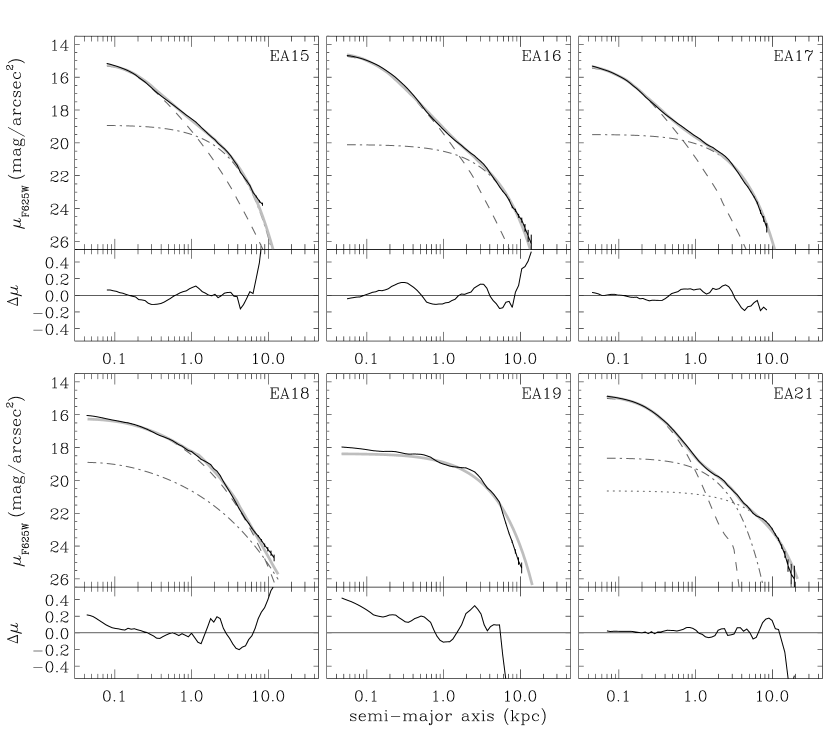
We plot the light profiles derived from the ELLIPSE fit and the best fitting model profiles from GALFIT in Figure 3. As expected, the 1–D and 2–D fits do not always agree, especially when there are a significant changes in PA or ellipticity, but generally they are consistent to within 0.2 mag. Because systematic errors, such as that introduced by the fixed sky value, dominate, we run GALFIT with various plausible fitting input parameters and take the full range of fitting results as representative of the final errors. Therefore, the errors given in Table 4 and 5 are conservative estimates of the true uncertainties.
3.3. Light Profiles
3.3.1 Bulge-disk Decomposition
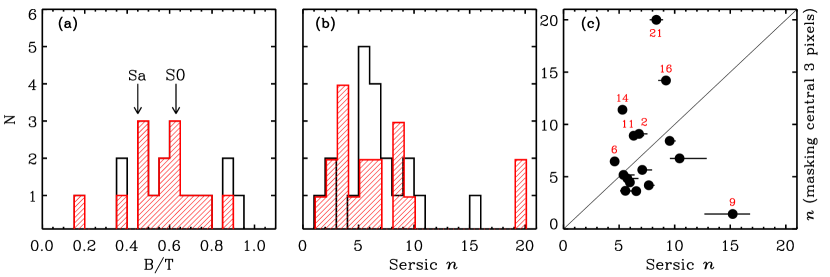
In Figure 4, we show the distribution of the band bulge fractions () of the 15 E+As for which the bulge-disk decomposition is reliable (red shaded histogram). The decompositions are not reliable in other cases, for example, in those galaxies (EA07, 18, 19) where a large portion of the bulge is masked by dust lanes and in strongly disturbed systems (EA01A, EA02, EA12) where the distinction between bulge and disk is meaningless. Except for two disky E+As (EA09 and EA17), most (13/15) of the remaining E+As have ’s greater than the median for Sa’s (0.45; Kent, 1985). The median of E+As (0.59) is consistent with that of S0 galaxies (0.63; Kent, 1985). E+A galaxies are mostly bulge-dominated systems, confirming previous studies using bulge-disk decomposition (e.g., Yang et al., 2004; Blake et al., 2004; Balogh et al., 2005).
3.3.2 Sérsic Profile
The Sérsic index is often used to quantify galaxy morphology (e.g., Blanton et al., 2003) because profiles are flexible enough to represent a wide range of profiles, from those of disk galaxies () to those of spheroidals (). E+A galaxies in the SDSS have large Sérsic indices (median ), and therefore their luminosity is centrally concentrated (Quintero et al., 2004). We fit single Sérsic profiles to all of our E+A galaxies, and present the results in Table 4. This model generally results in larger values than those obtained with bulge+disk decomposition, but both sets of models are statistically acceptable.
In Figure 4, we plot the distribution of the Sérsic index in the band for 20 E+As, the entire sample except for EA01A, which is too disturbed to fit. Most E+As (17/20) have very high Sérsic index, , even higher than the de Vaucouleurs profile of normal ellipticals, indicating that the galaxy’s luminosity is highly concentrated, presumably due to recent centralized star formation. The exceptions are the three dusty galaxies (EA07, EA18, EA19) with , where we hypothesize that the dust lanes partially mask the bulge component. High central concentrations do not necessarily mean that the galaxies are bulge-dominated systems. For example, two of our most disky systems, EA09 and EA17, with 0.17 and 0.35, respectively, have unusually high Sérsic indices ().
What causes the Sérsic index of E+As to be even larger than those of early-types (e.g., Kelson et al., 2000; Graham et al., 2001; Graham, 2002)? We consider three possibilities: 1) we are being misled by the comparison across different studies because the derived Sérsic indices are strongly dependent on the fitted radial range, the choice of fitting method (1D vs. 2D), and the depth of the images, 2) the index is dominated by the presence of an additional, highly concentrated, central source, and 3) misidentification of a disk or tidal feature as the shallow wing of the Sérsic profile is creating the apparently large central concentration. For the remainder of this discussion, we presume that the first possibility is not the origin of these results, although a more thorough cross-comparison among samples is warranted.
To test the degree to which the central regions of E+As affect the Sérsic fits, we mask the centers with a 3 pixel radius mask and repeat the fitting. In Figure 4, we plot the Sérsic indices before and after masking. Most (65%) of the galaxies have a smaller after masking, which suggests that a central concentration does play a role in causing the high ’s. This conclusion is supported by positive central residuals in the model subtracted images (Fig. 1 and 2). EA09 is a special case because the bulge is so small that this masking leaves only the disk component. However, Sérsic indices in six E+As actually increase after the masking. The E+As with a larger resulting after masking generally have ring-like substructures in the residual images and negative central residuals. We conclude that substructures near the center, e.g., bright nuclei, bars, and rings, play an important role in generating the highly concentrated light of most E+As.
The last of our three possibilities is that disk or tidal features are fitted as the shallow wings of the Sérsic profiles. To examine the Sérsic index of the bulge component alone, we fit a Sérsic+disk model. In Figure 4, we show the resulting distribution of Sérsic indices for the bulge components (red shaded histogram) compared with the original, single-component values. The Sérsic index of the bulge itself is more consistent with that of normal bulges (); however, some bulges still have large Sérsic indices (). We conclude that both the central substructures and disk-like features are responsible for the unusually high Sérsic indices in E+As. In any case, our E+As are more consistent with than .
3.4. Concentration and Asymmetry, Residuals
So far, we have derived structural parameters by fitting smooth symmetric models to the images, even though asymmetric features are quite common in the residual images (Fig. 1 and 2). To quantify the asymmetric features and measure morphologies in a model-independent way, we calculate nonparametric measures of the galaxy morphologies: the concentration index (Abraham et al., 1994) and the rotational asymmetry index (Schade et al., 1995). In previous work (Yang et al., 2004), we used the azimuthal Fourier decomposition method (e.g., Rix & Zaritsky, 1995) to investigate asymmetric features of the disk-like components, such as the lopsideness in two face-on disky E+As (EA03 and EA04). We use indices in this paper, because a large comparison sample for the azimuthal Fourier decomposition is not available.
To determine the and indices (collectively referred to as ), we follow the methodology described by Conselice et al. (2000) and Bershady et al. (2000). First, the Petrosian radius is determined from the growth curve for circular apertures requiring that , where is the surface brightness at the radius and is the mean surface brightness within (Petrosian, 1976). We calculate the indices for image pixels within the “total” aperture defined to be twice the Petrosian radius. We measure the asymmetry index by subtracting the galaxy image rotated by 180° from the original image and correcting for the contribution to the asymmetry arising from background noise:
| (2) |
where and represent the image pixels within a circular aperture of radius and the background region, respectively. We choose a rotational center that minimizes by searching over sub-pixel grids with 0.1 pixel resolution. The concentration index is defined by
| (3) |
where and are the radii containing 20% and 80% of the total flux, respectively. Galaxies with a de Vaucouleurs profile () or a pure exponential disk profile have or 2.79, respectively.
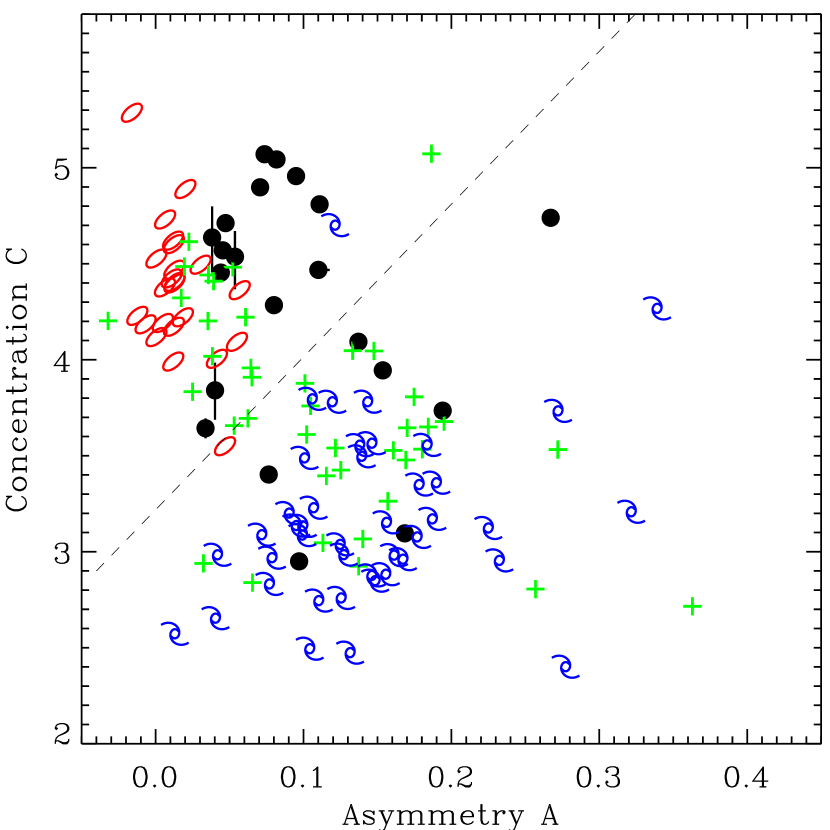
In Figure 5, we show the classification diagram, which is frequently used for the morphological classification of high- galaxies (e.g. Abraham et al., 1996), for our 21 E+As and for 113 local galaxies with various Hubble types drawn from the Frei et al. (1996) catalog. The indices of the Frei sample were measured in exactly the same way as those of the E+As. Although the diagram is not an ideal classification tool (e.g., see Conselice et al., 2000), it is quite useful in distinguishing early from late type galaxies. In Figure 5, intermediate spirals occupy a wide space in the plane, but early-types are segregated from late-types. The indices have low sensitivity to S/N and spatial resolution, within certain limits. For example, Lotz et al. (2004) show that indices can be robustly measured within and for images with an average 5 and a spatial resolution of 500 pc per pixel or better (see also Conselice et al., 2000). Because our HST images satisfy these criteria ( 7 within and a spatial resolution 100 pc per pixel), a direct comparison between the E+As at with the local Frei sample is valid.
E+As populate a wide range in the plane, as already suggested by their morphological diversity. We overlay a dashed line providing a rough division of the plane into regions of early- and late-types. Most of the dusty E+As (EA07, 12, 13, 18, 19) and the train-wreck E+A (EA01A) lie below the dividing line and have large asymmetry and/or low concentration, presumably due to extinction. The remaining E+As are located above the line, but populate a unique part of the plane where there is both high concentration 4.3 and moderately large asymmetry 0.04. These E+As have concentration indices greater than or equal to those of early types (), as expected from their fractions and high Sérsic index ’s, but they have a considerably larger than ellipticals ().
Where in radius does the largest contribution to the parameter come from? Faint tidal features do not contribute significantly to because 1) the total aperture size is not large enough to enclose features at such large radii and 2) the asymmetry is normalized using the total galaxy luminosity (eq. 2), so little weight is placed on low surface brightness tidal features. In the local galaxy sample, small scale features such as spiral arms and flocculence in the disk are the main contributors to (Conselice et al., 2000). However, such features are not visible in the disks of our E+As (except for in EA03 and EA19), which are smooth (see also the NIR imaging from Balogh et al., 2005). Therefore, the large asymmetry of E+As is probably due to relic structures within a few effective radii arising from the starburst and/or recent galaxy-galaxy interaction. Yamauchi et al. (2005) reached a similar conclusion from their analysis of 22 SDSS E+As.
To further investigate the nature of the asymmetry, we compare the asymmetry profiles, i.e., the asymmetry index interior to radius , , of E+As and late-type spirals (). Except for three E+A galaxies (EA01B, 03, 11), E+As have decreasing or flat profiles. Conversely, the late-type galaxies tend to have increasing asymmetry profiles, because spiral arms and flocculence in the disk are increasingly included as the aperture increases. We conclude that the asymmetry in E+As originates mostly in the central parts (within a few ), presumably due to unrelaxed structures or residual dust from the starburst and/or recent merger. These E+As would be classified as “normal” elliptical galaxies or early-type spirals if they were observed at high redshift, unless the disturbances in their innermost regions (within a few kpc) or the low surface brightness features with could be clearly identified. In Table 3, we list the aperture sizes (), indices, and relevant aperture magnitudes.
4. Color Profiles
The radial color profile of a galaxy depends on its dust content and the spatial distributions, ages, and metallicities of its stellar populations, which in turn depend on the evolutionary history of the galaxy. For example, if galaxy-galaxy interactions are responsible for an E+A’s recent starburst, the young stellar population is expected to be centrally concentrated (e.g., Mihos & Hernquist, 1994; Bekki et al., 2005) and to produce a positive color gradient, i.e., a redder color with increasing radius. On the other hand, if the E+A arises from a truncation of continuous star formation, due to a mechanism such as ram pressure stripping in the cluster environment, then it may have a uniform color profile (see the extensive discussions in Caldwell et al., 1999; Rose et al., 2001).
Current observational evidence supports the model of centralized star formation in E+A galaxies. Using long slit spectroscopy, Norton et al. (2001) find that young stars are more centrally concentrated than older ones in our E+As. Even for E+As in clusters, Bartholomew et al. (2001) show that on average they become slightly bluer toward the center than normal early-type galaxies. Recently, Yamauchi et al. (2005) found that a substantial fraction of SDSS E+As have such a positive color gradient. However, these studies are somewhat limited due to the galaxies’ small angular extent and/or the effects of ground-based seeing. In this section, we present high resolution internal color distributions of our E+As and show that indeed a significant fraction have positive color gradients and sometimes distinct blue cores. Then, we investigate whether the color profiles of E+As can evolve into those of early-type galaxies.
4.1. Positive Color Gradients in E+A Galaxies
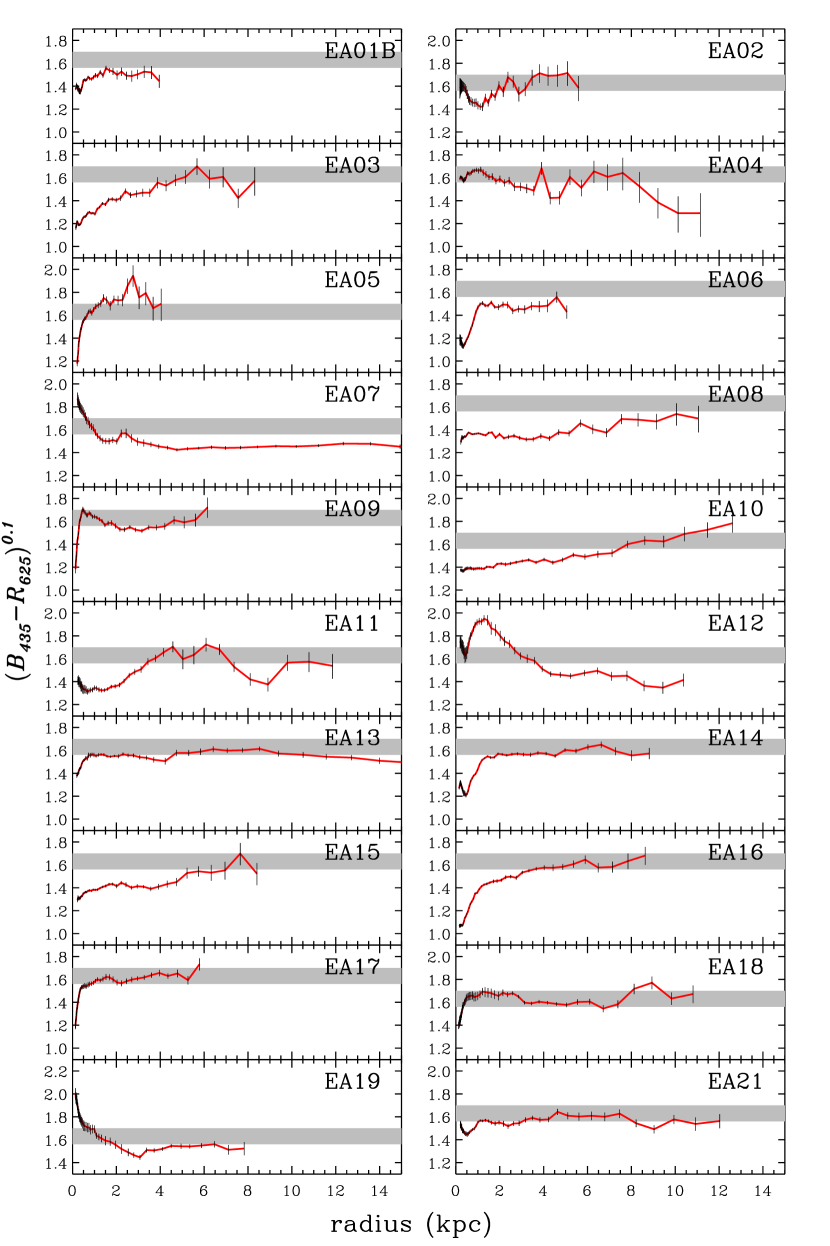
We show the () radial color profiles of 20 E+As in Figure 6, excluding EA01A because it is so irregular. To enable direct comparison between the profiles, the () colors were transformed into (), and all colors were K-corrected with respect to to minimize the K-correction uncertainties. We refer to these colors as . Note that we do not apply different K-corrections along the color gradients because these corrections are small (typically 0.02 mag) compared to the overall K-correction values. We measure the radial color profiles using the surface brightness profiles obtained with the ELLIPSE task. Before fitting ellipses to the isophotes, we correct for the different point spread functions in the and bands by convolving the sharper band images to match the band images. The smoothing kernel is determined using unsaturated stars in both images. We extract surface brightness profiles in the band as described in §3.3, and then extract the band profiles using the same isophotes as in the band analysis.
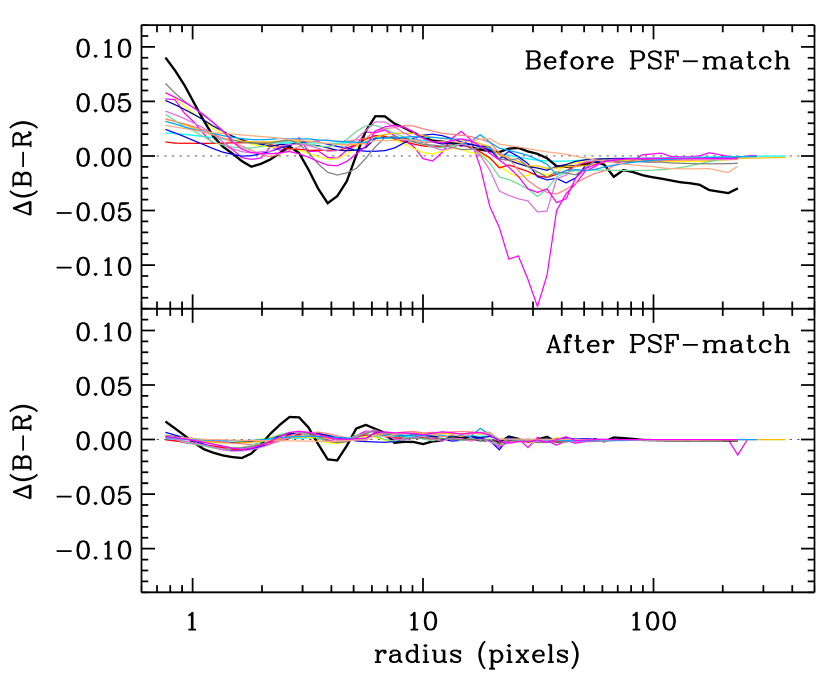
Note that this PSF-matching is critical in order to investigate the innermost color profiles of E+A galaxies and to identify color structures such as blue cores that can be as small as a kpc (see also Menanteau et al. (2004) for a comprehensive treatment of PSF issues). Figure 7 shows the effect of this PSF correction. Assuming an intrinsically uniform color distribution, i.e., a zero color gradient, we generate model and images with the best fitting GALFIT models for our 20 E+As, and then convolve these with the appropriate and PSF’s to generate the “observed” and images. In the upper panel, we plot the observed color profiles when we do not match PSFs. We plot the measured color profiles after PSF-matching in the lower panel. The improvement is obvious and the measured color profiles deviate from the intrinsic flat profile by no more than 0.02 magnitudes. The extracted profiles tend to be biased toward redder cores, but the effect is negligible.
We find that all E+As have globally blue colors, except within dusty regions, and so conclude that recent star formation extends across the face of these galaxies (consistent with the results of Franx, 1993; Caldwell et al., 1996; Norton et al., 2001). In Figure 6, we overlay the model colors of 5 to 10 Gyr-old simple stellar populations which are consistent with those of early type galaxies for comparison.
While E+As are relatively blue overall, their internal color variations are surprisingly diverse, as suggested by their morphological diversity (see Table 6). Twelve E+As (57%) have positive color gradients, i.e., they become redder with increasing radius, while five E+As (20%; EA02, 04, 07, 12, 19) have negative color gradients. The remaining five E+As have relatively flat color profiles or a mixture of positive and negative color gradients. Half of the E+As with positive gradients exhibit blue cores, which we discuss below. This diversity echoes the variation in H absorption line strength profiles observed in cluster E+As (Pracy et al., 2005). We list the overall color morphologies of E+A galaxies in Table 6 within broad categories: positive (including blue core), negative, or flat color gradient.
Among the E+As with negative color gradients, three (EA07, 12, 19) show clear dust signatures, such as dust lanes and irregular filamentary structures in the two-color composite images. The clear detection of dust features in the ACS sample is mainly due to the excellent band sensitivity, and so we cannot exclude the possibility that similar dust exists in the WFPC2 sample galaxies with negative color gradients (EA02 and 04). Therefore, although there are other possible explanations, including a truncated IMF during the starburst (see Bekki et al. (2005)), we speculate that the red cores in these galaxies arise from increasing dust extinction toward the center.
To quantify the color gradients, , we perform linear least-square fits to the radial color profiles. Because of the highly variable color profiles and compact blue cores in some E+As, a single color gradient is obviously not the best representation. Therefore, we measure the color gradients with two piecewise linear fits, allowing the break radius between the inner and outer slope to change freely. Our only constraint is kpc ( 4 pixels) to prevent measuring break radii that might be seriously affected by the PSF. In Table 6, we list the color gradients and break radii from the piecewise linear fits, as well as the color gradient derived from the single line fit. The color gradients are measured in () at to minimize the systematic errors that may arise from the K-corrections and color transformations. For EA01-05, the WFPC2 sample, we measure the color gradient in () at and convert it to () at using the relation () () in Table 2. We find that the broken linear fits significantly improve the fits (s) in all but three E+As (EA01B, 03, 15).
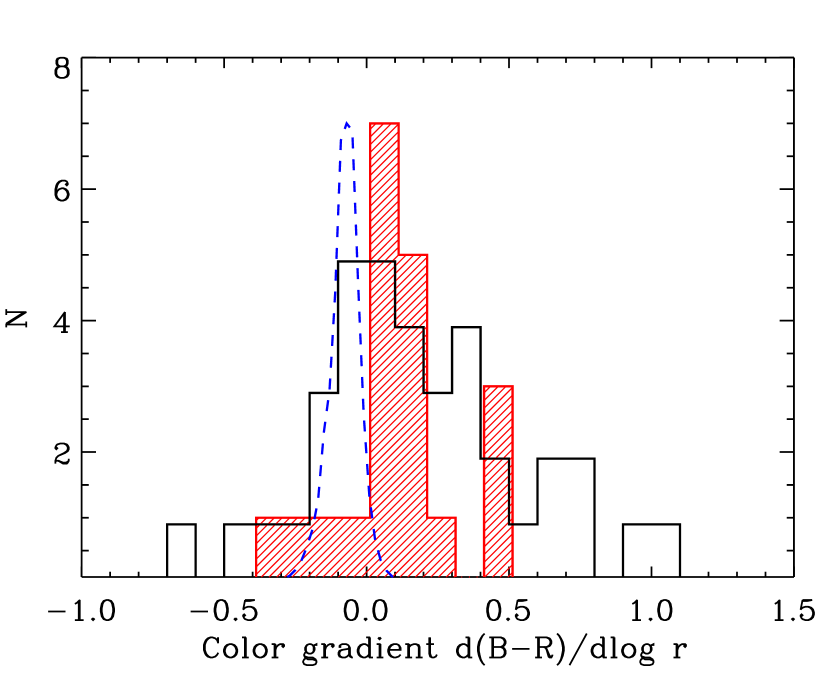
The distribution of color gradients is shown in Figure 8, where the solid and hatched histograms indicate the color gradients for single and double line fits, respectively. The range of color gradients for early-type galaxies (E and S0s from Franx et al., 1989; Peletier et al., 1990) is shown for comparison (dashed curve). The majority of E+As ( 70%) have a positive color gradient that deviates from the slightly negative profile typical of early-type galaxies. We conclude that the young stellar populations are more concentrated than the underlying old populations. This conclusion is independent of whether the single or double line fits are used and is qualitatively consistent with that of Yamauchi et al. (2005).
4.2. Blue Cores
The most interesting morphological feature in certain E+As is the compact, almost stellar-like, blue core that is distinct from the other parts of the galaxy. We define blue core galaxies as those that have a color variation, , within the inner 2 kpc region that is greater than 0.3 magnitudes. This definition is comparable to the original criteria adopted by Menanteau et al. (2001), , for morphologically selected early-type galaxies. Six E+As (EA05, 06, 09, 14, 16, 17) satisfy our definition and have characteristic core sizes of = 0.4 – 1.4 kpc. Within these break radii, the color gradients of blue core galaxies are very steep, . The slopes become relatively flat at radii larger than the break radii. Note that we classified EA01B as one of the blue core galaxies based on its WFPC2 colors in previous work (Yang et al., 2006); however, EA01B is not counted as a blue core galaxy in this paper because its color profile does not have a break radius.
Though the origin of blue cores is not fully understood, they are common in early-type galaxies at higher redshifts ( 0.5), when field spheroids are presumably still assembling. For example, 30% of the morphologically-selected elliptical galaxies in the Hubble Deep Field North have color inhomogeneities, mostly due to blue cores (Menanteau et al., 2001). Treu et al. (2005) find that 8% (14/165) of early-type spheroidals in the Great Observatories Origins Deep Survey North (GOODS-N) have blue cores. Lee et al. (2006) also find “blue clumps” in almost half of the early-type galaxies with blue colors in the GOODS North and South fields. The blue-core E+As in our sample have relaxed morphologies and bulge fractions of . Given that the classification scheme identifies these galaxies as early type galaxies, the blue-core E+As would be classified as early-types if they were observed at high redshift. Therefore, these blue core E+A galaxies might be the local analog of the blue core spheroids often found at high redshift. The importance of blue core E+As for better understanding galaxy-galaxy mergers and the origin of the black hole mass-bulge velocity dispersion relation for galaxies (; Ferrarese & Merritt, 2000; Gebhardt et al., 2000) is described by Yang et al. (2006).
4.3. Evolution of Color Gradient
It is now well established that E/S0s in the local Universe have negative color gradients [ = mag dex-1 in Fig. 8], which originate from their metallicity gradients; their stellar populations become more metal rich and redder toward the center (e.g., Tamura et al., 2000). If E+As evolve into E/S0s, how can their diverse color morphologies converge into such a narrow range of color gradients within a few Gyr? In particular, is it possible that the observed positive color gradients invert into the negative color gradients typical of early-types?
For those E+As whose negative color gradients arise from dust, it is difficult to determine the underlying color gradients without incorporating radiative transfer calculations (Wise & Silva, 1996). Nor do we know how the dust content will evolve. However, were the dust in these E+As to disperse somehow, the negative color gradients [ ] would flatten and be more consistent with those of E/S0s.
For those E+As with positive color gradients — which are most of the sample — the centralized starburst will naturally lead to metallicity and color gradients if the young stellar populations are more metal rich than the underlying old populations. Although violent mixing during the merger could dilute any previously established metallicity gradients, numerical simulations suggest that metallicity gradients might be regenerated by centralized star formation (Mihos & Hernquist, 1994; Kobayashi, 2004).
To investigate the evolution of the color gradients of E+As quantitatively, we take the current color gradients and evolve the stellar populations using simple assumptions. We assume that the current color gradients are due solely to burst-strength gradients and that the young populations are coeval, i.e., that the last starburst was instantaneous. We adopt a uniform metallicity () for the old population, and consider and for the young population. Then, for each galaxy, we choose a single post-burst age (the time since the starburst ended) that produces the whole range of colors observed in that galaxy, and derive the burst strength profile that reproduces the color profile. As older post-burst ages are selected, the burst strength gradient increases for a given color, and therefore larger metallicity gradients are introduced. We evolve these stellar populations passively for 5 and 10 Gyr ignoring further dynamical evolution, and measure the resulting color gradients.
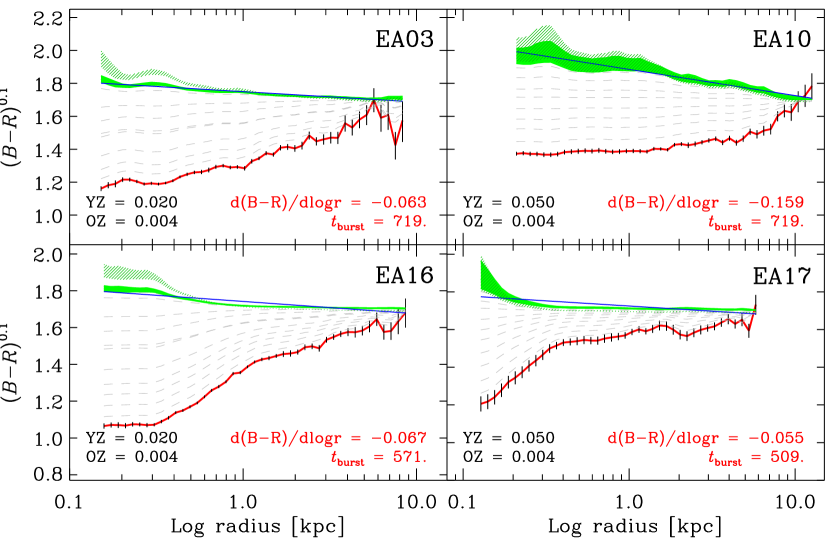
In Figure 9, we show the color gradient evolution for two E+As with positive gradients (EA03 and 10) and for two with blue-cores (EA16 and 17). The solid and the dashed lines represent the current color profiles and their subsequent evolution, respectively. Taking into account measurement errors, we show the range of color profiles after 5 and 10 Gyr with the solid and hatched regions, respectively. We adopt for EA03 and EA16 (left panels), and for EA10 and EA17 (right panels).
In these examples, the positive color gradients can invert within 5 Gyr and evolve to a color gradient range [ ] consistent with that of E/S0s. Larger metallicity differences between the old and young stellar populations and older post-burst ages will result in steeper metallicity and color profiles after 5–10 Gyr. While it is hard to predict the true color gradient evolution of the E+As without exact knowledge of the post-burst ages and metallicities, our calculation shows that the current color profiles, most likely arising from a centralized starburst during a galaxy-galaxy tidal interaction or merger, can evolve into those of early-type galaxies.
5. E/S0 Scaling Relationships and E+As
In previous sections, we have shown that some aspects of E+A morphology (, concentration , Sérsic index ) are consistent with those of current early-type galaxies. We have also presented models or arguments in which other aspects now inconsistent with current early-type properties (blue cores, tidal features, and positive color gradients) could, via evolution, become consistent with the properties of current early-type galaxies. To further investigate whether E+A galaxies truly evolve into present-day early-types after a few Gyr, when the discrepant morphological features might disappear, we test whether E+As will eventually lie on the various scaling relationships of early-type galaxies. For example, Tacconi et al. (2002) and Rothberg & Joseph (2006) show that late-stage ultra-luminous infrared galaxy (ULIRG) mergers and optically selected merger remnants (other possible progenitors of present-day E/S0s) are located very close to or on the K-band Fundamental Plane (FP) of early type galaxies. We start with the simplest forms of the scaling relations, i.e., the Faber-Jackson relation (FJR; Faber & Jackson, 1976) and the Kormendy relation (KR; Kormendy, 1977).
5.1. Faber-Jackson and Kormendy Relations
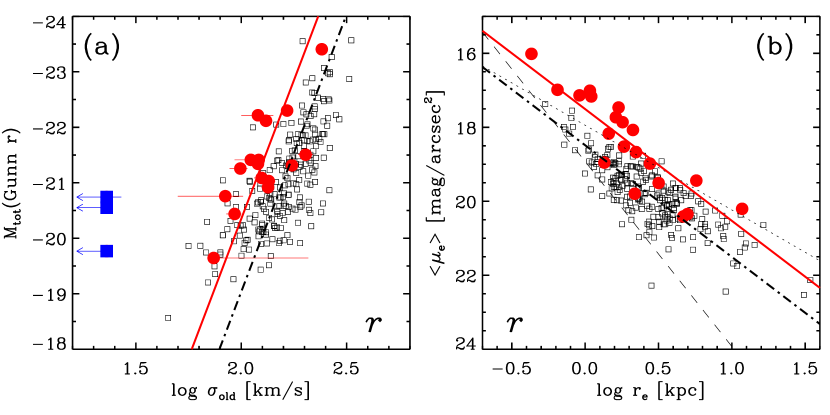
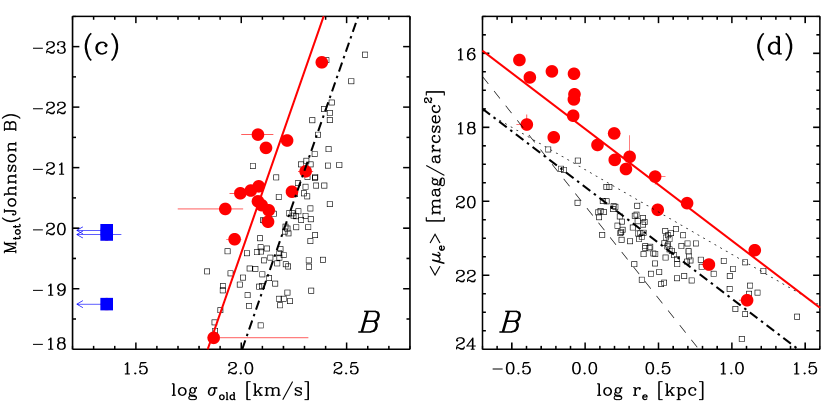
In Figure 10, we show the Faber-Jackson relation () and the Kormendy relation () of E/S0s in comparison to those of E+As. We draw the E/S0 comparison sample from Jørgensen et al. (1996), because their photometric bands (Gunn and band) closely match our HST WFPC2 and WFC filters. For the E+As, we adopt the velocity dispersions of the old components () from Norton et al. (2001). To disentangle the kinematics of the young and old stellar populations, Norton et al. (2001) simultaneously fit the velocity profile and the relative contributions of different stellar components using longslit (1.5″ 6.6″aperture) spectra. For three E+As (EA06, EA17, and EA18), we have only upper limits on , because a large fraction of the light is contributed by a young A-type population ( in N01) and thus the velocity dispersion of the old K-type population is not measured reliably. Although we include these galaxies in Figures 10 and 12, we exclude them from the following analysis. For the structural parameters, we adopt , and the total magnitude from our de Vaucouleurs fit (Figure 11). While a single de Vaucouleurs profile is not an ideal fit/model for complex morphologies (e.g., EA02) and/or for disky systems (EA09 and EA17), we justify the choice of from the fits as a simple measurement of the half light radius of the galaxy. Indeed, we find that the luminosity within given by the GALFIT fit agrees with a circular aperture measurement of the half light radius to within 10–20%.
We reproduce Norton et al. (2001)’s result that there is a strong correlation between E+A magnitude and velocity dispersion, and find that it is roughly parallel to the E/S0 Faber-Jackson relation with some offset (left panels in Figure 10). This relation implies that E+A galaxies already harbor dynamically relaxed old populations and that they are pressure-supported systems. While Norton et al. (2001) had to perform several steps to transform the LCRS Gunn/Kron-Cousins magnitude into Gunn magnitude to compare the properties of E+As with those of E/S0s, we determine more directly the relative offsets between the E+As and E/S0s with our HST photometry. We measure the offset by fitting the (i.e., ) relation to the E+As and the J96 sample.
On average, E+A galaxies are 1.31 () and 1.64 () mag brighter than the E/S0s in the Gunn and bands, respectively. This offset in Gunn is almost twice as large ( 0.6 mag) as that derived by Norton et al. (2001). This difference arises not only because we use improved photometry and magnitude transformations, but also because the functional forms used to calculate the offset are different.
These offsets can be interpreted as either that E+As have an elevated luminosity for a given velocity dispersion or that they have an unusually low velocity dispersion at a given luminosity. To investigate which interpretation is more correct, we compare E+As to E/S0s on the purely photometric scaling relation, i.e., the Kormendy (1977) relation (hereafter KR), between the effective radius () and the mean surface brightness within . The right panels in Figure 10 show the KRs for the E+As and E/S0s, the latter of which is corrected from the original KR Kormendy (1977) by assuming an average color, 1.20 (Fukugita et al., 1995). The slope of the relation is known to be insensitive to the band. For example, Hamabe & Kormendy (1987) find a slope of 2.98 in the band compared to 3.02 in the band.
In the KR plane, most of E+As, except for a few disky ones, have a higher surface brightness than E/S0s at a given effective radius. The average offset between E+As and E/S0s is 0.98 and 1.57 mag in and , respectively. The offsets appear to increase as the galaxies become smaller; roughly half of the E+As do not overlap with the and band E/S0 loci. The lower boundary (dashed line) of the E/S0 region is set by the limiting magnitude of . The upper boundary is not due to selection effects (see §5.3). Because the surface brightness offsets in the KR are consistent with the magnitude offsets obtained from the FJR, we conclude that elevated luminosities, probably due to the recent star formation, are responsible for the offsets of the E+A scaling relations, rather than unusually low velocity dispersions. While the FJR and KR suggest that roughly one magnitude of fading may bring E+As down to the E/S0 scaling relations, the large scatter makes such an analysis difficult.
5.2. Fundamental Plane
The fundamental plane, hereafter FP, is an empirical scaling relation between the effective (or half-light) radius , the central velocity dispersion , and the mean surface brightness within for early type galaxies (Djorgovski & Davis, 1987; Dressler, 1987). Although the physical origin of the FP is not fully understood, both cluster and field early-type galaxies follow this relation with remarkably small scatter (e.g., 0.1 dex in in the Gunn band; J96), and an extension of this formalism appears to fit all spheroids ranging from Galactic dSph galaxies to the intracluster stellar component of galaxy clusters (Zaritsky et al., 2006).
To examine the FP of E+As and compare it with that of E/S0s, we adopt the definition and methodologies of Jørgensen et al. (1996) (see also Kelson et al., 2000). The fundamental plane is defined as
| (4) |
where , , and are the effective or half-light radius in kpc, central velocity dispersion in km s-1, and mean surface brightness within in units of . For the E+A structural parameters, we adopt and from the single de Vaucouleurs fits to our HST images (Figure 11). We transform the mean surface brightness in our HST bands into Gunn and Johnson using our transformation relations (eq.1) and the coefficients in Table 2. We convert to units of using the relation , where the constants are 26.4 and 27.0 for Gunn and Johnson magnitudes, respectively. We do not apply a color-dependent correction to , because the E/S0 FP is only weakly sensitive to color (Pahre et al., 1998; Bernardi et al., 2003).
5.3. Location of E+As on the FP
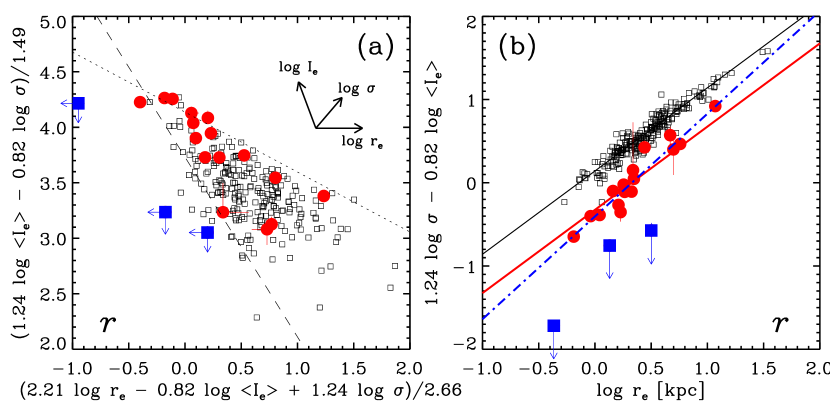
We show the location of our E+As on various projections of the J96 FP in the Gunn and bands in Figure 12. Figures 12 and 12 present the face-on view of the E/S0 FP in and , respectively. The dashed line is the boundary set by the limiting magnitude of , which corresponds to the constant magnitude line (dashed line) in 10 and 10. The boundary set by the dotted line divides the plane into the E/S0 FP and the so-called zone of exclusion (ZOE), where dynamically relaxed systems do not reside (Bender et al., 1992). The physical origin of this boundary is not fully understood, although it might correspond to the upper limit of the velocity dispersion function of early-type galaxies ( km s-1; Treu et al., 2006). In the face-on projection, E+As span the same region defined by the normal early-type galaxies in the band; however, half of our E+As violate the zone of exclusion in the band. We plot vectors parallel to the FP parameters to find out which parameters drive this shift in the band. E+As are shifted from the E/S0s along the direction of increasing , as we concluded earlier from the Kormendy relation. Given that E+As already populate the same region as E/S0s in the band and that the offset is larger in , this violation of the ZOE must be due to the temporary increase of the surface brightness caused by the recent starburst.
Figures 12 and 12 present the edge-on projection of the E/S0 FP, defined as and , in and , respectively. In this projection, E+As are distinct from E/S0s. The existence of a tight correlation among E+As indicates that they follow their own scaling relation. The large offset between the E/S0s and E+As suggests that the E+As’ current stellar content is different. Although the mechanisms that trigger the E+A phase and stop star formation are not fully understood, any model must be able to explain the relative tilt and offset of the E+A FP. In the following section, we discuss how the observable properties are related to physical ones, such as mass-to-light ratio M/L, and possible interpretations of the tilt and offset.
5.3.1 FP Offsets: Evolution of the FP Zero Points
E+A galaxies stand apart from the E/S0 FP in the edge-on projection (Figures 12 and 12). The difficulty in interpreting this difference is that any, or all, of the three plotted parameters or the implicit parameter, M/L, may be evolving as the E+A evolves. The simplest option is to assume that only M/L evolves. In this case, the offset between the two populations can be directly related to a difference in M/L ,
| (5) |
where the FP offset is measured from the difference between the intercepts of two parallel lines in Figures 12 and 12. We find in the Gunn band, which implies = . In other words, E+As have, on average, a M/L that is 3.8 times smaller than that of E/S0s. Note that this average offset has a smaller error than the offsets measured from the FJR and KR. However, as we have shown previously in §4, the structural properties are affected by the E+A phase (the color gradients are altered, some E+As have blue cores) and so assuming that only M/L evolves cannot be completely correct. Our expectation is that will be smaller in E+As because of the centrally concentrated star formation, and hence that will increase (and decrease) as the E+A evolves, leading to a complex evolution on the FP. Therefore, the M/L difference discussed above is the minimum amount of fading that E+As should experience to settle onto the E/S0 locus. By examining the tilt of the FP, and other projections of the scaling laws, we explore whether we can proceed beyond this simple model and the potential complexity of evolution on the FP.
5.3.2 FP Tilts: Variation of M/L along the FP
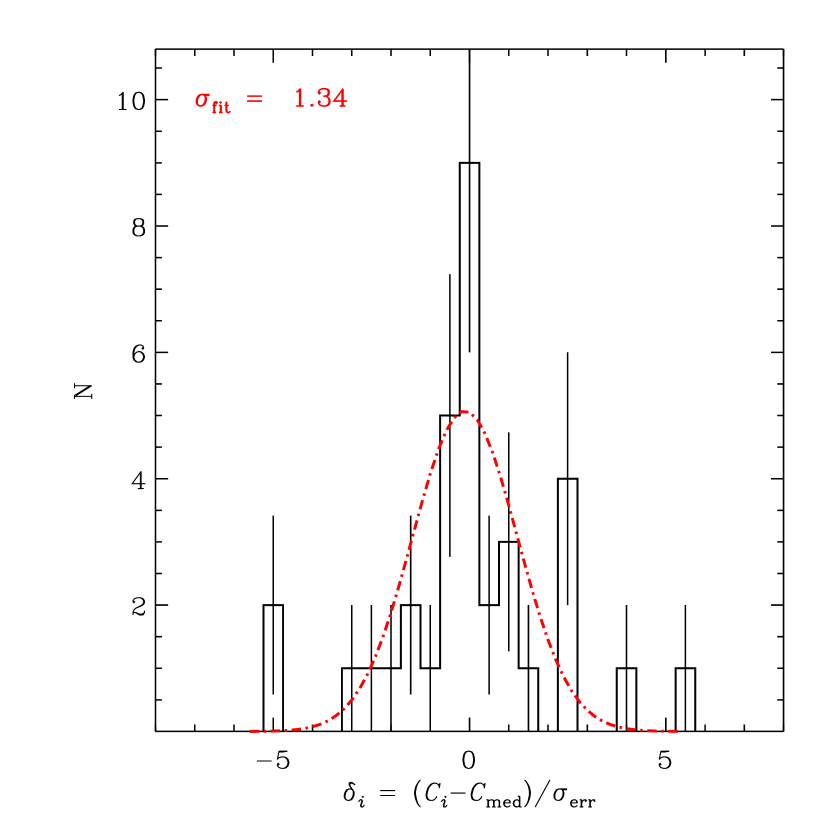
Given the range of possible evolutionary paths on the FP, it is rather surprising that there is a tight relation for E+As on the E/S0 FP edge-on projection. Furthermore, the difference appears to be both a relative shift and a tilt. To measure the relative tilt of E+As with respect to E/S0s, we find the best-fit plane in the form of equation 4 through the E+As using an orthogonal fitting method that minimizes the normal distances to the plane. We adopt this fitting method to enable direct comparison with the fits from J96. J96 find , for Gunn and , for Johnson using 226 and 91 cluster galaxies, respectively. Using 16 E+A galaxies111This excludes EA01AB, 07, 17 and 18 which do not have a measured . and taking an equal weight for each galaxy, we find that the best-fit FPs are
| (6) | |||
| (7) |
for the Gunn and Johnson bands, respectively. The errors in , , and are estimated using the bootstrap method. The rms scatter around these planes is 0.10 and 0.10 in for Gunn and Johnson , respectively. The parameters (, , ) for Gunn and Johnson agree within the uncertainties, because the FP parameters are generally not highly sensitive to the bandpass (J96). Therefore, we adopt the (, , ) derived using the Gunn data in the following discussion. While for the E+A FP agrees to within the errors with that of the E/S0 FP () (the E+A FP is still viewed edge-on in the projection in Figure 12), for the E+As is discrepant from that of the E/S0s (). In the context of interpreting differences between the FPs as primarily due to M/L, the tilt implies a mass dependence. A similar tilt of the FP of merger remnants is observed relative to the K-band E/S0 FP (Fig. 1; Rothberg & Joseph, 2006).
The tight correlation within the E+A FP suggests that M/L is correlated with the structural parameters. The scatter around the plane appears to be comparable to the typical scatter of E/S0 FPs ( 0.1 dex). Does this mean that E+As, many of which are clear merger remnants, settle into a relaxed state on a short timescale? Or is it possible that the correlation is the result of a selection effect? Our selection of galaxies with strong H absorption tends to choose galaxies with stronger bursts and/or the younger ages; therefore it is possible that our sample represents only a certain part of the FP, i.e., near the exclusion zone. To address this issue, a larger sample of E+As covering a wider range of H strengths is required.
Using the best fit FP parameters, M/L for E+As can be expressed as
| (8) |
compared with for E/S0s. Unlike in the E/S0 FP, where M/L is a function mostly of mass, M/L for E+As depends on the effective radius as well as the mass of the system. E+As with smaller effective radii have smaller M/L, possibly resulting from a stronger burst and/or shorter time elapsed since the starburst. Because M/L is proportional to at a fixed velocity dispersion, one might expect that a smaller would lead to a larger M/L, but the observed trend is the opposite. Therefore, the surface brightness of E+As must increase faster than the mass or size of the galaxy decreases. This inference is consistent with the observed KR (Figure 10), in which deviates further from the E/S0 relation for E+As with small effective radii.
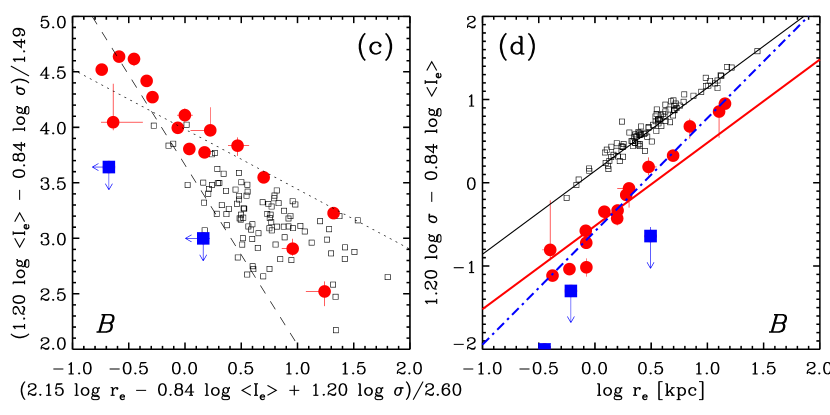
If M/L does indeed vary among E+As, then one might expect a correlation between the deviation of M/L from E/S0s and the color of the galaxy. In Figure 13, we plot M/L against () color, and against other parameters (mass, , Sérsic , and ). We find a strong correlation between M/L and color, but no significant correlation with or . A Spearman rank test shows that only () color correlates with M/L at a significance level higher than 99.5% for both the and bands. We conclude that the tilt, i.e., the variation of M/L within the E+A FP, does reflect a real variation of the stellar population. E+As with smaller effective radii have younger stellar populations, on average, and therefore, smaller .
The remaining question is what does the small physically represent? Does it indicate that the intrinsic size of the galaxy is small or that there was a strongly concentrated starburst? We compare the effective radii in and to address these questions. In blue-core E+As or E+As with the positive color gradients ( 75% of E+As), the effective radius tends to be smaller in the band () than in the band (). In these galaxies, it is likely that will eventually become close to as the light from the young stars in the central region fades and the color gradients flatten. However, most galaxies have fairly small differences, 0.30, which is clearly not enough to produce the tilt observed over two orders of magnitude in effective radius.
To further test whether intrinsically small galaxies have smaller M/L’s, we repeat the orthogonal fitting, but this time exclude galaxies with 0.15, i.e., for which the two effective radii differ by more than 25%.222 We boost the statistics of this test by combining the and band sample assuming the same FPs parameters for both bands (see §5.3.2). For this subsample, the color gradients are moderately flat and there is little dust, so strong evolution in the effective radius due to stellar evolution is unlikely. The fitting of this subsample results in the same FP slope as for the full sample, implying that intrinsically small and therefore less massive galaxies have smaller M/L ratios.
Blue-core galaxies analogous to our blue core E+As (§4.2) are found among early-type galaxies at high- (van Dokkum & Ellis, 2003; Treu et al., 2005), and their rest-frame B-band M/L is estimated to be much smaller (roughly ) than that of normal E/S0 galaxies at the same epoch. As a cautionary note, we examine how the difference between the blue and red affects the measurement of M/L , especially for blue core galaxies. When we use the blue to derive for our blue core E+As, we find that M/L can be biased low by a factor of 1.25 to 5.5 relative to that derived using the red .
5.3.3 Will E+As Evolve into E/S0s?
In summary, the scaling relations of E+As demonstrate that their stellar populations are currently different from those of E/S0s. This conclusion is drawn from the FP parameters (, and ) in one photometric band, and therefore is derived independently from our spectroscopic knowledge that E+A galaxies have significant A-type populations. The surprising finding is that among E+As, the variation of stellar populations is closely tied to the structural parameters, i.e., E+As follow their own scaling relationships such that smaller or less massive galaxies have a smaller M/L. Such a trend arises naturally within a merger scenario, where low mass galaxies (the progenitors of low-mass E+As) have higher gas fractions (Young & Scoville, 1991) and could produce relatively larger populations of young stars.
Will E+As fade onto the fundamental plane of E/S0 galaxies after a few Gyr? This question is difficult to answer fully due to the complex interplay between galaxy’s dynamical evolution and the evolution of its stellar populations. However, if we ignore the dynamical evolution, we can estimate the amount of fading using a stellar population synthesis model (Bruzual & Charlot, 2003, BC03). We adopt a simple star formation history for the E+As: a single instantaneous starburst on top of an underlying 10 Gyr old single burst population. Both populations have Salpeter IMFs and solar metallicities.
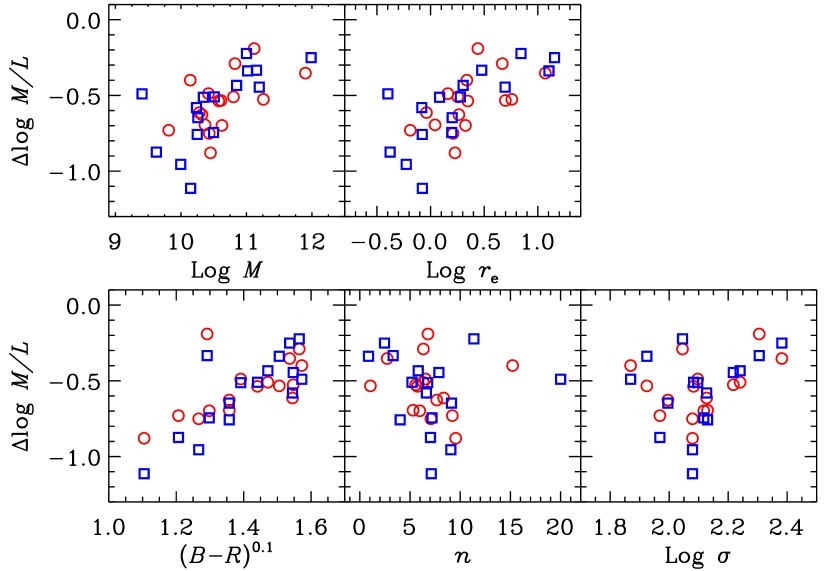
The largest uncertainties in determining the amount of fading and the time required for settling onto the E/S0 FP are the unknown post-burst age (the time elapsed since the burst) and burst strength (the fraction of the stellar mass produced during the starburst). Because we are unable to break the degeneracy between post-burst age and burst-strength for this sample (see, however, Yang et al. 2008, in prep.), we test whether the required fading time is reasonable for the galaxies whose post-burst ages and burst strengths are consistent with the FP offset (1.42 0.36 mag in Gunn ). For various post-burst ages and burst fractions in Figure 14, we calculate how much the galaxies should fade and how long it will take from the given post-burst age until their () colors agree with that of a 10 Gyr old simple stellar population, i.e., until they become E/S0s. The lined region in Figure 14 shows the post-burst ages and burst fractions that would satisfy the E+A selection criteria adopted by Zabludoff et al. (average Balmer equivalent width 5.5Å). The shaded region represents those galaxies that will fade by 1.42 () mag until their () colors match the 10 Gyr old population i.e., those E+As whose M/L’s are consistent with the observed FP offsets. This shaded region illustrates the degeneracy between the post-burst ages and burst strength: old/strong and young/weak bursts both explain the observed FP offsets. We also show the required fading time (3, 5, and 7 Gyr) with contours. The shaded region falls between 3 and 7 Gyr, indicating that E+A galaxies with reasonable post-burst ages (100 – 700 Myr) and burst fractions (7 – 50%) will settle onto the E/S0 FP after 5 Gyr.
6. Young Star Clusters
The properties of star cluster systems in early type galaxies, e.g., the color bimodality, provide important clues for how the host galaxies formed and how they assembled their stellar content over time (see the recent review by Brodie & Strader, 2006). If many or all E+A galaxies result from galaxy-galaxy close interactions or mergers, as suggested here and in previous work (Zabludoff et al., 1996; Yang et al., 2004, 2006; Blake et al., 2004; Tran et al., 2003, 2004; Goto, 2005), and evolve into E/S0s, as we argue in this paper, the photometric properties of their cluster systems should be consistent, to within evolutionary corrections, with those of early types. In the WFPC2 sample, we discovered young star clusters around four E+As333EA01A, 02, 03, 04 (Yang et al., 2004). These clusters are much brighter than Galactic globular clusters and have blue colors consistent with ages estimated roughly from the E+A galaxy spectra ( Gyr). Our new ACS observations of the remaining LCRS E+As also reveal a number of point-like sources surrounding the galaxies. In this section, we first present the evidence that these are newly-formed star clusters, then investigate whether their colors and luminosities are consistent with being created concurrently with the burst that generated the young stars in the E+As, and finally test whether these cluster systems can evolve into the globular cluster systems of present-day E/S0s.
6.1. Detection and Photometry of Cluster Candidates
To detect cluster candidates, we use SExtractor (Bertin & Arnouts, 1996) on both the original and model-subtracted residual band images (Fig. 2). After testing various selection criteria and visually inspecting the detected point sources, we require that cluster candidates have at least 4 adjacent pixels whose flux in each pixel is at least larger than the local sky value, where is the root mean square (rms) of the local sky values estimated using a background mesh size of 4–8 pixels in SExtractor. We use the residual images to find compact sources within the galaxies, where the rapidly varying galaxy surface brightness prevents the reliable detection of sources in the original images. We choose to lower the detection threshold to 2.5 for the residual images, because is inflated by the residual galaxy light. From this initial source list, objects with an apparent magnitude , elongation , and isophotal area pixels are rejected as possible foreground stars or background galaxies.
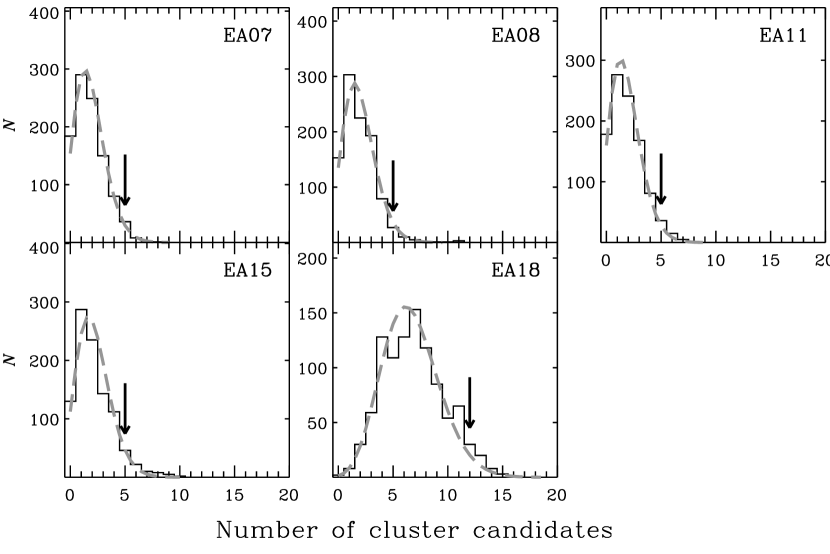
Because clusters are expected to be unresolved at the distance of our E+A galaxies ( 100 pc per pixel at ), contamination from background galaxies, foreground stars, hot pixels, and residual cosmic-rays could be problematic. Therefore, we run a statistical test to determine whether there is an excess of compact sources near each E+A. First, we build a control sample of cluster-like sources from the entire ACS field (200″200″) outside of a 20 kpc radius from the E+A using the same selection criteria. Then we calculate the distribution of the number of the sources within circular beams of 20 kpc projected radius at random positions in the ACS field outside a 20 kpc radius from the E+As. If there are significantly more cluster candidates within the 20 kpc beam centered on the E+A than in the random beams, then it is likely that these are true compact objects associated with the E+A. We test various beam sizes, e.g., fixed angular size versus physical size, and find that our conclusions are insensitive to this choice.
Five E+As (EA07, 08, 11, 15, 18) have an excess of associated point sources at a confidence level greater than 90%. We show the number of cluster candidates found near the E+As relative to the distribution found within random beams in Figure 15. Because of the post-starburst nature of E+As and the merger signatures clearly seen in EA07, 11, and 18, it is likely that these sources are the newly formed star clusters often found in on-going mergers (The Antennae; Whitmore & Schweizer, 1995) and merger remnants (NGC7272; Whitmore et al., 1993).
To test whether the colors and luminosities of these cluster candidates are consistent with a merger origin and with evolution into the globular cluster populations of E/S0s, we measure aperture magnitudes in the and band images. Because many cluster candidates are located within the galaxy, where there is a rapidly varying effective background, obtaining reliable photometry is difficult. We first subtract the background galaxy light by fitting 7th order polynomials to the background, excluding the cluster itself, within a 1111 pixel box centered on the point source. We then add a flat background that has the same mean as the fitted background to preserve the noise properties. Finally, we measure magnitudes within a 2 pixel radius. Because the uncertainties in the measured magnitudes and colors transfer directly to those in the derived ages, we estimate photometric errors using artificial cluster tests. We place one thousand model star clusters with known brightness into the relevant parts of the images and repeat our procedure. We find that if the model cluster is detected, the magnitude error due to the background subtraction is nearly insensitive to the underlying average sky value and depends mostly on the brightness of the cluster. Typically, the magnitude uncertainty is 0.25 mag down to = 26.5.
6.2. Luminosity Functions and Ages of the Star Clusters
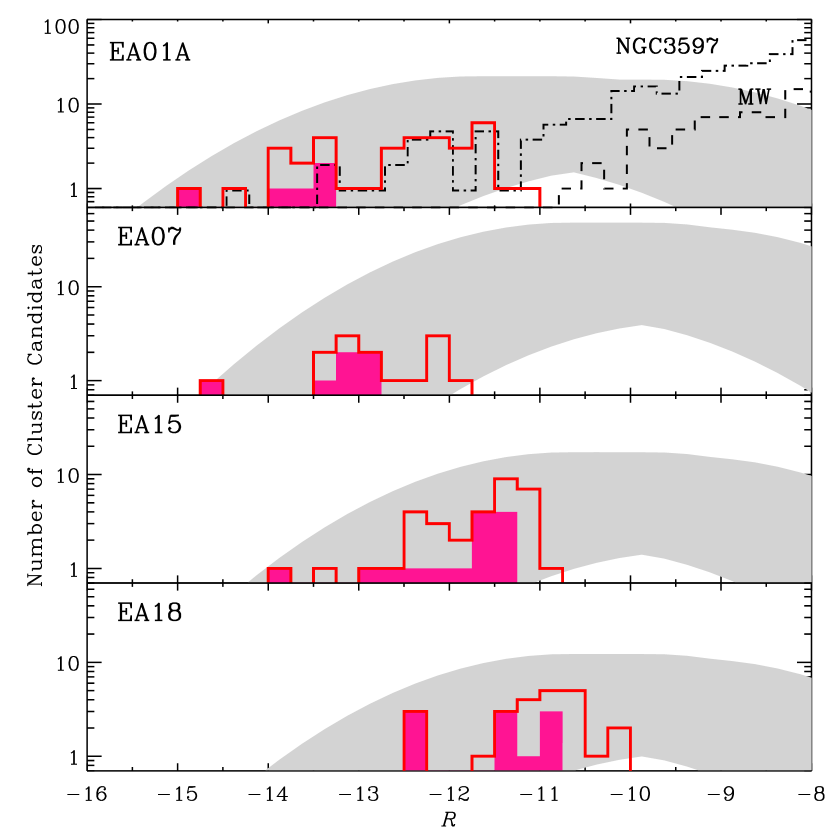
In Figure 16, we present the luminosity functions (LFs) of cluster candidates in the four E+As (EA01A, 07, 15, 18) that have more than five clusters with measurable colors ( 0.35 mag) within a 30 kpc radius444We adopt a 20 kpc radius for the random beam test to determine if cluster candidates exist, but we analyze all cluster candidates within a 30 kpc radius to include as many cluster candidates as possible.. The LFs of Milky Way globular clusters (Harris, 1996) and clusters in a merging galaxy (NGC 3597; Carlson et al., 1999) are also shown in the top panel for comparison. The thick solid lines and the shaded histograms represent all E+A cluster candidates within 30 kpc and only those with measured colors, respectively. The detected clusters in the four E+As are generally much brighter than Galactic globular clusters (), but consistent with the bright end of the NGC3597 cluster LF, suggesting that these compact point sources are a population of star clusters formed during the starburst.
More interesting is that the bright end of the LFs becomes fainter as the EA number increases, i.e., as the host E+A becomes redder. Furthermore, we are able to detect a cluster population more often in E+As with smaller EA number. We can reject with 90% confidence that the distribution of E+As with cluster populations (EA01A, 02, 03, 04, 07, 08, 11, 15, 18) is random. All nine of these E+As exhibit tidal features or disturbed morphologies (§A.1). These trends suggest that the newly-formed young star cluster systems fade or disrupt as the merger remnant ages and morphologically relaxes. If E+As evolve into E/S0s, we expect these cluster systems to become part of the globular cluster systems of E/S0s.
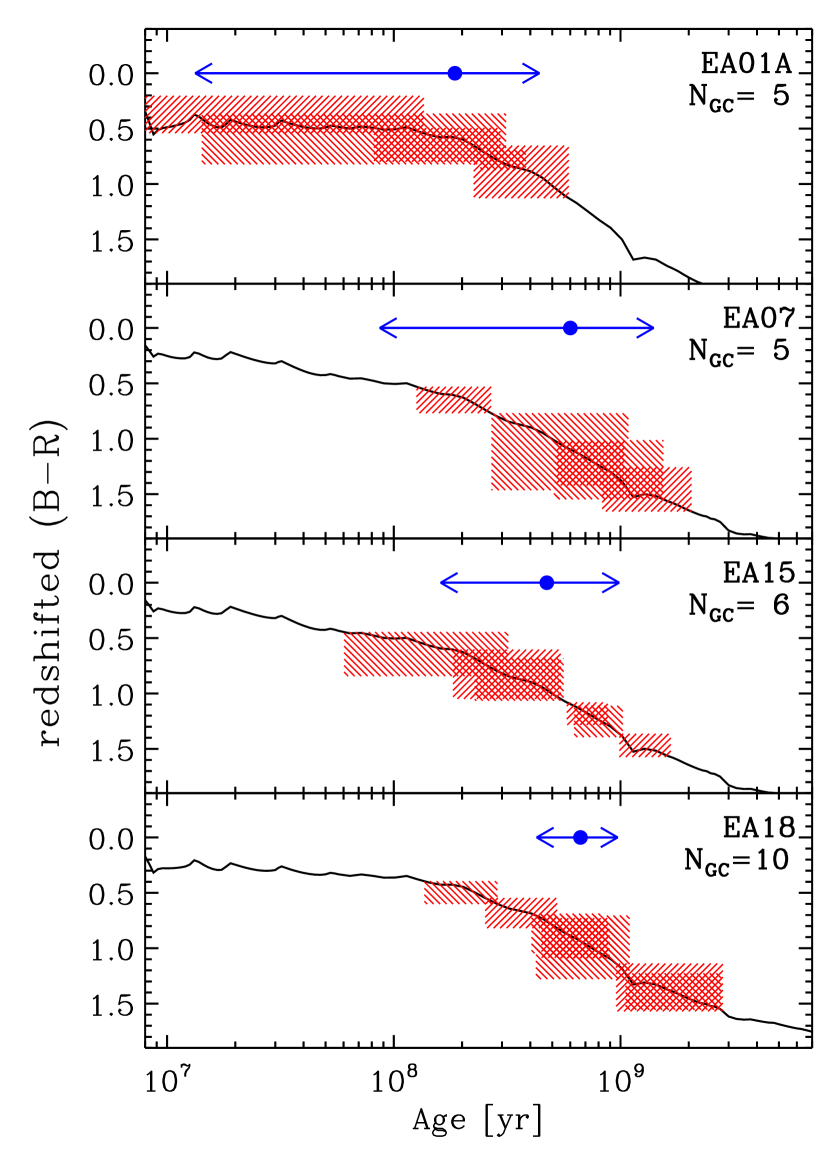
To pursue these suggestions, we determine the ages of individual clusters by comparing the cluster colors with predictions from stellar population synthesis models. In Figure 17, we show the () evolution for star clusters derived from a BC03 model and the colors of the star clusters found in three E+As (EA07, 15, 18). We also reproduce Figure 10 from Yang et al. (2004) for the clusters in EA01A for completeness. To avoid uncertainties in the K-correction and the magnitude transformation due to the unknown SED, we calculate the redshifted () color evolution using the spectra provided by the BC03 stellar synthesis model. We assume an instantaneous stellar population with a Salpeter initial mass function (IMF) over stellar masses ranging from 1 to 100 and solar metallicity. On the model tracks in Figure 17, we plot the observed cluster colors and the possible age ranges due to the photometric errors (shaded region). We include only clusters with color uncertainties less than 0.35 mag. The ages of individual clusters are consistent with what one expects from the E+A spectra: older than 10 Myr (the lack of emission lines associated with massive OB stars) but younger than Gyr (the presence of strong Balmer lines due to A stars).
To use the clusters to derive the time since the starburst, when the majority of the clusters and the young galactic stars formed, we apply a statistical test assuming that all star clusters formed during a single burst and therefore that their spread in observed color arises only from measurement errors. Details of the post-burst age estimation and statistical tests of the coeval assumption are described in Appendix B. We show the post-burst age inferred from the clusters as horizontal bars in Figure 17. EA01A, 07, 15, and 18 have post-burst age ranges of [10 Myr, 450 Myr], [100 Myr, 1.5 Gyr], [150 Myr, 1 Gyr], and [400 Myr, 1 Gyr], respectively, corresponding to the 95% confidence level. Note that it may be possible to break the long-standing degeneracy between the burst strength and the time elapsed since the starburst by using individual cluster ages, because these systems are much simpler than the composite population of the host galaxies. However, small number statistics and low S/N in the color measurements do not allow us to put tighter constraints on the post-burst ages at this time.
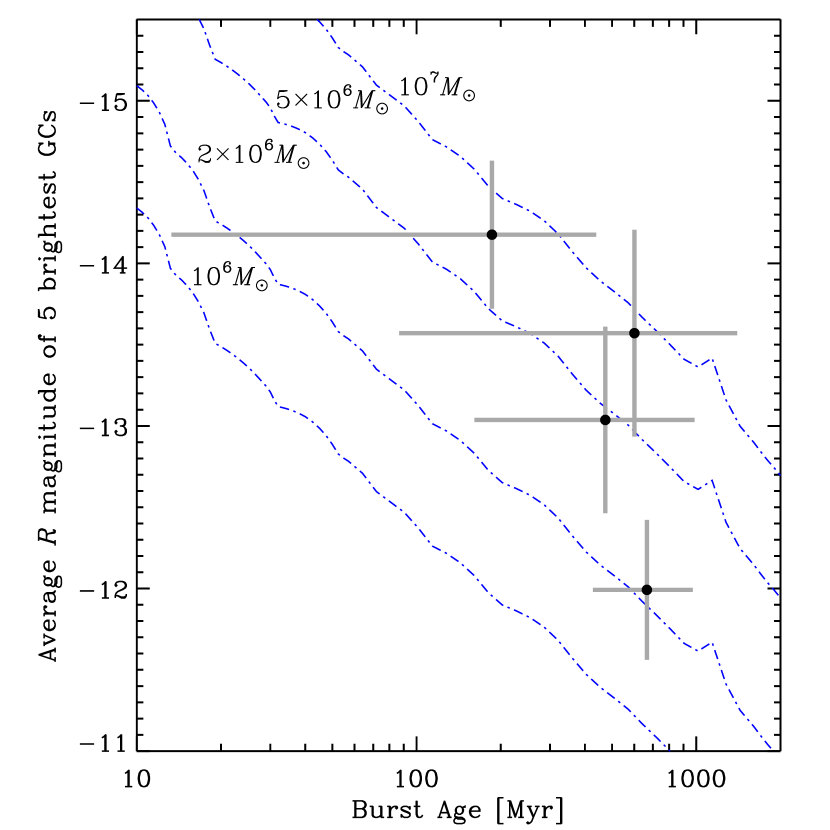
The evolution of the cluster LFs is consistent with the model predictions. While the uncertainties are fairly large, the derived post-burst ages are consistent with the E+A spectra and tend to increase with EA number, suggesting that the EA numbers are roughly consistent with a sequence of post-burst ages. In Figure 18, we show that the evolution of the bright magnitude limit of the cluster LF and the post-burst ages (derived from the cluster colors) are consistent with the fading of a uniform cluster mass function.
6.3. Evolution of the Cluster Population
The remaining question is whether these young cluster candidates can evolve into a significant part of the globular cluster systems of present-day E/S0s. Specifically, are the current numbers of clusters in E+As consistent with the globular cluster luminosity function (GCLFs) of E/S0s? It has been proposed that the metal-rich GCs in giant ellipticals formed during mergers of gas-rich spirals, producing the bimodality of the GC subpopulations (Ashman & Zepf, 1992). Indeed, many young GCs have been found in mergers (e.g., Whitmore et al., 1993), and Goudfrooij et al. (2004) demonstrated that the LF of intermediate-age (3 Gyr) GCs in NGC1316 can evolve dynamically into the red metal-rich cluster populations that are ubiquitous in E/S0s. Unfortunately, due to low S/N in the color measurements and the small number statistics of our cluster candidates, it is difficult to predict the evolution of the individual cluster systems in our sample. Instead, we “predict” the cluster LFs of E+As under the assumption that they are indeed the progenitors of the E/S0 cluster population.
First, we assume the following form of the GCLFs, i.e., the number of GCs per unit magnitude:
| (9) |
where is the total -band magnitude of the host galaxy, and are the turnover magnitude and the dispersion of the Gaussian function, is the specific frequency given by (Harris & van den Bergh, 1981), and is the fraction of metal-rich “red” clusters. Harris (2001) found that = , = mag in the -band and = for local elliptical galaxies ( ).
Second, to evolve this GCLF backward to the E+A epoch, we calculate the fading of the turnover magnitude between an age corresponding to the E+A clusters and that corresponding to E/S0 GCs, assuming that E/S0 GCs are 5 – 10 Gyr old. For solar metallicity and a Salpeter IMF, a BC03 model predicts 2 mag of fading between 1 Gyr and 10 Gyr. Note that these derived LFs will be lower limits because we consider only photometric evolution. For host galaxy luminosities, we adopt = , as measured from the scaling relationships.
The “predicted” GCLFs taking into account all possible errors mentioned above are consistent with the observed E+A cluster LFs (Figure 16). The most uncertain parameter is the age difference between the clusters in E+As and in E/S0s due to the fast luminosity evolution around 1 Gyr. We use ages of 100 – 500 Myr and 500 – 1000 Myr for EA01A and the other E+As, respectively. We vary between and . Most of our observed LFs fall within the uncertainties (shaded regions), indicating that the number of clusters observed does not violate the constraint derived from the GCLFs of the present-day E/S0s. While it is highly uncertain how many clusters in E+As will survive and how much they will contribute to the metal-rich GCs in E/S0s, we conclude that it is at least possible that young star clusters in E+As can evolve into the globular cluster systems of E/S0s.
7. Conclusions
We study the detailed morphologies of 21 E+A galaxies using high
resolution HST/ACS and WFPC2 images to investigate into
what E+A galaxies will evolve after their young stellar populations fade
away in a few Gyr. Our findings are:
1. The morphologies of E+As are extremely diverse, ranging across train-wrecks, barred galaxies, and blue-cores to relaxed disky galaxies. Most of these galaxies lie in the field, well outside of rich clusters, and at least 11 (55%) have tidal or other disturbed features. Our sample includes one binary E+A system, in which both E+As are tidally disturbed and interacting with each other. These results support the picture in which galaxy-galaxy tidal interactions or mergers are responsible for triggering the E+A phase in many cases.
2. E+As are bulge-dominated systems (median bulge fraction = 0.59) and their light is highly concentrated (Sérsic index ). When dust is negligible (at least 67% of the time), E+As have high concentration indices () consistent with those of spheroids, but considerably larger asymmetry indices () than ellipticals due to structures within a few that presumably arise from the starburst and/or recent merger. Thus E+As would be morphologically classified as early-type galaxies once these disturbances relax and the low surface brightness tidal features dissipate or fade.
3. The color morphologies of E+As are as diverse as their structural morphologies. A large fraction (70%) have positive color gradients (bluer toward center), indicating that their young stellar populations are more concentrated than their older populations. We demonstrate that evolution can invert these gradients into the negative gradients typical of E/S0s if the inner parts of E+As have become more metal enriched than the outer parts due to the centralized star formation.
4. Six E+As (30%) exhibit compact (0.4–1.4 kpc) blue cores, which might be the local analogs of the high- elliptical blue-cores (Menanteau et al., 2001). We discovered LINERs in three of these blue-core E+As (Yang et al., 2006), and the relationship between LINERs and blue-cores could be an important clue to what stops the star formation in E+A galaxies.
5. E+As stand apart from the E/S0 fundamental plane (FP) in the edge-on projection, implying that the stellar populations of E+As are different from that of E/S0s. E+As have, on average, a M/L that is 3.8 times smaller than that of E/S0s. The tilt of the E+A FP indicates that the variation of the stellar populations among E+As is closely tied to their structural parameters, i.e., E+As follow their own scaling relationships such that smaller or less massive galaxies have smaller M/L. Such a trend arises naturally within a merger scenario, where low mass galaxies (the progenitors of low-mass E+As) have higher gas fractions (Young & Scoville, 1991) and could produce relatively larger populations of young stars.
6. We find a population of unresolved compact sources in at least nine E+A galaxies (45%). The colors and luminosities of these young star cluster candidates are consistent with the ages inferred from the E+A spectra (0.01 – 1 Gyr). The bright end of the cluster luminosity function fades as the host galaxy becomes redder, suggesting that the newly-formed young star clusters age in parallel to their host. This interpretation is confirmed by the color evolution of the cluster systems.
We have now examined the full set of E+As from the Las Campanas Redshift Survey and so have representative results for local E+A galaxies. We have used high spatial resolution images to probe their detailed morphologies. We find that their properties are either consistent with those of E/S0s or, if left to evolve passively, will become like those of early-types. The morphologies, color profiles, scaling relations, and young star clusters suggest that E+As galaxies are caught in the act of transforming from late-type to early-type galaxies.
Facilities: HST(ACS,WFPC2)
References
- Abraham et al. (1994) Abraham, R. G., Valdes, F., Yee, H. K. C., & van den Bergh, S. 1994, ApJ, 432, 75
- Abraham et al. (1996) Abraham, R. G., Tanvir, N. R., Santiago, B. X., Ellis, R. S., Glazebrook, K., & van den Bergh, S. 1996, MNRAS, 279, L47
- Ashman & Zepf (1992) Ashman, K. M. & Zepf, S. E. 1992, ApJ, 384, 50
- Balogh et al. (2000) Balogh, M. L., Navarro, J. F., & Morris, S. L. 2000, ApJ, 540, 113
- Balogh et al. (2005) Balogh, M. L., Miller, C., Nichol, R., Zabludoff, A., & Goto, T. 2005, MNRAS, 360, 587
- Bartholomew et al. (2001) Bartholomew, L. J., Rose, J. A., Gaba, A. E., & Caldwell, N. 2001, AJ, 122, 2913
- Bekki et al. (2005) Bekki, K., Couch, W. J., Shioya, Y., & Vazdekis, A. 2005, MNRAS, 359, 949
- Bender et al. (1992) Bender, R., Burstein, D., & Faber, S. M. 1992, ApJ, 399, 462
- Bernardi et al. (2003) Bernardi, M., et al. 2003, AJ, 125, 1866
- Bershady et al. (2000) Bershady, M. A., Jangren, A., & Conselice, C. J. 2000, AJ, 119, 2645
- Bertin & Arnouts (1996) Bertin, E. & Arnouts, S. 1996, A&AS, 117, 393
- Blake et al. (2004) Blake, C., et al. 2004, MNRAS, 355, 713
- Blanton et al. (2003) Blanton, M. R., et al. 2003, ApJ, 594, 186
- Blanton et al. (2003) Blanton, M. R., et al. 2003, AJ, 125, 2348
- Brodie & Strader (2006) Brodie, J. P., & Strader, J. 2006, ARA&A, 44, 193
- Bruzual & Charlot (2003) Bruzual, G. & Charlot, S., MNRAS, 344, 1000
- Buyle et al. (2006) Buyle, P., Michielsen, D., De Rijcke, S., Pisano, D. J., Dejonghe, H., & Freeman, K. 2006, ArXiv Astrophysics e-prints, arXiv:astro-ph/0604563
- Caldwell et al. (1996) Caldwell, N., Rose, J. A., Franx, M., & Leonardo, A. J. 1996, AJ, 111, 78
- Caldwell et al. (1999) Caldwell, N., Rose, J. A., & Dendy, K. 1999, AJ, 117, 140
- Carlson et al. (1999) Carlson, M. N. et al. 1999, AJ, 117, 1700
- Chang et al. (2001) Chang, T., van Gorkom, J. H., Zabludoff, A. I., Zaritsky, D., & Mihos, J. C. 2001, AJ, 121, 1965
- Conselice et al. (2000) Conselice, C. J., Bershady, M. A., & Jangren, A. 2000, ApJ, 529, 886
- Couch & Sharples (1987) Couch, W. J. & Sharples, R. M. 1987, MNRAS, 229, 423
- Djorgovski & Davis (1987) Djorgovski, S., & Davis, M. 1987, ApJ, 313, 59
- Dressler (1987) Dressler, A. 1987, ApJ, 317, 1
- Dressler & Gunn (1983) Dressler, A. & Gunn, J. E. 1983, ApJ, 270, 7
- Faber & Jackson (1976) Faber, S. M., & Jackson, R. E. 1976, ApJ, 204, 668
- Ferrarese & Merritt (2000) Ferrarese, L., & Merritt, D. 2000, ApJ, 539, L9
- Franx (1993) Franx, M. 1993, ApJ, 407, L5
- Franx et al. (1989) Franx, M., Illingworth, G., & Heckman, T. 1989, AJ, 98, 538
- Frei et al. (1996) Frei, Z., Guhathakurta, P., Gunn, J. E., & Tyson, J. A. 1996, AJ, 111, 174
- Fukugita et al. (1995) Fukugita, M., Shimasaku, K., & Oshawa, T. 1995, PASP, 107, 945
- Galaz (2000) Galaz, G. 2000, AJ, 119, 2118
- Gebhardt et al. (2000) Gebhardt, K., et al. 2000, ApJ, 539, L13
- Goto (2004) Goto, T. 2004, A&A, 427, 125
- Goto (2005) Goto, T. 2005, MNRAS, 357, 937
- Goto et al. (2003) Goto, T., et al. 2003, PASJ, 55, 771
- Goudfrooij et al. (2004) Goudfrooij, P., Gilmore, D., Whitmore, B. C., & Schweizer, F. 2004, ApJ, 613, L121
- Graham (2002) Graham, A. W. 2002, MNRAS, 334, 859
- Graham et al. (2001) Graham, A. W., Erwin, P., Caon, N., & Trujillo, I. 2001, ApJ, 563, L11
- Gunn & Gott (1972) Gunn, J. E., & Gott, J. R. I. 1972, ApJ, 176, 1
- Hamabe & Kormendy (1987) Hamabe, M., & Kormendy, J. 1987, IAU Symp. 127: Structure and Dynamics of Elliptical Galaxies, 127, 379
- Harris (1996) Harris, W. E. 1996, AJ, 112, 1487
- Harris (2001) Harris, W. E. 2001, Saas-Fee Advanced Course 28: Star Clusters, 223
- Harris & van den Bergh (1981) Harris, W. E., & van den Bergh, S. 1981, AJ, 86, 1627
- Hogg et al. (2006) Hogg, D. W., Masjedi, M., Berlind, A. A., Blanton, M. R., Quintero, A. D., & Brinkmann, J. 2006, ApJ, 650, 763
- Jedrzejewski (1987) Jedrzejewski, R. I. 1987, MNRAS, 226, 747
- Jørgensen et al. (1996) Jørgensen, I., Franx, M., & Kjaergaard, P. 1996, MNRAS, 280, 167
- Kelson et al. (2000) Kelson, D. D., Illingworth, G. D., van Dokkum, P. G., & Franx, M. 2000, ApJ, 531, 137
- Kelson et al. (2000) Kelson, D. D., Illingworth, G. D., van Dokkum, P. G., & Franx, M. 2000, ApJ, 531, 184
- Kennicutt (1998) Kennicutt, R. C. 1998, ARA&A, 36, 189
- Kent (1985) Kent, S. M. 1985, ApJS, 59, 115
- Kobayashi (2004) Kobayashi, C. 2004, MNRAS, 347, 740
- Kormendy (1977) Kormendy, J. 1977, ApJ, 218, 333
- Lee et al. (2006) Lee, J. H., Lee, M. G., & Hwang, H. S. 2006, ApJ, 650, 148
- Lotz et al. (2004) Lotz, J. M., Primack, J., & Madau, P. 2004, AJ, 128, 163
- Lupton et al. (2004) Lupton, R., Blanton, M. R., Fekete, G., Hogg, D. W., O’Mullane, W., Szalay, A., & Wherry, N. 2004, PASP, 116, 133
- Menanteau et al. (2001) Menanteau, F., Abraham, R. G., & Ellis, R. S. 2001, MNRAS, 322, 1
- Menanteau et al. (2004) Menanteau, F., et al. 2004, ApJ, 612, 202
- Mihos & Hernquist (1994) Mihos, J. C., & Hernquist, L. 1994, ApJ, 425, L13
- Mihos & Hernquist (1994) Mihos, J. C., & Hernquist, L. 1994, ApJ, 427, 112
- Miller & Owen (2001) Miller, N. A. & Owen, F. N. 2001, ApJ, 554, L25
- Norton et al. (2001) Norton, S. A., Gebhardt, K., Zabludoff, A. I., & Zaritsky, D. 2001, ApJ, 557, 150
- Pahre et al. (1998) Pahre, M. A., Djorgovski, S. G., & de Carvalho, R. R. 1998, AJ, 116, 1591
- Peletier et al. (1990) Peletier, R. F., Davies, R. L., Illingworth, G. D., Davis, L. E., & Cawson, M. 1990, AJ, 100, 1091
- Peng et al. (2002) Peng, C. Y., Ho, L. C., Impey, C. D., & Rix, H. 2002, AJ, 124, 266
- Petrosian (1976) Petrosian, V. 1976, ApJ, 209, L1
- Poggianti et al. (1999) Poggianti, B. M., Smail, I., Dressler, A., Couch, W. J., Barger, A. J., Butcher, H., Ellis, R. S., & Oemler, A. J. 1999, ApJ, 518, 576
- Pracy et al. (2005) Pracy, M. B., Couch, W. J., Blake, C., Bekki, K., Harrison, C., Colless, M., Kuntschner, H., & de Propris, R. 2005, MNRAS, 359, 1421
- Quintero et al. (2004) Quintero, A. D., et al. 2004, ApJ, 602, 190
- Rix & Zaritsky (1995) Rix, H. & Zaritsky, D. 1995, ApJ, 447, 82
- Rose et al. (2001) Rose, J. A., Gaba, A. E., Caldwell, N., & Chaboyer, B. 2001, AJ, 121, 793
- Rothberg & Joseph (2006) Rothberg, B., & Joseph, R. D. 2006, AJ, 131, 185
- Schade et al. (1995) Schade, D., Lilly, S. J., Crampton, D., Hammer, F., Le Fevre, O., & Tresse, L. 1995, ApJ, 451, L1
- Schlegel et al. (1998) Schlegel, D. J., Finkbeiner, D. P., & Davis, M. 1998, ApJ, 500, 525
- Shectman et al. (1996) Shectman, S. A., Landy, S. D., Oemler, A., Tucker, D. L., Lin, H., Kirshner, R. P., & Schechter, P. L. 1996, ApJ, 470, 172
- Sirianni et al. (2005) Sirianni, M., et al. 2005, PASP, 117, 1049
- Smail et al. (1999) Smail, I., Morrison, G., Gray, M. E., Owen, F. N., Ivison, R. J., Kneib, J.-P., & Ellis, R. S. 1999, ApJ, 525, 609
- Tacconi et al. (2002) Tacconi, L. J., Genzel, R., Lutz, D., Rigopoulou, D., Baker, A. J., Iserlohe, C., & Tecza, M. 2002, ApJ, 580, 73
- Tamura et al. (2000) Tamura, N., Kobayashi, C., Arimoto, N., Kodama, T., & Ohta, K. 2000, AJ, 119, 2134
- Tran et al. (2003) Tran, K.-V. H., Franx, M., Illingworth, G., Kelson, D. D., & van Dokkum, P. 2003, ApJ, 599, 865
- Tran et al. (2004) Tran, K.-V. H., Franx, M., Illingworth, G. D., van Dokkum, P., Kelson, D. D., & Magee, D. 2004, ApJ, 609, 683
- Treu et al. (2005) Treu, T., et al. 2005, ApJ, 633, 174
- Treu et al. (2006) Treu, T., Koopmans, L. V., Bolton, A. S., Burles, S., & Moustakas, L. A. 2006, ApJ, 640, 662
- van Dokkum (2001) van Dokkum, P. G. 2001, PASP, 113, 1420
- van Dokkum & Ellis (2003) van Dokkum, P. G., & Ellis, R. S. 2003, ApJ, 592, L53
- Whitmore et al. (1993) Whitmore, B. C., Schweizer, F., Leitherer, C., Borne, K., & Robert, C. 1993, AJ, 106, 1354
- Whitmore & Schweizer (1995) Whitmore, B. C., & Schweizer, F. 1995, AJ, 109, 960
- Wise & Silva (1996) Wise, M. W., & Silva, D. R. 1996, ApJ, 461, 155
- Yagi et al. (2006) Yagi, M., Goto, T., & Hattori, T. 2006, ApJ, 642, 152
- Yamauchi et al. (2005) Yamauchi, C., & Goto, T. 2005, MNRAS, 359, 1557
- Yan et al. (2008) Yan, R., et al. 2008, ArXiv e-prints, 805, arXiv:0805.0004
- Yang et al. (2004) Yang, Y., Zabludoff, A. I., Zaritsky, D., Lauer, T. R., & Mihos, J. C. 2004, ApJ, 607, 258
- Yang et al. (2006) Yang, Y., Tremonti, C. A., Zabludoff, A. I., & Zaritsky, D. 2006, ApJ, 646, L33
- Yang et al. (2008) Yang, Y., Tremonti, C. A., Zabludoff, A. I., 2008, in preparation.
- Young & Scoville (1991) Young, J. S., & Scoville, N. Z. 1991, ARA&A, 29, 581
- Yun et al. (2001) Yun, M. S., Reddy, N. A., & Condon, J. J. 2001, ApJ, 554, 803
- Zabludoff et al. (1996) Zabludoff, A. I., Zaritsky, D., Lin, H., Tucker, D., Hashimoto, Y., Shectman, S. A., Oemler, A., & Kirshner, R. P. 1996, ApJ, 466, 104
- Zaritsky et al. (2006) Zaritsky, D., Gonzalez, A. H., & Zabludoff, A. I. 2006, ApJ, 638,725
| IDaaE+A IDs and redshifts from Zabludoff et al. (1996). | R.A. | Dec. | aaE+A IDs and redshifts from Zabludoff et al. (1996). | Scale | bbVelocity dispersion of the old stellar population from Norton et al. (2001). The entries with = 23 km s-1 are the upper limits. | H I mass | Morphology | |
|---|---|---|---|---|---|---|---|---|
| (J2000) | (J2000) | (kpc/″) | (km s-1) | ( yr-1) | (109 ) | |||
| EA01A | 11 01 19.05 | 12 10 17.8 | 0.07463 | 1.42 | ccSFR from H luminosity (Yang et al., 2006) using the relation, SFR ( yr = (Kennicutt, 1998). | ffH I mass from Chang et al. (2001). Corrected for the cosmological parameters adopted in this paper. | tidal-feature, companion, cluster | |
| EA01B | 11 01 18.39 | 12 10 14.1 | 0.07463 | 1.42 | ccSFR from H luminosity (Yang et al., 2006) using the relation, SFR ( yr = (Kennicutt, 1998). | tidal-feature, companion, LINER | ||
| EA02 | 02 17 39.88 | 44 32 47.2 | 0.09873 | 1.82 | ddSFR from the radio-continuum (Chang et al., 2001) using the relation, SFR ( yr = (W Hz-1) (Yun et al., 2001). Corrected for the cosmological parameters adopted in this paper. Note that we do not adopt the SFRs derived from the gas surface densities, which are highly uncertain. | ffH I mass from Chang et al. (2001). Corrected for the cosmological parameters adopted in this paper. | tidal-feature, dust?, cluster | |
| EA03 | 12 09 5.54 | 12 22 35.8 | 0.08109 | 1.53 | eeSFR from the radio-continuum (Miller & Owen, 2001). Same as footnote d. | ffH I mass from Chang et al. (2001). Corrected for the cosmological parameters adopted in this paper. | tidal-feature, cluster | |
| EA04 | 04 00 0.34 | 44 35 15.8 | 0.10122 | 1.86 | ddSFR from the radio-continuum (Chang et al., 2001) using the relation, SFR ( yr = (W Hz-1) (Yun et al., 2001). Corrected for the cosmological parameters adopted in this paper. Note that we do not adopt the SFRs derived from the gas surface densities, which are highly uncertain. | ffH I mass from Chang et al. (2001). Corrected for the cosmological parameters adopted in this paper. | disturbed, dust?, cluster | |
| EA05 | 01 58 1.52 | 44 37 14.0 | 0.11731 | 2.12 | bar, blue-core | |||
| EA06 | 11 53 55.59 | 03 10 36.3 | 0.08850 | 1.65 | ccSFR from H luminosity (Yang et al., 2006) using the relation, SFR ( yr = (Kennicutt, 1998). | dust, blue-core, LINER | ||
| EA07 | 22 41 9.75 | 38 34 34.9 | 0.11413 | 2.07 | tidal-feature, dust, cluster | |||
| EA08 | 14 32 3.23 | 12 57 33.1 | 0.11222 | 2.04 | eeSFR from the radio-continuum (Miller & Owen, 2001). Same as footnote d. | tidal-feature, cluster | ||
| EA09 | 01 17 38.28 | 41 34 24.6 | 0.06513 | 1.25 | eeSFR from the radio-continuum (Miller & Owen, 2001). Same as footnote d. | blue-core | ||
| EA10 | 02 11 42.96 | 44 07 40.2 | 0.10493 | 1.92 | tidal-feature, companion | |||
| EA11 | 01 14 49.65 | 41 22 31.8 | 0.12167 | 2.19 | ddSFR from the radio-continuum (Chang et al., 2001) using the relation, SFR ( yr = (W Hz-1) (Yun et al., 2001). Corrected for the cosmological parameters adopted in this paper. Note that we do not adopt the SFRs derived from the gas surface densities, which are highly uncertain. | ffH I mass from Chang et al. (2001). Corrected for the cosmological parameters adopted in this paper. | disturbed, companion, cluster | |
| EA12 | 12 05 59.79 | 02 54 32.4 | 0.09713 | 1.80 | eeSFR from the radio-continuum (Miller & Owen, 2001). Same as footnote d. | tidal-feature, companion, dust | ||
| EA13 | 11 19 52.44 | 12 52 39.6 | 0.09572 | 1.77 | eeSFR from the radio-continuum (Miller & Owen, 2001). Same as footnote d. | tidal-feature, companion, dust | ||
| EA14 | 13 57 1.68 | 12 26 48.2 | 0.07046 | 1.34 | eeSFR from the radio-continuum (Miller & Owen, 2001). Same as footnote d. | bar, blue-core | ||
| EA15 | 14 40 44.26 | 06 39 52.3 | 0.11381 | 2.07 | ccSFR from H luminosity (Yang et al., 2006) using the relation, SFR ( yr = (Kennicutt, 1998). | cluster | ||
| EA16 | 12 19 55.69 | 06 14 1.0 | 0.07642 | 1.45 | ccSFR from H luminosity (Yang et al., 2006) using the relation, SFR ( yr = (Kennicutt, 1998). | blue-core, LINER | ||
| EA17 | 10 13 52.40 | 02 55 47.2 | 0.06090 | 1.18 | ccSFR from H luminosity (Yang et al., 2006) using the relation, SFR ( yr = (Kennicutt, 1998). | ggH I mass from Buyle et al. (2006). | dust, blue-core, LINER | |
| EA18 | 00 22 46.79 | 41 33 35.8 | 0.05985 | 1.16 | eeSFR from the radio-continuum (Miller & Owen, 2001). Same as footnote d. | ggH I mass from Buyle et al. (2006). | disturbed, dust, cluster | |
| EA19 | 02 07 49.45 | 45 20 51.1 | 0.06400 | 1.23 | eeSFR from the radio-continuum (Miller & Owen, 2001). Same as footnote d. | ggH I mass from Buyle et al. (2006). | dust | |
| EA21 | 11 15 24.96 | 06 45 13.8 | 0.09944 | 1.84 | eeSFR from the radio-continuum (Miller & Owen, 2001). Same as footnote d. | bar |
| TCOL | SCOL | ||||
|---|---|---|---|---|---|
| 0.001 | 0.029 | 0.033 | |||
| 0.008 | 0.048 | 0.023 | |||
| 0.496 | 0.014 | 0.023 | |||
| 0.406 | 0.084 | 0.016 | |||
| 0.107 | 0.938 | 0.033 | |||
| 0.030 | 0.857 | 0.009 |
| ID | aaTypical errors for are . | ||||
|---|---|---|---|---|---|
| (arcsec) | |||||
| EA01A | 6.75 0.06 | 3.10 0.01 | 0.17 | 17.09 0.30 | 16.77 0.01 |
| EA01B | 1.28 0.02 | 4.28 0.02 | 0.08 | 17.44 0.02 | 16.03 0.01 |
| EA02 | 3.94 0.05 | 4.96 0.01 | 0.09 | 17.79 0.04 | 16.24 0.01 |
| EA03 | 2.35 0.06 | 5.07 0.02 | 0.07 | 16.76 0.05 | 15.35 0.01 |
| EA04 | 3.24 0.06 | 4.81 0.01 | 0.11 | 17.36 0.01 | 15.77 0.01 |
| EA05 | 1.31 0.18 | 4.54 0.17 | 0.05 | 18.65 0.02 | 16.99 0.06 |
| EA06 | 0.52 0.01 | 3.40 0.03 | 0.08 | 18.67 0.01 | 17.41 0.01 |
| EA07 | 6.93 0.07 | 3.94 0.01 | 0.15 | 16.91 0.01 | 15.30 0.01 |
| EA08 | 2.44 0.05 | 4.71 0.01 | 0.05 | 18.78 0.01 | 17.27 0.01 |
| EA09 | 2.56 0.08 | 4.47 0.01 | 0.11 | 19.01 0.01 | 17.55 0.01 |
| EA10 | 2.18 0.06 | 4.57 0.02 | 0.05 | 18.39 0.01 | 16.91 0.01 |
| EA11 | 1.94 0.11 | 4.90 0.04 | 0.07 | 18.79 0.02 | 17.22 0.01 |
| EA12 | 4.33 0.04 | 4.09 0.01 | 0.14 | 18.44 0.01 | 16.84 0.01 |
| EA13 | 6.45 0.13 | 4.74 0.01 | 0.27 | 17.62 0.01 | 16.00 0.01 |
| EA14 | 0.83 0.03 | 3.64 0.05 | 0.03 | 18.05 0.01 | 16.69 0.01 |
| EA15 | 1.67 0.05 | 4.45 0.02 | 0.04 | 19.02 0.01 | 17.50 0.01 |
| EA16 | 0.63 0.06 | 3.84 0.15 | 0.04 | 18.47 0.02 | 17.30 0.04 |
| EA17 | 2.84 0.05 | 5.04 0.01 | 0.08 | 18.58 0.01 | 17.16 0.01 |
| EA18 | 2.92 0.05 | 3.73 0.01 | 0.19 | 17.81 0.01 | 16.37 0.01 |
| EA19 | 4.43 0.03 | 2.95 0.01 | 0.10 | 18.06 0.01 | 16.66 0.01 |
| EA21 | 1.22 0.17 | 4.64 0.18 | 0.04 | 18.85 0.04 | 17.26 0.05 |
| -Law | Sérsic -Law | |||||||||||
|---|---|---|---|---|---|---|---|---|---|---|---|---|
| ID | aa Typical errors for and are 0.01. | aa Typical errors for and are 0.01. | aa Typical errors for and are 0.01. | aa Typical errors for and are 0.01. | ||||||||
| (kpc) | (mag arcsec-2) | () | (kpc) | (mag arcsec-2) | () | |||||||
| EA01B | 2.88 | 2.53 | ||||||||||
| EA02 | 1.51 | 1.43 | ||||||||||
| EA03 | 2.26 | 1.50 | ||||||||||
| EA04 | 1.42 | 1.31 | ||||||||||
| EA05 | 1.37 | 1.30 | ||||||||||
| EA06 | 0.70 | 0.69 | ||||||||||
| EA07 | 1.27 | 1.12 | ||||||||||
| EA08 | 0.99 | 0.85 | ||||||||||
| EA09 | 1.61 | 1.39 | ||||||||||
| EA10 | 0.83 | 0.75 | ||||||||||
| EA11 | 1.16 | 1.06 | ||||||||||
| EA12 | 1.29 | 1.22 | ||||||||||
| EA13 | 0.94 | 0.90 | ||||||||||
| EA14 | 1.68 | 1.58 | ||||||||||
| EA15 | 0.83 | 0.75 | ||||||||||
| EA16 | 1.25 | 0.84 | ||||||||||
| EA17 | 1.28 | 0.96 | ||||||||||
| EA18 | 1.66 | 1.42 | ||||||||||
| EA19 | 1.65 | 1.06 | ||||||||||
| EA21 | 1.28 | 1.04 | ||||||||||
Note. — EA01A is excluded because it is so irregular.
| -Bulge | Disk | |||||||||||
|---|---|---|---|---|---|---|---|---|---|---|---|---|
| ID | aaTypical errors for and are 0.01. | aaTypical errors for and are 0.01. | aaTypical errors for and are 0.01. | aaTypical errors for and are 0.01. | ||||||||
| (kpc) | (mag arcsec-2) | () | (kpc) | (mag arcsec-2) | () | |||||||
| EA01B | ||||||||||||
| EA03 | ||||||||||||
| EA04 | ||||||||||||
| EA05 | ||||||||||||
| EA06 | ||||||||||||
| EA07bbE+As with unreliable bulge-disk decompositions. | ||||||||||||
| EA08 | ||||||||||||
| EA09 | ||||||||||||
| EA10 | ||||||||||||
| EA11 | ||||||||||||
| EA12bbE+As with unreliable bulge-disk decompositions. | ||||||||||||
| EA13 | ||||||||||||
| EA14 | ||||||||||||
| EA15 | ||||||||||||
| EA16 | ||||||||||||
| EA17 | ||||||||||||
| EA18bbE+As with unreliable bulge-disk decompositions. | ||||||||||||
| EA21 | ||||||||||||
Note. — EA01A, EA02 and EA19 are excluded from the bulge-disk decomposition because the GALFIT program fit does not converge.
| ID | (mag dex-1) | (kpc) | (mag dex-1) | (mag dex-1) | Morphologyaa Morphology of the color profile: N(negative), P(positive), BC(blue-core), F(flat or variable), D(dust) |
|---|---|---|---|---|---|
| EA01B | P | ||||
| EA02 | N,D | ||||
| EA03 | P | ||||
| EA04 | N,D | ||||
| EA05 | P,BC | ||||
| EA06 | P,BC,D | ||||
| EA07 | N,D | ||||
| EA08 | P | ||||
| EA09 | P,BC | ||||
| EA10 | P | ||||
| EA11 | F | ||||
| EA12 | N,D | ||||
| EA13 | F,D | ||||
| EA14 | P,BC | ||||
| EA15 | P | ||||
| EA16 | P,BC | ||||
| EA17 | P,BC,D | ||||
| EA18 | F,D | ||||
| EA19 | N,D | ||||
| EA21 | F |
Note. — Because a single linear fit is not the best representation of most color profiles, the statistical uncertainties are always too small and unrealistic. Therefore, we calculate bootstrap uncertainties.
Appendix A Detailed Morphologies of E+A Galaxies
High resolution HST images enable us to identify a wealth of small and large scale features. For example, the low surface brightness tidal features, small companion galaxies, blue cores, bars, and even point-like, newly-formed star clusters are essential clues in understanding the causes and end-products of the E+A phase. In this appendix, we describe the qualitative morphologies of 21 E+A galaxies. Given that our E+A sample was selected using uniform spectroscopic criteria (large Balmer absorption and no [O II] emission), it is striking that the morphologies of E+A galaxies are so diverse.
A.1. Tidal Features and Disturbed Morphologies
Eight E+As (EA01AB, 02, 03, 07, 08, 10, 12, 13) show clear tidal features indicative of recent galaxy-galaxy interactions. These features include tidal tails that extend over a few tens of kpc and bridges that connect apparent companions. In addition to these dramatic large-scale tidal features, another three (EA04, 11, 18) exhibit disturbed morphologies such as shell-like structures (EA04 and EA11) and highly irregular isophotes (EA18). We conclude that the fraction of E+A galaxies with readily identifiable, i.e., brighter than our detection limit ( mag arcsec-2), merger/interaction signatures is ().
Since Zabludoff et al. (1996) first claimed galaxy-galaxy interactions/mergers as the main mechanism for E+A formation, other studies using larger samples of E+As have reached similar conclusions. For example, Blake et al. (2004) found that 13% of E+As selected from the 2dFGRS, using the same spectroscopic criteria as was done for the LCRS sample, show tidal features or disturbed morphologies. Goto (2005) found that 30% of his sample shows tidal features. The higher merger fraction that we report here is almost certainly due to the improved sensitivity and higher resolution of HST imaging rather than intrinsic differences among E+A samples. For example, the low surface brightness features seen in EA08 and the shell-like structure in EA04 would not be detected in typical ground-based imaging.
Do merger features correlate with increasing EA numbers (i.e., increasing ), which is likely to correlate with the mean stellar age of the galaxy? We find tidal features more often among E+As with smaller EA numbers. The distribution of EA numbers for E+As with tidal features is not random at the 90% confidence level. Because the duration of the E+A phase ( Gyr) is longer than the dynamical relaxation time of the merger, we expect this correlation if EA numbers constitute a rough age sequence.
A.2. Companion Galaxies
Among the 11 E+As with interaction/merger signatures, five (EA01AB, 10, 11, 12, 13) have companion galaxies within 30 kpc that appear to be interacting with the E+A. The EA01AB system is spectroscopically confirmed (Yang et al., 2006), but the others may only be projected companions. For example, EA15’s companion (R.A. = 14:40:45.2, DEC. = 06:39:53), which we also observed in our slit, is at a different redshift. The properties of the projected companion galaxies are as diverse as those of the E+As. They range from almost 1:3 mergers (EA01AB) to apparent 1:75 minor mergers (EA10) as judged from the relative band fluxes. Are the interactions with these companion galaxies responsible for the starburst in E+As that ended Gyr ago? If these apparent on-going interactions produce the E+A spectra, then there was a close interaction Gyr ago, and we are now witnessing a subsequent passage. Therefore, a wide range of merger configurations may cause the E+A phenomenon. Alternatively, another interaction/trigger produces the E+A spectra, and the current interactions are solely by chance. Larger surveys including redshift measurements of the companion galaxies will help to resolve this issue. Conversely, not all interactions lead to E+A’s. Yagi et al. (2006) present a spectroscopically confirmed interacting E+A system where one galaxy is an E+A, but the other has neither current star formation nor post-starburst signatures.
A.3. Dust Features
Seven E+As (EA06, 07, 12, 13, 17, 18, 19) show dust features, such as lanes and filamentary structures, in the two-color composites or the residual images. In the WFPC2 sample, we also suspect that EA02 and EA04 might have dust from their irregular residual images, but the shallow images prohibit us from confirming it. Signatures of dust, although typically fairly minor, are present in over a third (33–43%) of our E+As.
There have been suggestions that star-forming galaxies could be disguised as E+A galaxies due to obscuration by dust (Smail et al., 1999). However, this is not an issue for the E+As in this sample. As discussed in §4, only three E+As (EA07, 12, 19) have color profiles seriously affected by dust lanes []. Furthermore, radio continuum emission is detected from only two of the dusty E+As (EA12 and 19) with inferred star formation rates (SFR) of 5.9 and 2.2 yr-1, respectively (Miller & Owen, 2001). EA07 was not observed in the radio. We conclude that the contamination rate due to the E+A selection criteria adopted by Zabludoff et al. (1996), which employs the average Balmer line strength and [O II], is less than 15% (see also Blake et al., 2004; Goto, 2004).
A.4. Barred Galaxies
Only three E+As galaxies (EA05, 14, 21) exhibit clear signs of bars in
the residual images, while two other E+As (EA11 and EA19) have elongated
residuals that suggest the presence of a bar. Because there is no
model profile for the bar component, we fit these galaxies as well as
possible using the various model GALFIT components. Because introducing
too many free components makes it impossible to interpret the components
physically (Peng et al., 2002), we use only three-component models,
each with a combination of two Sérsic profiles and one exponential disk
profile. We show the best-fit model profiles in Figure 3
for the barred E+A galaxies. The bars appear to be fit reasonably well
with a steep () and flat () component.
Appendix B Post-Burst Age Determination
The ages of the young star cluster populations in E+A galaxies could be used to break the degeneracy between the burst strength and the time elapsed since the starburst, because a simple stellar population (SSP) is an excellent approximation for the star clusters and therefore no additional assumptions are required to model the underlying old stellar populations. To derive the time since the starburst (post-burst age), when the majority of the detected clusters and young stars formed, we use a statistical test and the simple assumption that all star clusters formed during a single burst. Therefore, we assume that their spread in colors is due entirely to color measurement errors. For each post-burst age, we draw a thousand sets of cluster colors, each scattered according to a Gaussian error distribution described by the measurement error , where is the number of cluster candidates found in each E+A. These simulated colors are compared to the distributions of observed colors. We determine the fraction of sets that are statistically indistinguishable from the observations using the two sample K-S test. If the fraction of acceptable sets is less than 5%, we reject that model age as the time since the starburst.
Next we test whether the key assumptions in determining the post-burst ages — 1) the Gaussian distribution of observed colors and 2) the single age cluster population — are statistically acceptable. First, we consider whether the assumption that the measured cluster colors are randomly distributed according to a Gaussian is realistic. Due to small number statistics in each galaxy, it is not possible to test this assumption for the clusters in each galaxy. Therefore, we apply the following test to all clusters discovered in the five E+As (EA07, 08, 11, 15, 18). For each E+A, we calculate the deviation of each cluster color from the median color of the sample in terms of its measurement error, , where and are the measured color of the cluster and the median color of clusters in the given E+A, and is the error in each cluster color including uncertainties in background subtraction. We examine the distribution of ’s. If the ’s follow a Gaussian distribution with zero mean and a standard deviation of unity, our assumption of Gaussian distributed errors can be justified. If not, e.g., if the ’s show a skewed or flat distribution, their measured colors could be seriously affected by the other factors. In Figure 19, we show the distribution of ’s. The histogram is marginally consistent with a Gaussian distribution with unit standard deviation (), therefore we conclude that there is no strong evidence against this assumption.
Second, we test the validity of the assumption that all of the detected star clusters formed during a single instantaneous burst. We generate a thousand sets of simulated cluster colors with an age spread of . Gaussian random errors with a dispersion corresponding to the measurement errors are added to the simulated colors. Now we calculate the ’s using these simulated sets of cluster colors and compare the width of the distribution with the observed value . If the observed is significantly different from the distribution of , then we reject the given . We find that 0.1 Gyr is rejected at the 95% confidence level. However, the small number statistics and low S/N of the color measurements do not allow us to constrain the upper limits of the burst durations. Therefore, the instantaneous burst assumption might not be strictly true, and the burst duration should be at least longer than 100 Myr. On the other hand, using an E+A galaxy sample selected from the Sloan Digital Sky Survey, Yang et al. (2008) show that the timescale over which star formation ends tends to be smaller than 200 Myr, and larger burst durations (several hundred Myr) would wipe out the correlations that we find among post-burst ages, global E+A colors (i.e., EA number), and the bright end of the star cluster luminosity function. Therefore, we argue that the single burst age approximation is valid to within a few hundred Myr.