GMASS Ultradeep Spectroscopy of Galaxies at . II. Superdense passive galaxies: how did they form and evolve ?††thanks: Based on the ESO VLT Large Program 173.A–0687
Abstract
Aims. The aim of this work is to investigate the physical, structural and evolutionary properties of old, passive galaxies at and to place new constraints on massive galaxy formation and evolution.
Methods. We combine ultradeep optical spectroscopy from the GMASS project (Galaxy Mass Assembly ultradeep Spectroscopic Survey) with GOODS multi-band (optical to mid–infrared) photometry and HST imaging to study a sample of spectroscopically identified passive galaxies at selected from Spitzer Space Selescope imaging at 4.5m.
Results. A stacked spectrum with an equivalent integration time of 500 hours was obtained and compared with libraries of synthetic stellar population spectra. The stacked spectrum is publicly released. The spectral and photometric SED properties indicate very weak or absent star formation, moderately old stellar ages of 1 Gyr (for solar metallicity) and stellar masses in the range of M⊙, thus implying that the major star formation and assembly processes for these galaxies occurred at . No X-ray emission was found neither from individual galaxies nor from a stacking analysis of the sample. Only one galaxy shows a marginal detection at 24m. These galaxies have morphologies that are predominantly compact and spheroidal. However, their sizes ( 1 kpc) are much smaller than those of spheroids in the present–day Universe. Their stellar mass surface densities are consequently higher by 1 dex if compared to spheroids at with the same mass. Their rest-frame -band surface brightness scales with the effective radius, but the offset with respect to the surface brightness of the local Kormendy relation is too large to be explained by simple passive evolution. At , a larger fraction of passive galaxies follows the size – mass relation. Superdense relics with 1 kpc are extremely rare at with respect to , and absent if kpc. Because of the similar sizes and mass densities, we suggest that the superdense passive galaxies at are the remnants of the powerful starbursts occurring in submillimeter–selected galaxies at . The results are compared with theoretical models and the main implications discussed in the framework of massive galaxy formation and evolution.
Key Words.:
Cosmology: observations– Galaxies: distances and redshifts – Galaxies: elliptical and lenticular, cD – Galaxies: evolution – Galaxies: formation – Galaxies: high-redshift1 Introduction
Deep surveys provide the observational constraints needed to understand galaxy formation and evolution. In particular, many studies have been focused on massive galaxies (i.e. stellar mass M⊙) as cosmological probes of the history of galaxy mass assembly. However, despite the remarkable success in finding and studying massive galaxies over a wide range of cosmic time, the global picture is far from being clear. Thanks to their simple and homogeneous properties (morphology, colors, passively evolving stellar populations, scaling relations) and being the most massive galaxies in the present-day Universe, early-type galaxies (ETGs) are crucial to investigate the cosmic history of massive galaxies (e.g. Renzini (2006) and references therein).
At , the most recent results seem now to agree in indicating that the majority of massive ETGs ( M⊙) were already in place at z 0.7-0.8, with a number density consistent with the one at z=0, whereas the evolution is more pronounced for the lower mass ETGs (e.g. Fontana et al. (2004); Yamada et al. (2005); Bundy et al. (2006); Cimatti et al. (2006); Borch et al. (2006); Scarlata et al. (2006); Brown et al. (2006); Bundy et al. (2007)). This mass–dependent evolutionary scenario, known as ”downsizing” (Cowie et al. (1996); Gavazzi & Scodeggio (1996)), was proposed to explain the galaxy star formation histories, i.e. with massive galaxies forming their stars earlier and faster than the low mass ones. Recent results suggest that the downsizing concept should extend also to the stellar mass assembly evolution itself, i.e. with massive galaxies assemblying their mass earlier (e.g. Cimatti et al. (2006); Bundy et al. (2006); Franceschini et al. (2006); Bundy et al. (2007); Perez-Gonzalez et al. (2007)), thus providing new and stringent constraints for the current models of galaxy formation (e.g. De Lucia et al. (2006)).
The above results trace the evolution of the number density, luminosity and mass, but do not explain what is the mechanism with which ETGs assemble their mass and shape their morphology. Dissipationless ETG–ETG major merging (also called ”dry” merging) has been advocated as an important mechanism to build up the masses of ETGs at (Bell et al. (2006); van Dokkum (2005)). However, this scenario seems difficult to be reconciled with the properties of the small-scale clustering of ETGs at (Masjedi et al. (2006, 2007)), and (for massive ETGs) with the weak evolution of the high–mass end of the stellar mass function (e.g. Cimatti et al. (2006); Bundy et al. (2006, 2007); Pozzetti et al. (2007)). An alternative process proposed recently to explain the assembly of ETGs is based on multiple, frequent minor mergers at moderate redshifts (Bournaud, Jog & Combes (2007)).
Several studies suggest that the critical redshift range where the strongest evolution and assembly took place is at (e.g. Fontana et al. (2004); Glazebrook et al. (2004); Abraham et al. (2007); Arnouts et al. (2007)). However, the picture at these redshifts is even more controversial than at , partly because of the observational difficulty to identify spectroscopically and study large samples of ETGs at . The few ETGs identified spectroscopically so far up to are very red (), dominated by passively evolving old stars with ages of 1-4 Gyr, have stellar masses typically , and are strongly clustered with 8–10 Mpc (Cimatti et al. (2004); Glazebrook et al. (2004); McCarthy et al. (2004); Daddi et al. 2005a ; Saracco et al. (2005); Kong et al. (2006); Kriek et al. (2006)). Daddi et al. (2005) were the first to realize that a large fraction of these ETGs have smaller sizes ( kpc) (see also Cassata et al. (2005)) and higher mass internal densities than present–day ETGs. This result was soon confirmed by other observations (Trujillo et al. (2006); Zirm et al. (2007); Longhetti et al. (2007); Toft et al. (2007); Trujillo et al. (2007)). However, it is still unclear how to explain such size – mass – density properties in the context of ETG evolution.
The existence of a substantial population of old, massive, passively evolving ETGs up to was not predicted in galaxy formation models available in 2004-2005, and opened the question on how it was possible to assemble such systems when the Universe was so young. A promising mechanism which can provide a better agreement with the observations seems to be the ”quenching” of the star formation at high redshifts with AGN ”feedback” (e.g. Granato et al. (2004); Menci et al. (2006)).
The stellar ages and masses of the passive ETGs at require precursors characterized by strong ( M⊙/yr) and short-lived (0.1-0.3 Gyr) starbursts occurring at . In addition, such precursors should also have a large clustering correlation length comparable to that of passive galaxies at lower redshifts () (e.g. Daddi et al. (2000); Firth et al. (2002); Kong et al. (2006); Farrah et al. (2006)), and compatible with that expected in the CDM models for galaxies located in massive dark matter halos and strongly biased environments. Examples of precursor candidates have been found amongst starburst galaxies selected at with a variety of techniques (e.g. , Daddi et al. 2004b ; submm/mm, Chapman et al. (2005); “Distant Red Galaxies”, Franx et al. (2003); optically-selected systems with high luminosity, Shapley et al. (2004); IRAC Extremely Red Objects, IEROs, Yan H. et al. (2004); HyperEROs, Totani et al. (2001), and ULIRGs at selected with Spitzer Space Telescope Berta et al. (2007)). Deep integral-field near-IR spectroscopy is being used to perform detailed studies of these precursor candidates in order to understand what are the main mechanisms capable to assemble massive galaxies with short timescales (e.g. Swinbank et al. (2006); Förster-Schreiber et al. (2006); Wright et al. (2007); Law et al. (2007)). To date, the most detailed case is represented by a –selected star-forming galaxy at which shows a massive rotating disk with high velocity dispersion which may become unstable and lead to the rapid formation of a massive spheroid (Genzel et al. (2006)).
In this paper, we exploit the combination of GMASS ultradeep spectroscopy, HST imaging and optical – to – mid-infrared photometry to study the global properties of a new sample of passive galaxies at in order to place new constraints on massive galaxy formation and evolution. This paper refers to other papers where more details can be found on the GMASS project (Kurk et al. 2007a in preparation), the large scale structure at (Kurk et al. 2007b in preparation), the photometric Spectral Energy Distribution (SED) fitting analysis (Pozzetti et al. 2007 in preparation) and the morphological analysis (Cassata et al. 2007 in preparation). We adopt km s-1 Mpc-1, and , give magnitudes in AB photometric system, and assume a Chabrier (2003) Initial Mass Function (IMF).
2 The GMASS sample
GMASS (“Galaxy Mass Assembly ultra-deep Spectroscopic Survey” 111http://www.arcetri.astro.it/cimatti/ gmass/gmass.html) is a project based on an ESO VLT Large Program (Kurk et al. 2007a).
The GMASS main scientific driver is to investigate the physical and evolutionary processes of galaxy mass assembly in the redshift range of , i.e. in the epoch when the crucial processes of massive galaxy formation took place. Photometric redshifts are not sufficient to fully address the above questions because they provide limited clues on the physical and evolutionary status of the observed galaxies. Spectroscopy is therefore essential to derive reliable spectroscopic redshifts, to perform detailed spectral and photometric SED fitting (with known spectroscopic redshift), and to characterize the nature and diversity of galaxies at .
The first step was to select a sample at m by using the GOODS-South public image taken at that wavelength with the Spitzer Space Telescope equipped with IRAC (Dickinson et al., in preparation). Firstly, we defined a region of arcmin2 (matching the field of view of FORS2) located within the GOODS-South field222http://www.stsci.edu/science/goods, and covering 80% of the Hubble Ultra Deep Field (HUDF) (Beckwith et al. (2006)). Secondly, the sample was selected by extracting all the sources present in that field and having (AB) (corresponging to a flux density 2.3 Jy). This selection provided 1094 objects belonging to what we call the GMASS sample, which is clearly a pure flux-limited sample. Extended simulations showed that at , the photometric completeness is 85% (M. Dickinson and G. Rodighiero, private communications).

The GMASS sample was then used to extract a sub-sample of target galaxies to be observed spectroscopically. To reach the GMASS scientific aims, spectroscopy was very deep in order to derive secure spectroscopic redshifts for the faintest galaxies and to obtain high–quality spectra for the brighter galaxies in order to allow detailed spectral studies. The GMASS optical multi–slit spectroscopy was done with the ESO VLT + FORS2 (MXU mode) and focused on galaxies pre-selected with a cut in photometric redshift of in order to concentrate the study on galaxies in the critical range of . In order to make the spectroscopy feasible, two cuts in the optical magnitudes were adopted: or for spectroscopy done in the blue (grism 300V) or in the red (grism 300I) respectively. The integration times were very long (up to 32 hours per spectroscopic mask), and the spectroscopy was optimized by obtaining spectra in the blue (4000–6000 Å, grism 300V) or in the red (6000–10000 Å, grism 300I) depending on the colors and photometric SEDs of the targets. For both grisms, the slit width was always 1 arcsec and the spectral resolution 600. Despite the faintness of the targets, GMASS spectroscopy provided an overall spectroscopic redshift success rate of about 85% for the targeted galaxies.
Overall, 50% of the GMASS flux-limited sample () has available spectroscopic redshifts if we combine our own spectroscopy with the literature redshifts (http://archive.eso.org/archive/adp/GOODS), whereas the other half has accurate photometric redshifts (see Kurk et al. 2007a).
In summary, the GMASS sample is a pure flux–limited sample selected with , and with spectroscopic (GMASS or literature) or photometric redshifts available for each object in the sample. The power and the novelty of the GMASS sample is the selection at 4.5m, which is crucial for two main reasons: (1) the peak of the stellar SEDs (m) is redshifted in the 4.5m band for , (2) it is sensitive to the rest-frame near-IR emission, i.e. to stellar mass, up to z3. For and a Chabrier IMF, the limiting stellar mass is log/M 9.8, 10.1, and 10.5 for , , and , respectively. This allows to properly investigate the galaxy mass assembly evolution within a wide range of masses.
3 Passive galaxies in the GMASS sample
3.1 Spectroscopic selection and properties
At each redshift, the oldest envelope of the galaxy population is a “fossil” tracer of past events of galaxy formation in a way complementary to the study of galaxies with ongoing star formation. ETGs can be used as ”fossil” probes as they are usually dominated by old, passively evolving stellar populations.
The rest-frame UV spectra of old and passive stellar populations have specific features different from those of younger or star-forming galaxies. The UV continuum is very red, characterized by prominent breaks at 2640 Å and 2900 Å and rich of metal absorptions (e.g. MgI2852, MgII2800, FeI and FeII lines) (e.g. Dunlop et al. (1996); Spinrad et al. (1997); Cimatti et al. (2004); Saracco et al. (2005); Daddi et al. 2005a ). The combination of the strongest breaks and absorptions at 2600–2900 Å produces the prominent MgUV feature (Daddi et al. 2005a ). The presence of this feature in a galaxy spectrum ensures that very little if any star formation has taken place over the last Gyr, and therefore the galaxy is in a passively evolving stage. This feature is also very important to measure the spectroscopic redshifts of this kind of galaxies using optical spectrographs, when for the more prominent features of ETGs such as the CaII H&K doublet and the Balmer/4000 Å breaks fall outside the optical spectral range.
Following this approach, the GMASS spectroscopic dataset was used to search for passively evolving galaxies at with the MgUV feature present in their spectra (Mignoli et al., in preparation). This was achieved by deriving a color index of the UV continuum of each GMASS galaxy with available spectrum and spectroscopic redshift , and searching for the red continuum spectra expected in the case of passive galaxies. This UV color was defined as :
where and are the mean spectral continuum flux densities within the rest-frame wavelength bins at 2700-3100 Å and 3100-3500 Å respectively. The continuum flux densities were measured in fixed rest-frame spectral ranges and adopting a sigma-clipping procedure which ensures that spikes due to bad sky subtraction and/or to cosmic rays residuals do not affect the measured values. The errors were then computed from the standard deviations.
Fig. 1 shows that a strong color segregation is present, with 13 galaxies at having significantly redder than the rest of the GMASS spectroscopic sample. These red galaxies have also a MgUV index in the range expected for passive galaxies (Daddi et al. 2005a ). The visual inspection of these 13 spectra confirmed their similarity with the spectra of LBDS 53w091 (see Fig. 1) (Dunlop et al. (1996); Spinrad et al. (1997)) and of old passive galaxies at taken from the K20 and GDDS surveys (Mignoli et al. (2005); Cimatti et al. (2004); McCarthy et al. (2004)). All the other GMASS spectra of galaxies at were visually inspected in order to check for other passive/red galaxies with spectra that may have missed by the UV color criterion, but no other cases were found. The question of how many other red/passive ETGs are present in the whole GMASS flux-limited sample (i.e. including also galaxies with only photometric redshifts) is beyond the scope of the present work and is being addressed in another paper (Cassata et al. 2007, in preparation).
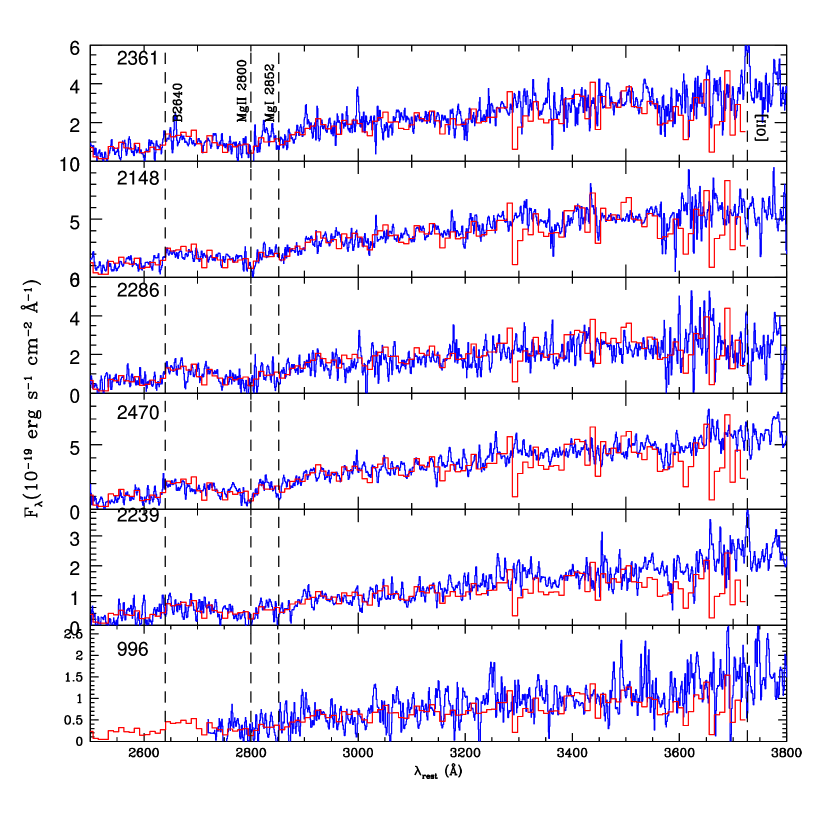
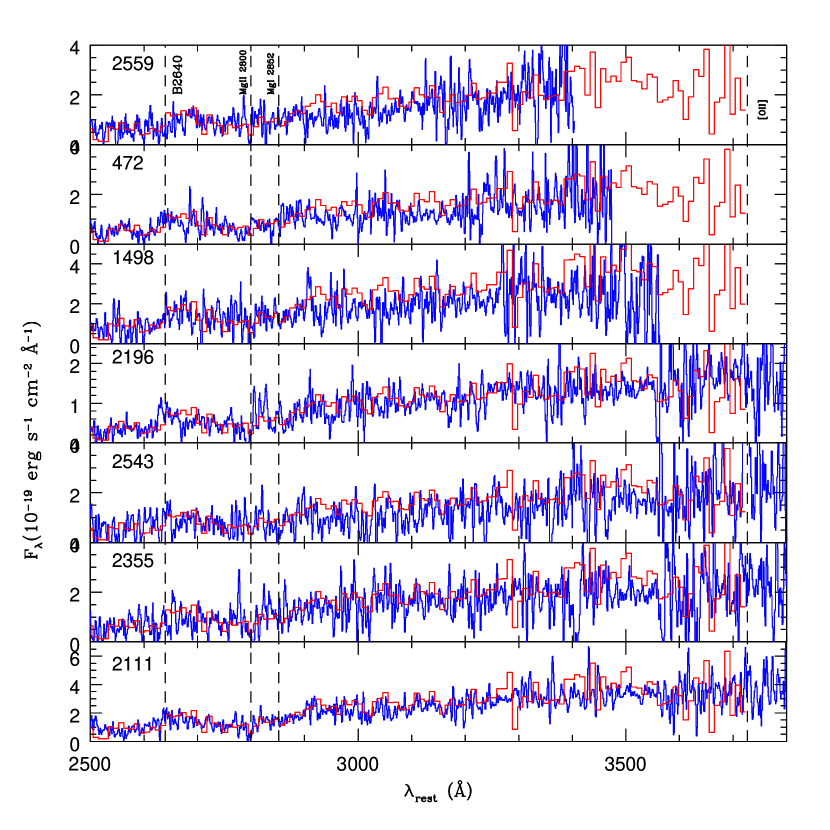
The spectra of the 13 selected galaxies are shown in Fig. 2 and some properties are listed in Table 1. Seven of these galaxies belong to a large scale structure at that is discussed in a companion paper (Kurk et al. 2007b). Ten spectra were obtained with an integration time of 30 hours each, whereas three (IDs 2111, 2239, 2559) were repeated in two independent masks and each of them accumulated an integration time of 60 hours. The two galaxies located within the HUDF (IDs 472 and 996) were also consistently identified by Daddi et al. (2005a) (their IDs 3650 and 8238 respectively) using HST+ACS slitless grism spectroscopy (GRAPES project; Pirzkal et al. 2004).
Six spectra show no signs of star formation due to the lack of [O II]3727 emission, four have weak [O II] emission, and for the three galaxies at (IDs 472, 1498, 2559) there is no information on [OII]3727 because the line falls outside the observed spectral range. Assuming that the [O II] emission line fluxes (Table 1) are not due to an AGN, and using the conversion from [OII]3727 luminosity and star formation rate (SFR) of Kennicutt (1998), we derive SFR 1–4 M⊙yr-1 for the four galaxies with [OII]3727 emission (see Table 1). If dust extinction is present, these SFRs are lower limits. However, the similarity of the spectra of these four galaxies with the spectra of galaxies without line emission suggests that the bulk of the stars is made by old stellar population and that the [OII]3727 emission is probably due to a minor episode of star formation (see also Section 5.2 on the specific star formation rate), or to weak nuclear activity.
| ID | Coordinates (J2000) | m4.5 | z | z | spec- | Fobs([O II]3727) | EWobs([OII]3727) | ||
|---|---|---|---|---|---|---|---|---|---|
| erg s-1 cm-2 Å-1 | Å | ||||||||
| 472 | 53.1588440 -27.7971249 | 21.04 | 25.29 | 21.72 | 3.25 | 2.57 | 1.921 | —- | —- |
| 996 | 53.1538162 -27.7745972 | 21.36 | 25.27 | 22.02 | 3.57 | 2.27 | 1.390 | ||
| 1498 | 53.1746445 -27.7533722 | 20.72 | 25.35 | 21.57 | 2.54 | 2.80 | 1.848 | —- | —- |
| 2111 | 53.1164055 -27.7126999 | 20.64 | 24.58 | 21.31 | 3.99 | 2.52 | 1.610 | ||
| 2148 | 53.1512375 -27.7137375 | 19.80 | 24.17 | 20.50 | 4.57 | 2.71 | 1.609 | ||
| 2196 | 53.1527710 -27.7162437 | 20.34 | 24.53 | 20.92 | 4.28 | 2.51 | 1.614 | ||
| 2239 | 53.1304817 -27.7211590 | 20.61 | 24.53 | 21.24 | 4.08 | 2.39 | 1.415 | 4.00.5 | 224 |
| 2286 | 53.1249580 -27.7229443 | 20.82 | 25.08 | 21.55 | 3.69 | 2.53 | 1.604 | 3.50.5 | 295 |
| 2355 | 53.0596466 -27.7258034 | 20.93 | 24.83 | 21.78 | 2.90 | 2.30 | 1.610 | ||
| 2361 | 53.1085548 -27.7101574 | 20.40 | 24.90 | 21.10 | 4.08 | 2.71 | 1.609 | 8.01.0 | 264 |
| 2470 | 53.1421547 -27.7112675 | 20.16 | 23.70 | 20.68 | 3.85 | 2.14 | 1.416 | ||
| 2543 | 53.1496468 -27.7113838 | 20.26 | 25.24 | 21.25 | 3.40 | 3.20 | 1.612 | 15.05.0 | 10040 |
| 2559 | 53.1764069 -27.7011585 | 20.71 | 24.84 | 21.60 | 3.37 | 2.81 | 1.981 | —- | —- |
While the presence of Type 1 AGN is excluded by the lack of broad emission lines (e.g. MgII2800), we cannot rule out the presence of hidden AGN activity. For instance, Yan et al. (2006) found that a large fraction of SDSS galaxies at with red rest-frame colors and emission lines display line ratios typical of various types of AGNs (LINERs, transition objects, and, more rarely, Seyferts) rather than of star-forming galaxies. In the case of our spectra, emission line ratio studies are not possible because the relevant lines fall outside the observed range. This implies that the above SFRs could be taken as upper limits. However, the lack of high ionization lines (e.g. [NeV]3426) makes the AGN hypothesis unlikely. The presence of hidden luminous AGNs is also excluded by the stacking analysis of the X-ray data (see Section 4). Therefore, we conclude that the [OII] emission in these 4 galaxies is likely due to a very low level of ongoing star formation.
In the present paper, we focus the analysis on these 13 galaxies for which ultradeep GMASS spectra are available. We only mention here that other passive galaxy candidates are present in the GMASS sample in the same redshift range. However, no spectroscopic redshifts are available for these candidates and their properties are based only on the similarity of their SED fitting parameters with those of the 13 spectroscopic passive galaxies discussed here (see Section 5.2). The detailed study of these candidates will be the subject of a forthcoming paper (Cassata et al. 2007 in preparation).
3.2 Analysis of the 480–hour stacked spectrum
The availability of deep individual spectra provides the opportunity to add them together and to obtain a stacked spectrum with unprecedented depth and suitable for a detailed analysis. We emphasize that the GMASS stacked spectrum of the 13 ETGs has an equivalent integration time of (1030h) + (360h) = 480 hours (1.73 Ms). The need for such extremely long integration times highlights the limits of the current generation of 8-10m telescopes in obtaining spectra of red passive galaxies with faint optical magnitudes down to 25–26. Moreover, near-infrared continuum and absorption line spectroscopy of this kind of galaxies with is beyond the current limits of 8-10m telescopes. Thus, these galaxies are ideal targets for the next generation of large telescopes on the ground (e.g. E-ELT, TMT) and in space (JWST).
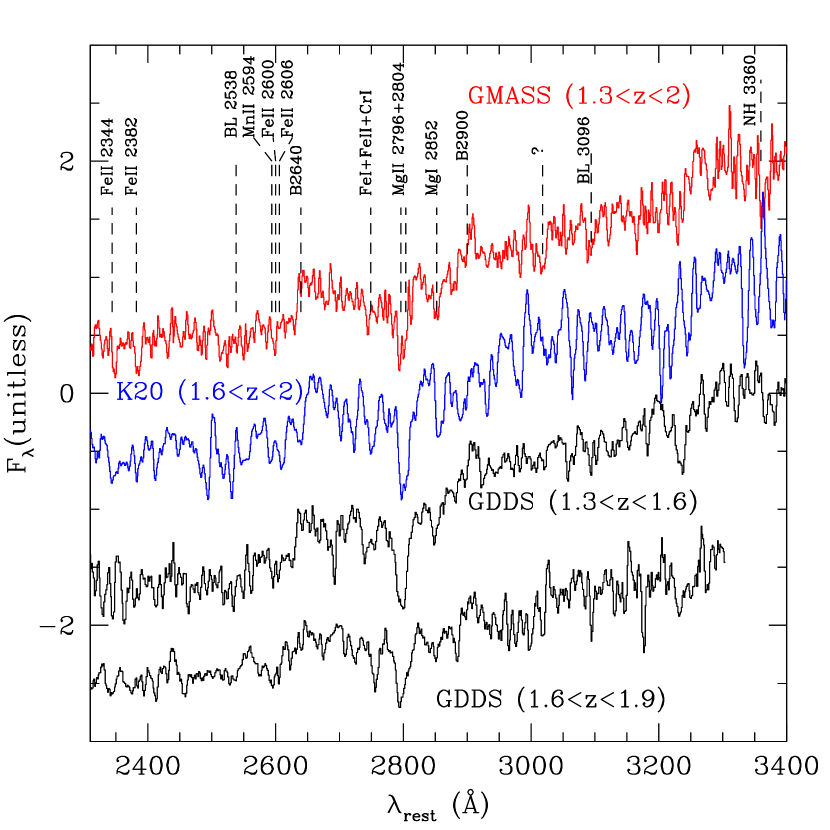
The stacked spectrum shown in Fig. 3–4 was obtained by averaging all the 13 individual spectra (average redshift ). In particular, each spectrum was blue-shifted to the rest-frame according to its redshift (with a 1.0 Å rest-frame bin) and normalized in the 2600-3100 Å wavelength range, which is always covered in the observed spectral window. In order to avoid any bias towards the brightest galaxies with the highest S/N ratio, the same weight was assigned to each individual spectrum. The main features present in the stacked spectrum are listed in Table 2. The stacked spectrum is publicly available at http://www. arcetri.astro.it/cimatti/gmass/gmass.html.
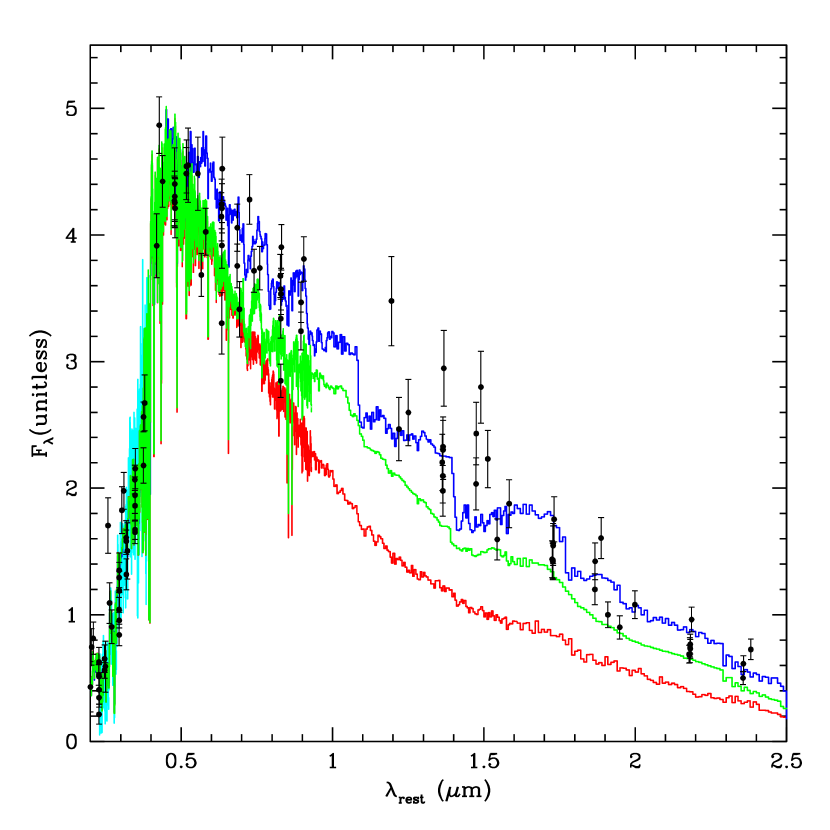
Fig 3 shows a comparison between the average spectrum of all 13 GMASS ETGs and those of K20 (Cimatti et al. (2004)) and GDDS (McCarthy et al. (2004)) samples. With the exception of the composite GDDS spectrum at 1.61.9 (slightly bluer and with less pronounced MgUV feature), the spectra are very similar to each other both in the strength of the Mg-UV feature and continuum slope.
| Feature | Value | Type | Reference |
|---|---|---|---|
| FeII 2344 | 4.50.3 Å | Equivalent Width | Ponder et al. 1998 |
| FeII 2382 | 6.00.4 Å | Equivalent Width | Ponder et al. 1998 |
| BL 2538 | 5.01.0 Å | Equivalent Width | Ponder et al. 1998 |
| B2640 | 1.590.06 | Continuum Break | Spinrad et al. 1997 |
| B2900 | 1.270.03 | Continuum Break | Spinrad et al. 1997 |
| MgII 2800 | 8.00.6 Å | Equivalent Width | Ponder et al. 1998 |
| MgI 2852 | 8.00.6 Å | Equivalent Width | Ponder et al. 1998 |
| BL 3096 | 2.50.5 Å | Equivalent Width | Ponder et al. 1998 |
| NH 3360 | 2.50.4 Å | Equivalent Width | Ponder et al. 1998 |
| MgUV | 1.400.1 | Continuum Break | Daddi et al. 2005 |
The observed average spectrum was compared to various libraries of synthetic spectra of simple stellar populations (SSPs) in order to attempt an estimate of the age of the stellar population dominating the rest-frame UV spectrum covered by our observations. In practice, limiting the analysis to this part of the spectrum provides an estimate of the time elapsed since the last major episode of star formation. As such, this estimate must be regarded as a lower limit to the age of the bulk of the stars in these galaxies. As a second step we included also the rest-frame near-IR, so as to have an estimate of the age of the bulk stellar populations in these galaxies (see Section 5.2).
For the fitting analysis, we adopted three libraries of synthetic spectra: Maraston (2005; M05) (Kroupa 2001 IMF), Bruzual & Charlot; BC03) (Chabrier IMF), and its update (Charlot & Bruzual 2007; CB07) (Chabrier IMF). The main difference among the three sets of models is in the treatment of the thermally pulsing asymptotic giant branch (TP-AGB) phase of stellar evolution, which for intermediate age SSPs can contribute up to % to the total bolometric light, radiated mostly in the near-IR (Renzini 1981; Maraston 1998, 2005; Maraston et al. 2006). In M05 models the TP-AGB contribution was calibrated using Magellanic Cloud globular clusters of various ages, whereas BC03 models had a negligibly small contribution of the TP-AGB at all ages (M05). With CB07 an attempt was made to obviate to this deficiency (Bruzual (2007)). We concentrate here on the analysis of the rest-frame UV spectrum alone, for which the TP-AGB contribution is irrelevant, postponing to Section 5.2 the inclusion of the whole photometric information on these galaxies, including the rest-frame near-IR.
The BC03 and CB07 models have a spectral resolution of 300 (i.e. 10 Å) for 3300 Å and 3 Å for 3300 Å, whereas the M05 spectra have 300 at all wavelengths. The observed stacked spectrum (resolution 600, i.e. 2 Å at 3000 Å, = 1.6) was rebinned to match the resolution of the model spectra.
The best fit age for each set of synthetic templates was derived through a minimization over the rest-frame wavelength range 2480–3560 Å that is covered completely by 11 out of the 13 spectra. The as a function of wavelength used in the procedure was estimated from the average spectrum computing a running mean within 20 Å and 10 Å for 3300 Å and 3300 Å respectively. All ages available in the model spectra libraries were used, and we initially adopted during the fitting.
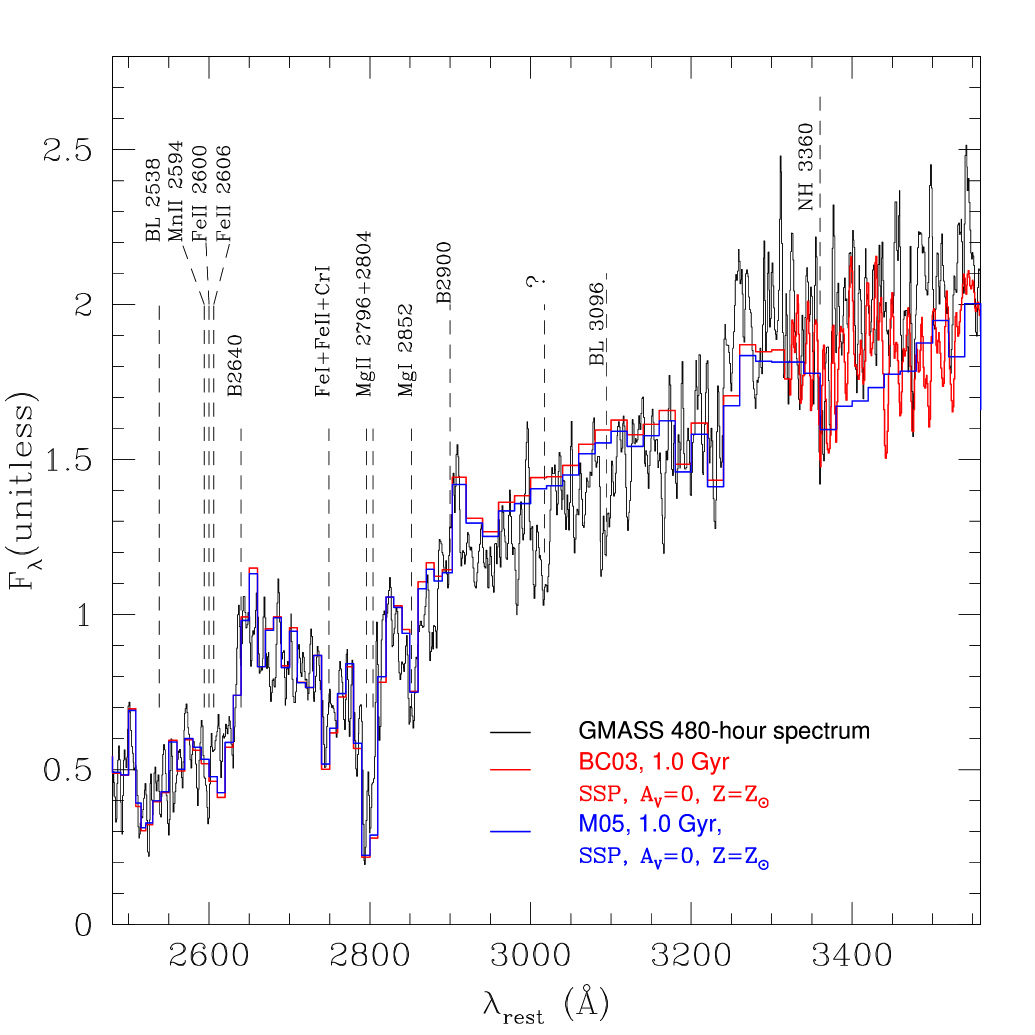
In the case of solar metallicity, the best fitting spectra have an age of 1.0 Gyr for all models (BC03, M05 and CB07) (Fig. 4), indicating the three sets of models are virtually equivalent in this wavelength range (BC03 and CB07 are actually identical, the only difference being at longer wavelengths).
In order to assess the relevance of the age–metallicity degeneracy, we explored how the estimated age changes as a function of metallicity with BC03/CB07 models. This was done by assuming no dust extinction (=0) and evaluating how the best-fitting age changes as a function of using six values of metallicity: =0.0004, 0.001, 0.004, 0.008, 0.019, 0.03. We found that the best-fit ages vary from 0.7 Gyr to 2.8 Gyr for 1.5–0.2 . Lower metallicities () are excluded because they never reproduce the observed spectrum. Although the results of the SED fitting (see Section 5.2) exclude the presence of substantial dust extinction (not surprisingly, as most of the sample galaxies show no or very weak star formation), we also studied the effects of including the dust attenuation in the fitting process. This was done by leaving the stellar age and the dust extinction () as free parameters for each fitting done with a fixed metallicity (with , with the same six metallicity values as above). The dust extinction was allowed to vary in the range of in order to be consistent with the results of the SED fitting of Section 5.2. Compared to the case with no dust extinction (=0), the best-fitting ages were found to slightly decrease to 0.6–2.3 Gyr for 1.5–0.2 . This excercise clearly showed that the dominant degeneracy is the one of age and metallicity, which become substantial when using the UV spectrum alone.
We note that in all cases, the oldest acceptable ages never exceed the age of the Universe (3.27 Gyr) at the redshift () of the most distant galaxy in the stacked spectrum. Fig. 4 shows the best-fitting model spectra (for ) and the observed stacked spectrum. However, Fig. 5 shows that the same model spectra which provide equally good fits in the rest–frame UV differ significantly at longer wavelengths (see also Maraston et al. (2006)). Fig. 5 shows also the ”stacked” photometric SED obtained by de–redshifting the multi–band photometry ( +3.6m, 4.5m, 5.8m, 8m) of each galaxy and normalizing it to the average flux of the three SSP spectra at m, a wavelength at which all the three model spectra are nearly identical. The photometry of ID 2543 was excluded because significantly redder from the SEDs of the other 12 galaxies at m. Fig. 5 shows that for the three different SSP spectra with a fixed age of 1 Gyr, the ”stacked” photometric SED is in better agreement with the M05 model (although the scatter in the photometry is significant). The same figure also clearly suggests that more stringent constraints on the stellar population content of the passive galaxies come from the photometric SED fitting analysis extended to the Spitzer Space Telescope IRAC bands. This is discussed in details in Section 5.2.
4 X-ray and 24m emission
In order to search for additional indicators of ”activity” due to hidden star formation and/or AGN, we explored whether the 13 passive galaxies were detected in the X-ray or 24 m data using the Chandra X-ray Observatory and the Spitzer Space Telescope + MIPS data publicly available for the GOODS-South/GMASS region.
X-ray data for a total exposure time of 1 Msec obtained with the Chandra observatory in the GOODS/CDFS field have been published and made publicly available by Giacconi et al. (2002, see also Alexander et al. 2003). The limiting flux of the X-ray data is erg cm-2 s-1 in the full band at 0.5–7 keV. We searched for individual emission from the 13 objects in the present sample by cross-correlating the IRAC positions of our targets with the positions of X-ray sources as catalogued by Giacconi et al. (2002) and Alexander et al. (2003). We found that none of the 13 sources was individually detected in the X-rays. In order to constrain the average X-ray properties of our sample galaxies, we used the “stacking technique” following Brusa et al. (2002). For the photometry, a circular aperture with a radius of centered at the positions of our sources was adopted. The counts were stacked in the standard soft, hard and full bands (0.5-2 keV, 2-7 keV, and 0.5-7 keV) for a total effective exposure time of 11 Ms. Extensive Monte Carlo simulations (up to 10,000 trials) have been carried out by shuffling 13 random positions and using the same photometry aperture (2 arcsec). The random positions were chosen to lie in “local background regions” to reproduce the actual background as close as possible. In none of the bands (full, hard, soft), a signal has been significantly detected. The background counts at 0.5-2 keV imply a count rate of counts s-1 and a flux erg cm-2 s-1 assuming an unobscured power-law spectrum. This implies upper limits on the rest-frame luminosity of erg s-1 at 0.5-2 keV. These limits imply that a luminous AGN source ( erg/s) is absent in the passive galaxies of our sample or is very heavily obscured.
Around 1, about 20% of the morphologically–selected ETGs show some level of “hidden” activity revealed through the mid-IR emission at 24m (Rodighiero et al. (2007)). Mid-infrared emission was searched using the public data available for GOODS-South obtained with Spitzer + MIPS at 24 m with an integration time of about 10 hours per sky pixel. The photometry was based on a PSF fitting algorithm, where the SExtractor (Bertin & Arnouts (1997)) positions of the IRAC sources were used as input to the MIPS source extraction process (Chary et al. in preparation; see also Daddi et al. 2007a ; Daddi et al. 2007b for more details). None of the 13 galaxies is a strong MIPS source. The fluxes of 12 galaxies are not significant () and 20 Jy. The only exception is object ID 2543 which has a possible detection at 4.7 significance level with a flux Jy. We recall that ID 2543 is also the galaxy with the strongest [OII]3727 emission. If the 24m emission is real and due to star formation activity, and extrapolating from the 24m measurements using the spectral templates of Chary & Elbaz (2001) (see for instance Daddi et al. 2007a ; Daddi et al. 2007b , the implied infrared (bolometric) luminosity is L⊙. If we convert this luminosity into a SFR using the recipe of Kennicutt (1998), we obtain 24 M⊙ yr-1, higher than the estimate based on [OII]3727 luminosity (4 M⊙ yr-1) or SED fitting (12 M⊙ yr-1 with BC03 models).
5 Photometric properties and SED fitting
5.1 Colors
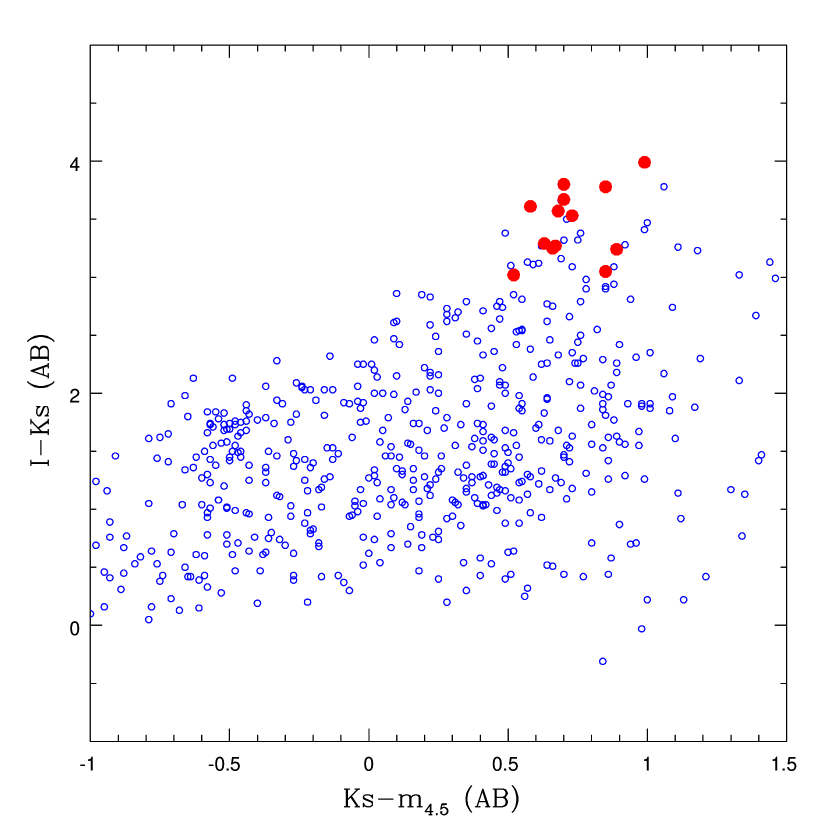
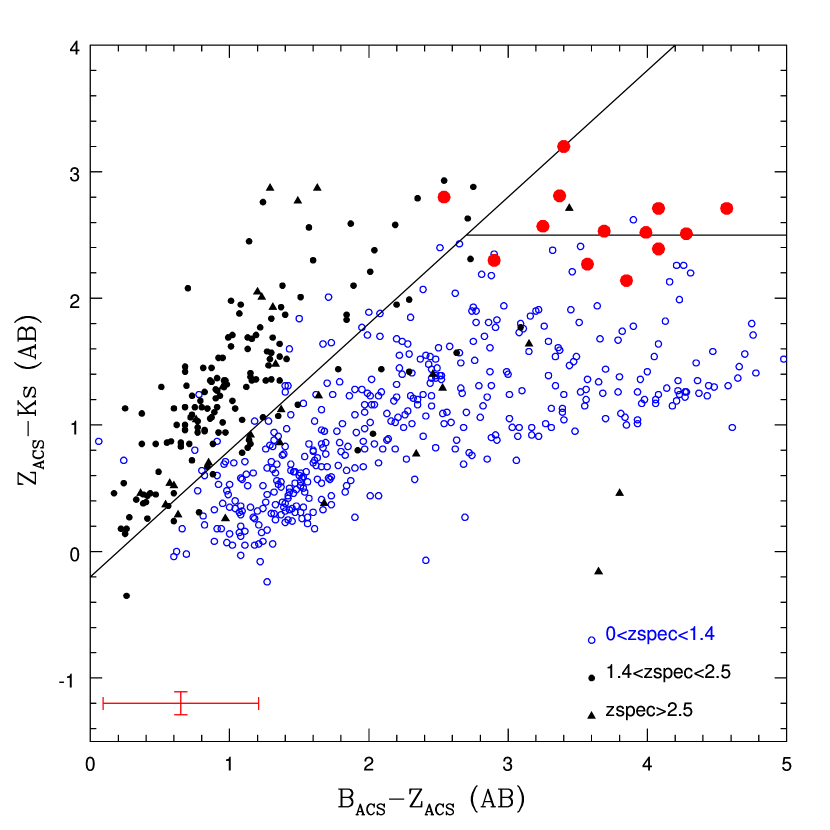
The location of the selected galaxies in the vs. two-color plot is displayed in Fig. 6, showning that these passive galaxies are among the reddest in both colors if compared to the GMASS galaxies with spectroscopic redshifts. In particular, their colors are all broadly consistent with the ones expected for passively evolving galaxies in the diagram (Fig. 7) (Daddi et al. 2004b ), especially when allowance is made for photometric errors. Note instead that these galaxies do not qualify as “Distant Red Galaxies” (DRGs, Franx et al. (2003)), because they are all at , whereas the DRG selection criterion ( or in Vega or AB system) is designed to select passive galaxies at . Indeed, the colors of our passive galaxies are all consistently (actually, ).
5.2 SED fitting
As discussed in Section 3.2 and in previous studies (e.g. Cotter et al. (2006); Maraston et al. (2006)), the rest-frame UV spectra are only sensitive to the most recent star formation events, whereas including in the analysis all the available photometric bands extending to the rest-frame near-IR should allow us to gather information also on the previous star formation history (SFH).
The photometric SED was derived for each of the 13 ETGs using the public images available in the GOODS-South field including 11 bands: optical (HST+ACS, ; Giavalisco et al. (2004)), near-infrared (ESO VLT+ISAAC, ) and mid-infrared (Spitzer+IRAC, 3.6m, 4.5m, 5.8m, 8m, Dickinson et al. in preparation).
We have used the synthetic spectra of M05 (Kroupa IMF) and BC03/CB07 (Chabrier IMF), adopting exponentially declining star formation histories with 0.1, 0.3, 1, 2, 3, 5, 10, 15, and 30 Gyr, plus the case of constant star formation rate. For each value of , a set of synthetic SEDs is pre-calculated for ages (since the beginning of the model at ) of 0.1, …, 12 Gyr, in steps of 0.1, Gyr, and only -models with ages less than the age of the Universe at the redshift of each galaxy are retained in the best-fit procedure. Extinction has been treated as a free parameter in the optimization, having adopted the extinction curve of Calzetti et al. (2000). We have adopted solar metallicity for all the models. The fitting procedure selects the template spectrum that minimizes the , and therefore gives a value for each of four parameters: the “age” of the best-fitting model, the -folding time of the SFR , the extinction , and the stellar mass. This latter quantity comes from the absolute normalization of the SED, once the best-fitting model has been chosen as the one providing the closest SED shape to the observed SED.
We caution that an exponentially declining SFR is certainly a convenient mathematical assumption, but the actual star formation history may be significantly different. At least for models with small values, the “age” given by the best-fitting procedure must be interpreted as the age of the bulk stellar population of a galaxy. Of course, real galaxies are likely to contain also stars significantly older than the “age” derived in this way. On the other hand, the best fit “age” derived from just the rest-frame UV spectrum (as in Section 3.2) corresponds to the age of the last significant episode of star formation.
During the fitting, only the observed bands corresponding up to the rest-frame -band (m) were used in order to avoid any dust emission contamination. The redshifts are taken from the GMASS spectroscopy and are not free parameters, hence largely reducing the SED fitting degeneracies often occurring when also the (photometric) redshift is a free parameter. The absence of luminous AGN sources as inferred from the X-ray and 24 m data (see previous Section) implies that the observed flux measured from the sample galaxies is dominated by stellar radiation. We have also explored the effect of assuming other than solar metallicities, from sub-solar to super-solar. This was attempted only using the CB03/BC07 models, but the best fit was always achieved for solar metallicity. Table 3 shows the main results of SED fitting in the case of solar metallicity.
5.2.1 The Stellar Masses and Their Uncertainties
The procedure adopted here for measuring the stellar masses is basically the same as that generally followed in the literature (e.g. Fontana et al. 2004, 2006; Longhetti et al. 2005; Bundy et al. 2005, 2006; Pozzetti et al. 2007; Trujillo et al. 2007). While the details of our procedure are extensively discussed in Pozzetti et al. (2007), we recall here a few points. The internal accuracy of the measured stellar masses is dex, as derived from the width of the probability distributions in the fitting procedure. In addition to this typical internal error, systematic errors should also be mentioned. A first source of systematics is the choice of the IMF, which is not a free parameter in our procedure, but must be adopted a priori. Stellar masses derived assuming the Kroupa IMF are systematically higher by 0.04 dex than those derived assuming the Chabrier IMF, and this difference was subtracted from the masses derived with Maraston (2005) models (using Kroupa IMF), in order to allow a homogeneous comparison with the masses derived using the Bruzual & Charlot (2003) and the Charlot & Bruzual (2007) models. The use of a straight, single-slope Salpeter IMF would result in masses about 70% higher. Another source of uncertainty is the assumption made on the star formation history. For instance, detailed simulations (e.g. Fontana et al. (2004); Pozzetti et al. (2007)) showed that in the case of an underlying exponentially declining SFH with ) plus random bursts of star formation superimposed on it, the estimated stellar masses become higher by 30-40%. Finally, as mentioned above the stellar population models differ in their treatment of the TP-AGB phase of evolution, which is particularly important for stellar populations in the age range Gyr, and most of the galaxies in the present study fall in this range of ages. As already pointed out by Maraston et al. (2006) and Wuyts et al. (2007), BC03 models give stellar masses that are systematically larger by 40–60% than those estimated with M05 models (see Fig. 8). This is most likely due to the best fitting algorithm boosting the mass in order to compensate for the lacking TP-AGB contribution in the BC03 models. The stellar masses from CB07 and M05 models are instead in fairly good agreement. It is important to remind that similar uncertainties on photometric stellar masses are also present in the SED fitting of low- SDSS galaxies (see Kauffmann et al. (2003)). However, we also recall that the stellar masses are generally in good agreement with the dynamical masses, especially for early-type galaxies (see e.g. Drory et al. (2004); di Serego Alighieri et al. (2005); Rettura et al. (2006)).
The stellar masses (and luminosities) of our sample galaxies span a rather wide range of values, from very massive and luminous (like the high- ETGs discussed in Cimatti et al. (2004); McCarthy et al. (2004)), to a regime of lower luminosity and stellar masses that was possible to reach thanks to the deep GMASS spectroscopy (-20.4-22.5, log(/M11).)
5.2.2 The Age of the Dominant Stellar Population
In the case of M05 models the ages of the dominant stellar populations are remarkably homogeneous around Gyr, with a small scatter of Gyr (Tab. 3). The best fit is always achieved with the smallest -folding time, i.e., Gyr. Being for these galaxies, this age estimate implies that the bulk of the stellar populations should have formed at . The same procedure applied to BC03 and CB07 models gives a somewhat older average age, Gyr, implying a peak formation redshift . However, in this case there appears to be a much larger age dispersion ( Gyr), with some ages being as high as Gyr, corresponding to a peak formation redshift . In general, for these older galaxies the -folding time indicated by CB07 models is longer, and the stellar mass somewhat higher than indicated by M05 models. This discrepancy suggests that the two sets of models are still appreciably different, most likely in the way the TP-AGB phase is implemented, as it is clearly shown in Fig. 5.
We note that for all galaxies when using M05 models, and for most using the CB07 ones, the SED ages derived in this section are very much consistent with that derived solely from the rest-frame, stacked UV spectrum in Section 3, i.e. Gyr. We interpret this agreement as an additional indication that most of the star formation activity was confined within a short time interval, short compared to the typical age ( Gyr) of the stellar populations. In this respect, we also note that in spite of models having been widely used in the literature, nature may have proceeded differently: rather then starting abruptly at its maximum intensity and then declining exponentially, star formation is likely to have started at low level at very high redshift, then increasing exponentially as mass is accumulated with (Daddi et al. 2007a), and finally suddenly truncated by feedback effects. If so, an inverted model would be more appropriate.
We can conclude that, by and large, our analysis indicates that the bulk of stars in these passively evolving galaxies must have formed at , a result in excellent agreement with the evidence for ETGs from to (as extensively reviewed in Renzini 2006), as well as for other ETGs (Cimatti et al. (2004); McCarthy et al. (2004); Daddi et al. 2005a ; Saracco et al. (2005); Longhetti et al. (2005); Kriek et al. (2006)).
5.2.3 Extinction and Star Formation Rates
By giving an age and an -folding time, the best fitting procedure automatically implies an ongoing SFR for each galaxy. Note however that the procedure is not specifically optimized to estimate this quantity, and therefore the results should be regarded only as rough estimates or upper limits. Nevertheless, these implied SFRs are typically very low, especially in the case of M05 models, as indeed expected for passive galaxies. For two galaxies (ID 1498 and 2543) BC03/CB07 models give substantially higher SFRs than for all other galaxies, and one of them (ID 2543) is the one with the strongest [OII]3727 flux and the only one marginally detected at 24m.
Even assuming the SFRs in Table 3 at face value, the implied specific star formation rates are very low (i.e. star formation rate per unit mass, SSFR = SFR/), as shown in Fig. 10. These SSFRs are typical of the lower envelope of the SSFR distribution at characteristic of the general population of the oldest galaxies with just residual, if any star formation (Feulner et al. (2005); Juneau et al. (2005); Kriek et al. (2006)), This implies that our sample galaxies cannot increase their stellar mass significantly at the current rate of star formation. For instance, they cannot double their mass from the look-back time of their redshifts to the present day. The inverse of the SSFR represents the characteristic secular timescale of the stellar mass growth. For our sample galaxies, these timescales are in the range of 30-104 Gyr.
The dust extinction inferred from the SED fitting analysis is generally very low (with some exceptions with BC03 model fitting). By forcing the results of the SED fitting do not change substantially: the median age increases by a factor of 2 for BC03 and 25% for both M05 and CB07, slightly increases by 20% and 5% for BC03 and CB07 respectively, whereas no significant changes occur for the stellar masses (5% for BC03 and % for M05 and CB07). The test with indicate that the results of the SED fitting are stable (especially for M05 and CB07 models) and that the major source of uncertainty remains the choice of the synthetic spectra library.

The properties inferred with SED fitting are in broad agreement with the characteristics of the UV spectra, as shown in Fig. 9 where the stacked spectrum of the passive galaxies is compared with the three synthetic spectral templates corresponding to the average best fit results of the photometric SED fitting (see Table 3).
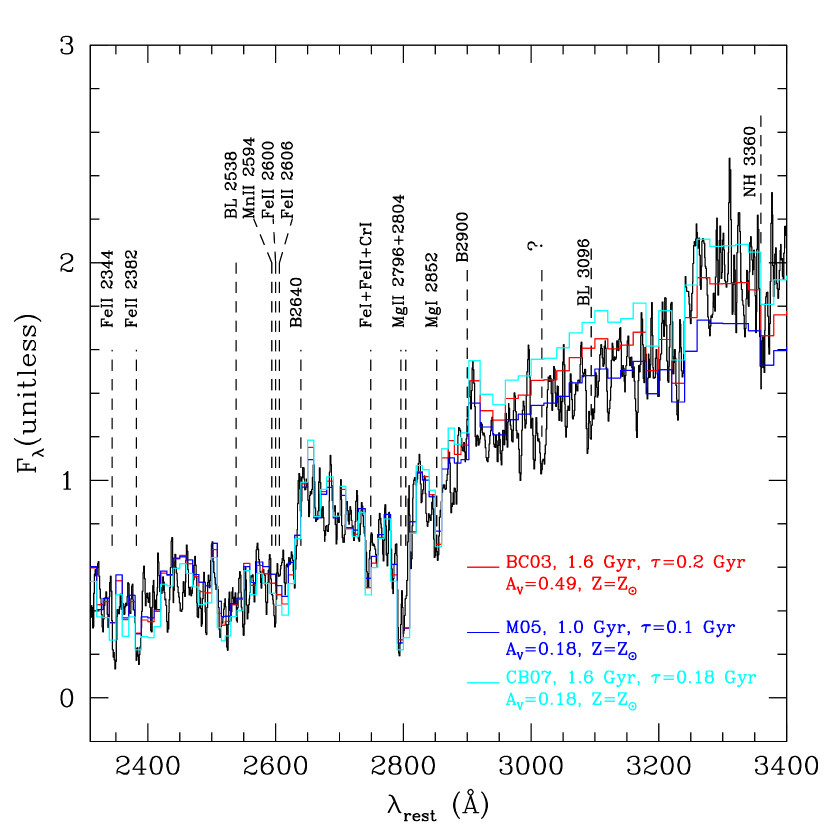
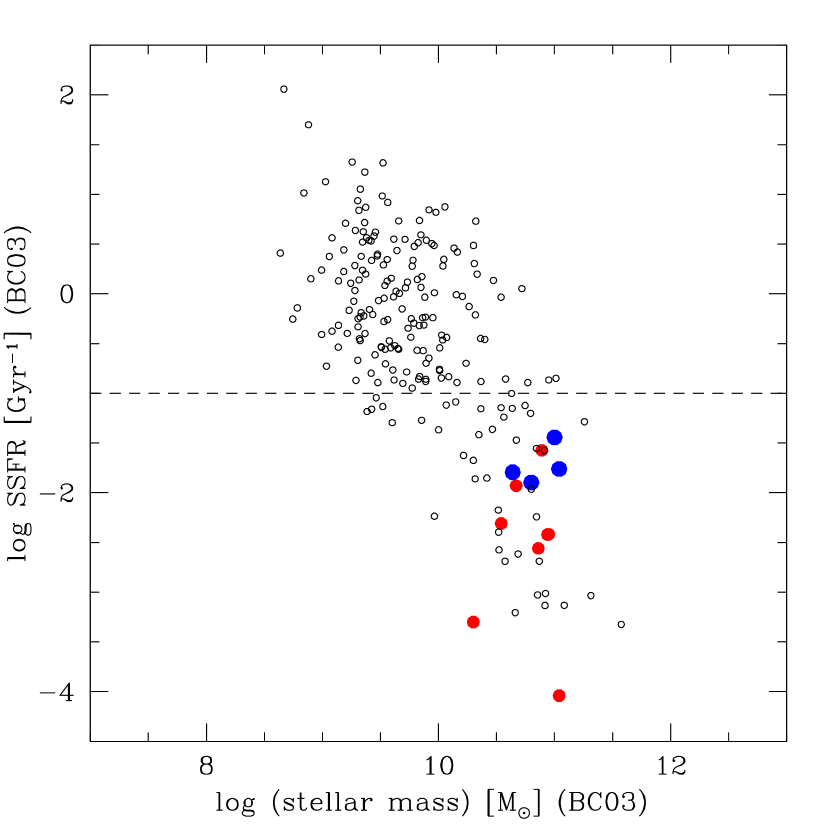
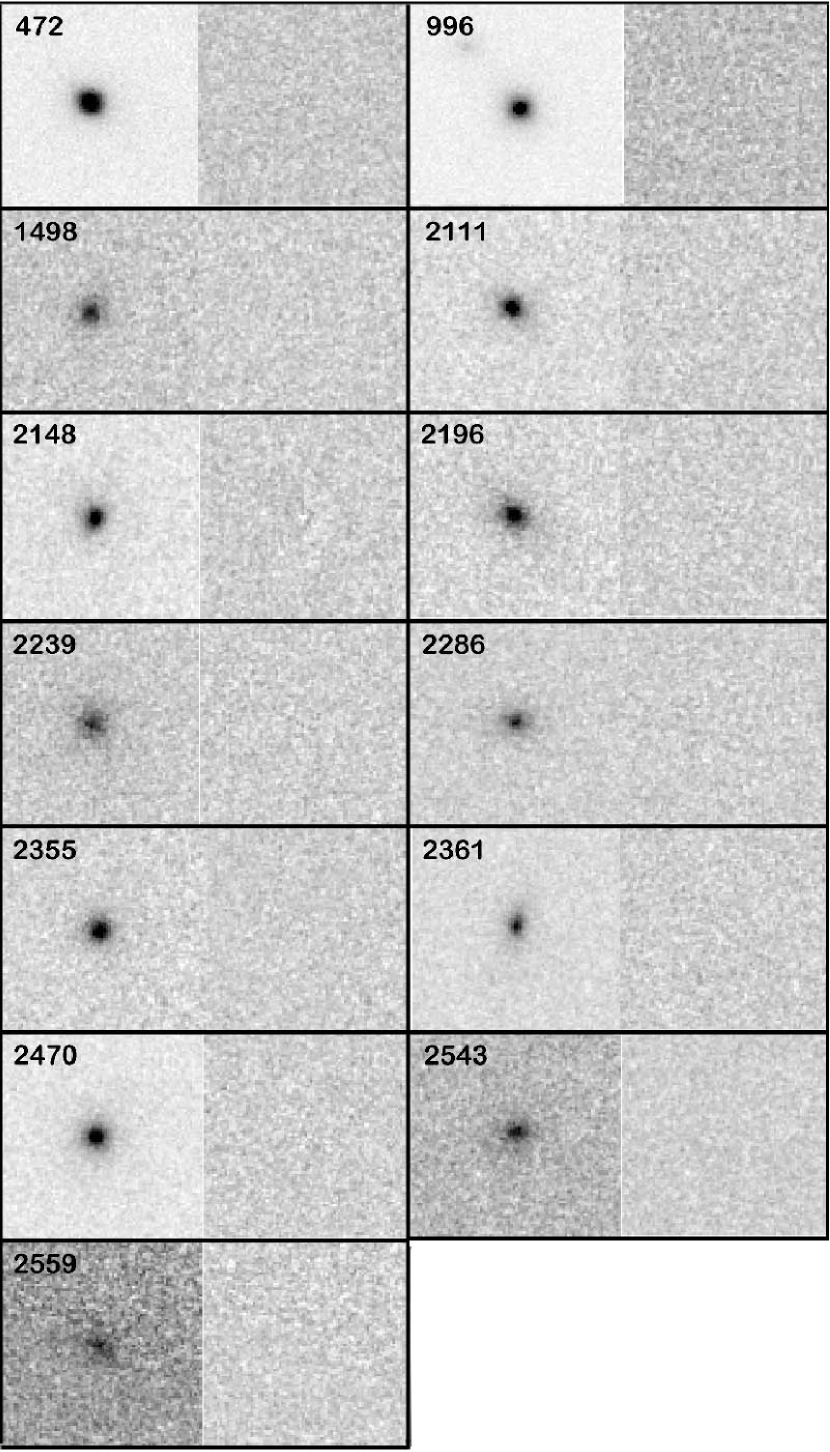
Table ID Age SFR Age SFR Age SFR BC03 M05 CB07 472 -22.09 0.7 0.6 10.67 0.55 0.1 0.8 0.0 10.49 0.14 0.1 0.8 0.3 10.58 0.19 0.1 996 -20.42 1.3 0.6 10.30 0.01 0.1 0.8 0.6 10.16 0.07 0.1 1.3 0.0 10.03 0.01 0.1 1498 -21.88 1.6 0.6 10.89 2.07 0.3 0.7 0.4 10.61 0.45 0.1 2.0 0.0 10.77 0.43 0.3 2111 -21.80 2.3 0.1 10.86 0.20 0.3 1.1 0.0 10.61 0.01 0.1 1.1 0.1 10.56 0.01 0.1 2148 -22.52 1.3 0.4 11.04 0.01 0.1 1.3 0.2 11.02 0.01 0.1 2.8 0.0 11.19 0.09 0.3 2196 -22.15 1.3 0.3 10.84 0.00 0.1 1.3 0.0 10.79 0.00 0.1 1.1 0.1 10.68 0.01 0.1 2239 -21.40 1.3 0.5 10.64 0.00 0.1 1.1 0.2 10.54 0.01 0.1 1.0 0.5 10.56 0.02 0.1 2286 -21.39 2.0 0.5 10.80 0.47 0.3 1.1 0.2 10.56 0.01 0.1 2.3 0.1 10.71 0.14 0.3 2355 -21.62 0.8 0.6 10.54 0.17 0.1 0.9 0 10.36 0.04 0.1 0.8 0.4 10.44 0.14 0.1 2361 -21.85 2.8 0.2 11.04 0.07 0.3 1.4 0.2 10.83 0.00 0.1 3.0 0.0 10.99 0.03 0.3 2470 -22.07 2.2 0.1 10.94 0.33 0.3 1.1 0.0 10.71 0.01 0.1 1.0 0.3 10.73 0.03 0.1 2543 -21.30 1.1 1.8 11.00 12.4 0.3 1.0 0.6 10.69 0.03 0.1 2.1 0.6 10.88 0.40 0.3 2559 -22.09 2.2 0.1 10.95 0.34 0.3 1.0 0.0 10.67 0.03 0.1 1.1 0.0 10.63 0.01 0.1 Mean -21.79 1.6 0.4 10.81 0.35 0.2 1.1 0.2 10.62 0.06 0.1 1.6 0.2 10.67 0.12 0.2 0.53 0.6 0.2 0.22 0.57 0.1 0.2 0.2 0.28 0.12 0.0 0.8 0.2 0.28 0.15 0.1 Rest-frame absolute magnitudes () are relative to BC03 fitting. The three groups of columns (Age, , M, SFR, ) are relative to BC03, M05 and CB07 models respectively. The mean and rms of and SFR for BC03 models are given excluding the highly discrepant values for object 2543. The units are Gyr, mag, log/M⊙), M⊙yr-1 and Gyr for Age, , Mass, SFR, respectively.
6 Morphological properties
6.1 The HST Data
Thanks to the availability of deep and ultradeep HST imaging from GOODS and HUDF projects, it was possible to complement the spectroscopy and photometry with quantitative morphological information. GOODS has surveyed the Chandra Deep Field South (CDFS) with ACS and filters F435W (B), F606W (V), F775W (I) and F850LP (z), with exposure times respectively of 3, 2.5, 2.5 and 5 orbits. HUDF has instead surveyed a smaller area of about arcmin2 which has a large overlap with the GMASS field (see Kurk et al. 2007a for further details) in the same 4 bands, but with exposure times respectively of 56, 56, 150 and 150 orbits. For both datasets the publicly available images were drizzled to a scale of 0.03 arcsec/pixel in order to improve the PSF pixel sampling. Furthermore, the HUDF was observed also with deep NICMOS imaging of arcmin2 with F110W and F160W filters (Thompson et al. (2005)). NICMOS images were drizzled to a final scale of 0.09 arcsec/pixel.
6.2 Visual classification
A visual classification based on eye inspection was performed on the whole GMASS sample independently by two of us (PC and GR). The global morphological results will be presented in a forthcoming paper (Cassata et al. 2007, in preparation). The visual analysis was always done in the ACS filter band closest to the rest-frame -band. For the objects at (like the ones presented in this paper), the analysis was done in the reddest filter available (z-band). The classification scheme is based on 6 classes (see also Cassata et al. 2005): 1. Ellipticals/S0 galaxies; 2. Peculiar ETGs (i.e. ETGs with signs of interaction or with some isophotal asymmetry); 3. Normal spirals; 4. Perturbed spirals, that is disk galaxies with an evident bulge but showing also asymmetries due to interactions or regions of enhanced star formation; 5. Irregular galaxies; 6. Compact objects. In Figure 11 we present a gallery of the 13 galaxies in the sample. Each box is 2.42.4 arcsec2, corresponding to about 20 kpc at redshift 1.5.
Fig. 11 clearly shows that the majority of passive galaxies have the spheroidal morphology characteristic of ETGs. In particular, we classified 7 of them as pure ellipticals, as they appear resolved, concentrated and very regular; 2 of them have been classified as spirals (2239 and 2559), as they are not very concentrated; finally, 4 have been placed in the compact class, i.e. with very concentrated and regular morphological structure (472, 2286, 2361 and 2543) (see Table 4). The NICMOS + F160W images available in the HUDF for the galaxies IDs 472 and 996 show very compact and spheroidal morphologies at m (Fig. 12).
6.3 Surface brightness profile analysis
We used GALFIT (Peng et al. 2002) to model the surface brightness distribution for the galaxies in our sample. As these galaxies are very red and become rapidly very faint going to short wavelengths, GALFIT was run on the image taken with the reddest available ACS filter (z-band, filter F850LP). The PSF with which GALFIT convolves the models during the fit process was obtained by averaging 10 stars in the field. Two of the objects (472 and 996) lie in HUDF area, so they have been analyzed in the HUDF ACS F850LP image, while the other 11 have been analyzed in GOODS image. We also attempted to analyze galaxies IDs 472 and 996 in the HUDF NICMOS + F160W image, but the fitting did not provide stable and reliable results due to their small sizes with respect to the pixel scale and the difficulty to derive the PSF because of the very few suitable stars available.
In all cases, we used a Sérsic profile to model the galaxy surface brightness profiles :
| (1) |
where is the surface brightness measured at distance , is the surface brightness measured at the effective radius and is a parameter related to the sersic index . For =1 and =4 the Sersic profile reduces respectively to an exponential or deVaucouleurs profile. Bulge dominated objects having typically high values (e.g. ) and disk dominated objects having around unity.
6.4 Simulations
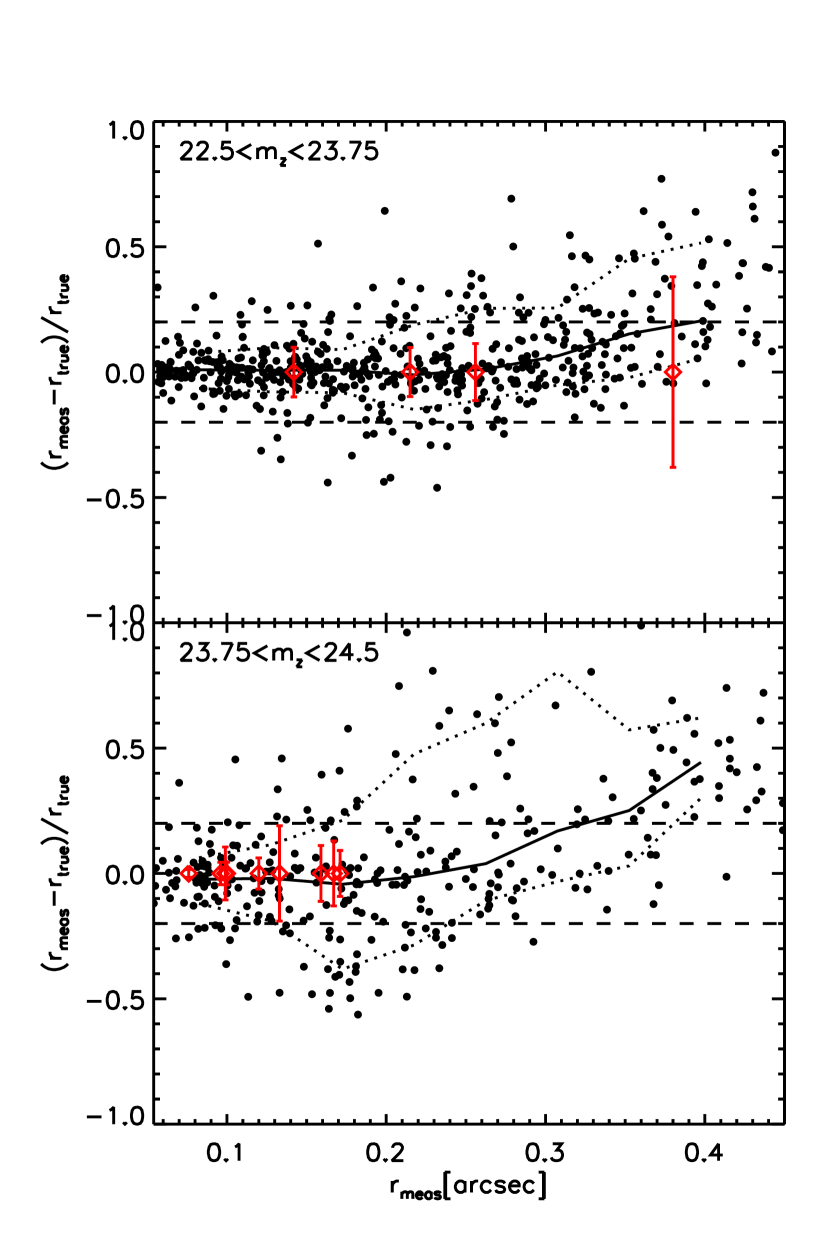
To test the capability of GALFIT to obtain reliable size measurements we made use of simulations. To this purpose, we built a set of galaxies with a wide range of properties, to take into account all possible systematic biases. In particular, we have chosen a grid of values for magnitudes, radii, Sersic indices and axial ratios. Apparent magnitudes span from 22.5 to 24.5, reflecting the magnitude distribution of the 13 real galaxies in the sample. The range of radii goes from 0.06 to 0.45 arcsec (basically from 2 pixels to the typical size that local galaxies with masses comparable to those of our sample would have at ). Sersic indices span from 1 to 6 and axial ratios varied between 0.4 and 1. A set of 1000 galaxies was built by randomly selecting the above parameters from their intervals. Then, the galaxies were simulated using GALFIT, and convolved with the same average star PSF used for the fitting process. Finally, the simulated galaxies were placed in the real z-band ACS/GOODS-South image in random positions in order to take into account possible systematics due to deblending and variations of the local background. The same GALFIT fitting process used for the 13 real galaxies was then applied to derive the morphological parameters of the simulated galaxies. First, we used SExtractor to obtain first estimates for magnitude, size, axial ratio and orientation. Second, we ran GALFIT using the SExtractor values as first guesses. In the fitting procedure, was left free to vary between 0.5 and 8. The noise images requested by GALFIT to estimate , were built using proper values of RMS, GAIN end EXPTIME.
The results of this process are summarized in Fig. 13, where we show the fractional error on the measured size as a function of the output size. This allows a simple comparison between the sizes and errors estimated with this technique for our 13 real galaxies and the results of simulations. It can be noted that for small sizes the average error is very close to zero, with a small scatter. For large sizes, instead, the error distribution moves towards positive values, and the scatter increases. This tendency to overestimate sizes for large objects is also dependent on the magnitude, being mild for galaxies with and more important for object with . In any case, this overestimate is relevant only for objects with sizes larger than arcsecs. In the same Figure, we also show the radii measured for the 13 galaxies in the sample, together with the formal errors determined by GALFIT. It can be seen that 4 and 9 of them are respectively brighter and fainter than , and that 12 have measured sizes smaller than arcsec, in the regime where the simulations show no systematic errors and a small scatter. Only one object has a measured size larger than 0.3 arcsec, for which the simulation shows a typical overestimate of the size of about 20%. The size for this object can thus be considered as an upper limit.
Overall, the errors measured by GALFIT are smaller than the scatter shown by simulated galaxies with similar output sizes. Most of the 13 galaxies have sizes for which the simulation shows a scatter of about 20%, so we decided to assign a minimum fiducial error of 20% to our galaxy sizes.
6.5 GALFIT results
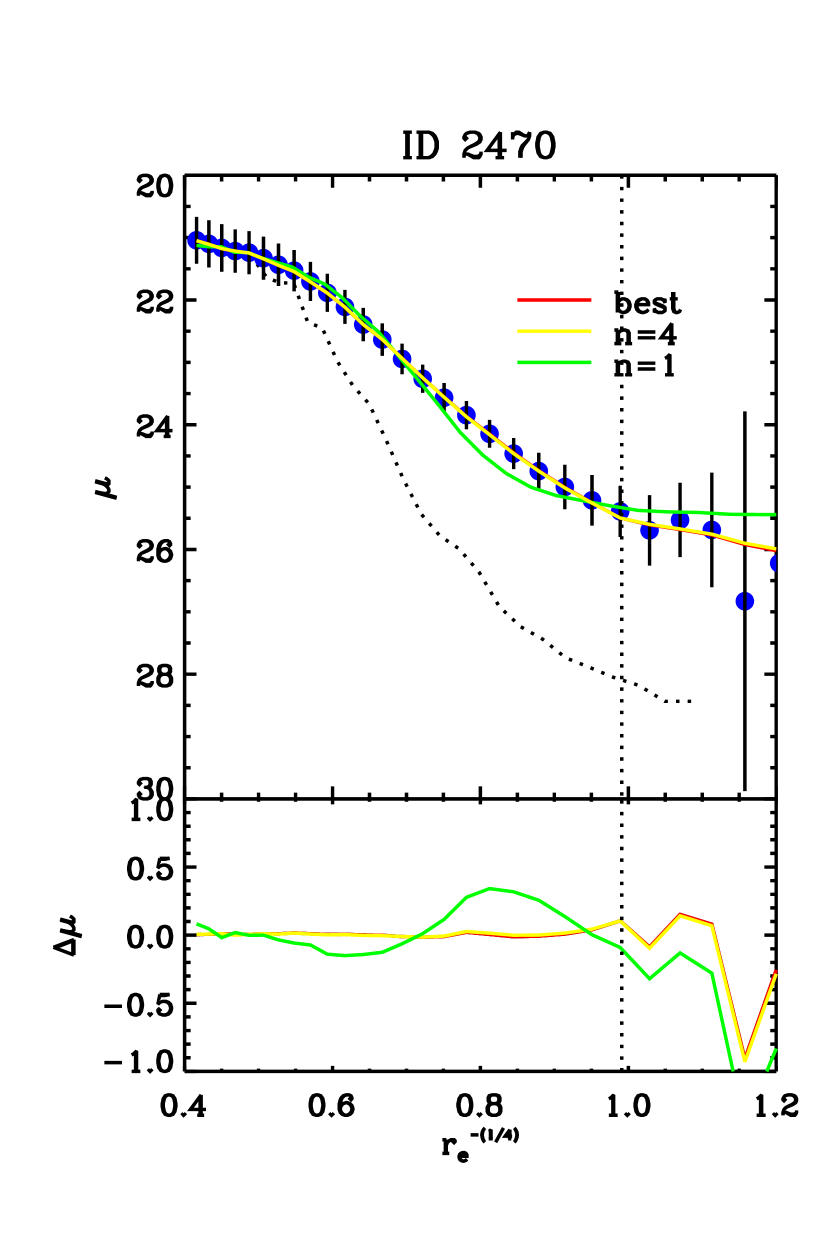
Once assessed the capability of GALFIT of retrieving robust measurements of the size even for galaxies at high redshift, we run the code on our 13 galaxies, using SExtractor extimates of magnitude, size, axial ratio and position angle as first guesses. The GALFIT results are shown in Table 6. The residual maps provided by GALFIT, as result of the subtraction of the best fit model from the original galaxies, show no significant structures for all the galaxies (Fig. 11). 11 of the 13 objects have best fit solutions with Sersic index , indicating that the bulk of the galaxy light comes from a dominant bulge component (e.g. in Fig. 14). In our sample, among the 7 galaxies visually classified as pure ellipticals, 6 have 4. In the class of visually classified ellipticals, only galaxies 1498, 2355 and 2559 are best fitted by a smaller value of the Sersic index (1-2). The GALFIT results broadly agree with what was anticipated by the visual classification, i.e. that passive galaxies at 1.4–2 have the typical morphology of ETGs, as in the present–day Universe.
The galaxy angular sizes were circularized as , where and are the effective radius along the major axis and the ellipticity of the galaxy morphology respectively. The values are in the range of 0.07–0.38 arcsec, corresponding to 0.6–3.2 kpc (Table 4). Of the two galaxies located in the HUDF (IDs 472 and 996) previously identified by Daddi et al. (2005a) (IDs are 3650 and 8238 respectively), ID 472 has and consistent within the errors with those of Daddi et al. (2005), whereas for ID 996 we measure a significantly smaller . Here we adopt our measurements for ID 996.
In our morphological analysis, the reddest filter available for all galaxies (ACS F850LP), does not cover the rest-frame optical, but the rest-frame mid–UV (3000–4000 Å, i.e. approximately the -band). This might introduce a bias due to the possible morphological -correction and/or the internal color gradients usually present in ETGs, thus resulting in a wavelength-dependent size of the galaxies. In particular, gradients with colors redder towards the center (as often observed in ETGs; e.g. Peletier et al. 1990) could make the sizes measured in the optical larger than those in the UV. However, McIntosh et al. (2005) showed that for this kind of gradient, the expected size variation from the rest-frame -band to the -band is . This means that our galaxies would have sizes larger by only 6–11% if observed in the rest-frame -band for the redshift range of our sample (). Other results indicate that the sizes of spheroidal galaxies do not change substantially as a function of wavelength (e.g. by comparing measured in ACS and NICMOS bands; e.g. see McGrath et al. 2007a ; Trujillo et al. (2007)).
As discussed in the next sections and found in other works (e.g. Daddi et al. 2005a ; Trujillo et al. (2006)), the sizes derived for most of our sample galaxies are much smaller than the ones observed at in ETGs with the same stellar mass. We explored the possibility that these small may be partly due to the presence of a point-like unresolved central source which dominate the surface brightness profiles and bias the estimate of towards small values. Thus, we attempted to perform fits with a two-component surface brightness profile made by a central unresolved source (using the stellar PSF) plus a Sersic profile. In all cases we found no significant improvements in the resulting best fit profile with respect to those obtained with a single (Sersic) component. More importantly, we found that typically less than 16% of the light (corresponding to mag2) is located in the putative central component, and the estimated values of are all consistent with the ones obtained with the single component fitting within 10%. This experiment strengthens even more that the measured for most galaxies in our sample are reliable and indeed very small.
| ID | Class | n | |||
|---|---|---|---|---|---|
| arcsec | kpc | mag arcsec-2 | |||
| 472 | 6 | 4.10.7 | 0.076 | 0.640.13 | 15.520.43 |
| 996 | 1 | 4.60.7 | 0.100 | 0.840.17 | 17.780.43 |
| 1498 | 1 | 1.50.2 | 0.120 | 1.010.20 | 16.710.43 |
| 2111 | 1 | 4.00.4 | 0.099 | 0.840.17 | 16.390.43 |
| 2148 | 1 | 3.70.3 | 0.142 | 1.200.24 | 16.450.43 |
| 2196 | 1 | 6.00.9 | 0.380 | 3.221.22 | 18.950.82 |
| 2239 | 4 | 2.20.2 | 0.256 | 2.160.43 | 18.840.43 |
| 2286 | 6 | 2.60.3 | 0.159 | 1.350.27 | 17.820.43 |
| 2355 | 1 | 2.20.2 | 0.096 | 0.810.16 | 16.480.43 |
| 2361 | 6 | 4.10.4 | 0.133 | 1.130.23 | 16.970.43 |
| 2470 | 1 | 4.20.3 | 0.215 | 1.810.36 | 17.780.43 |
| 2543 | 6 | 2.20.3 | 0.167 | 1.410.28 | 18.020.43 |
| 2559 | 4 | 1.00.5 | 0.171 | 1.430.29 | 17.250.43 |
Class : visual classification (Section 6.2)
7 The size – mass relation
Early-type galaxies at follow a well-defined size–mass relation (e.g. Shen et al. 2003; McIntosh et al. 2005), with the size increasing as a function of mass. Models of galaxy formation predict different size-mass relations depending on the history of mass assembly (see Shen et al. 2003).
The role of GMASS is the secure spectroscopic identification of a significant number of passive galaxies down to lower masses than in previous samples at which were biased towards the most massive systems (e.g. Daddi et al. 2005a ; Trujillo et al. (2006); McGrath et al. 2007a ; Trujillo et al. (2007)). This allows us to better probe the size–mass relation of ETGs at 1.4–2 down to M⊙.
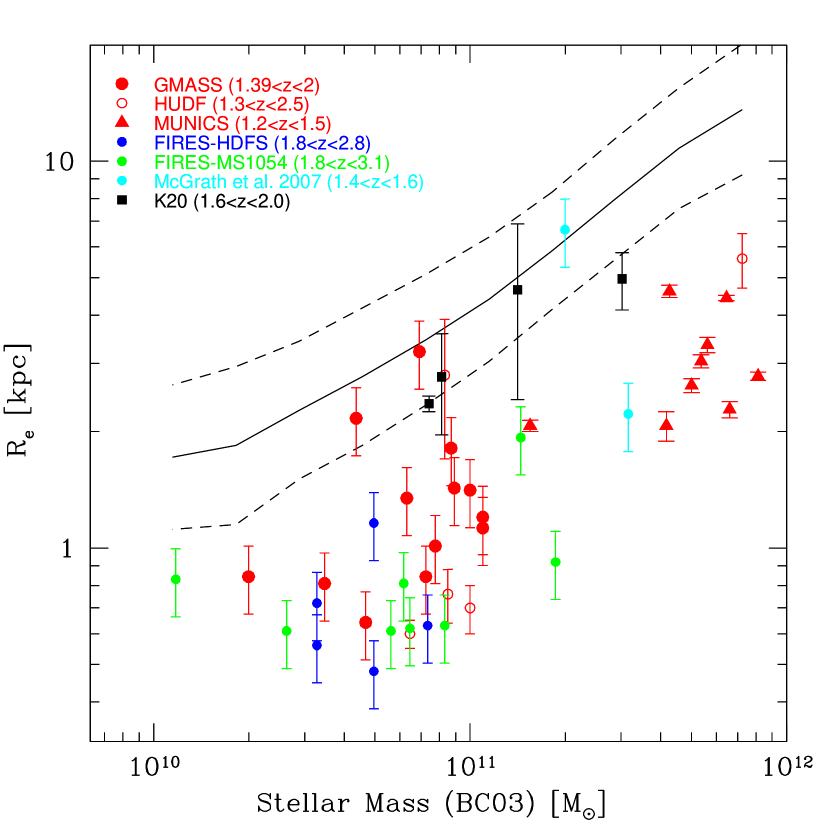
The size – stellar mass relation for the passive galaxies in our sample is presented in Figure 15 and compared with the local size-mass relation measured by Shen et al. 2003 for ETGs in the SDSS and with other passive galaxies at from the literature. We note that in the local relation published by Shen et al. (2003, their Table 1) there was a typo in the parameter, while here we used the correct one (; S. Shen, private communication).
In the comparison amongst different samples, it is important to account for the differences in the adopted synthetic stellar population models and IMFs. Throughout the present work, we adopt a Chabrier IMF and scale all the literature masses to that IMF with the following relations: log(Chabrier)=log(Salpeter)–0.23 and log(Chabrier)=log(Kroupa)–0.04. In addition to the IMF conversion, it is sometimes necessary to scale stellar masses by taking into account the different model spectra used to fit the SEDs. Based on previous (e.g. Wuyts et al. (2007); Maraston et al. (2006)) and present results (Section 5.2), we adopted the conversion log(M05)=log(BC03)–0.15 in order to take into account the average decrease (40–50%) of M05 masses with respect to BC03 results for galaxies at .
Shen et al. (2003) adopted a Kroupa IMF and used the stellar masses that were previously estimated by Kauffmann et al. (2003) through the comparison of observed features in the SDSS spectra with BC03 template spectra. However, we decided not to scale the local size–mass relation of Shen et al. (2003) to account for the difference between BC03 and M05 masses because at the typical ages of ETGs are so old (several Gyr) that the effects of TP-AGB stars should be negligible. For the sample of Daddi et al. (2005a) we used the most recent SED fitting results of Maraston et al. (2006) who adopted a Kroupa IMF and provided stellar masses estimated with both BC03 and M05 models. Trujillo et al. (2006) adopted a Kroupa IMF and their stellar masses refer to BC03 models. For the sizes of the MUNICS galaxies, we adopted those of Longhetti et al. (2007). For the FIRES sample galaxies, Zirm et al. (2007) used M05 models and a Salpeter (1955) IMF, whereas Toft et al. (2007) used BC03 models and a Salpeter IMF. We recall that the redshifts of the FIRES galaxies of Zirm et al. (2007) and Toft et al. (2007) are photometric. We also added two spheroidal galaxies at selected from the sample of McGrath et al. (2007a, 2007b) who adopted BC03 (with Chabrier IMF) for their SED fitting.
Fig. 15 shows that passive galaxies at follow a clear size–mass relation. However, the majority of them has sizes significantly smaller than at 0 for a fixed stellar mass, whereas only 15-20% are located within the scatter region of the relation of Shen et al. (2003).
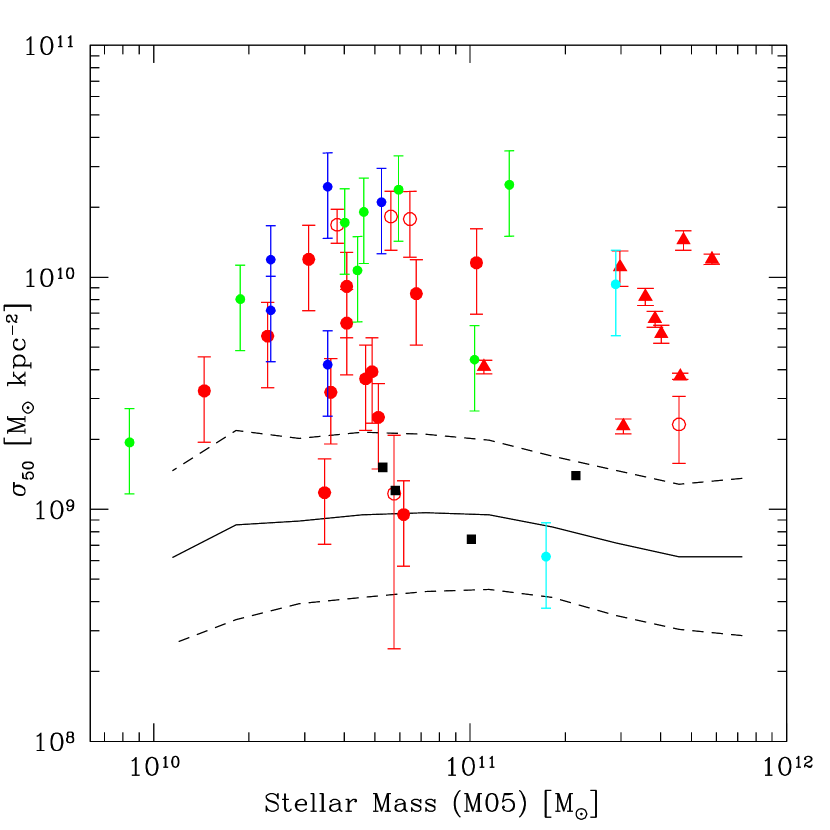
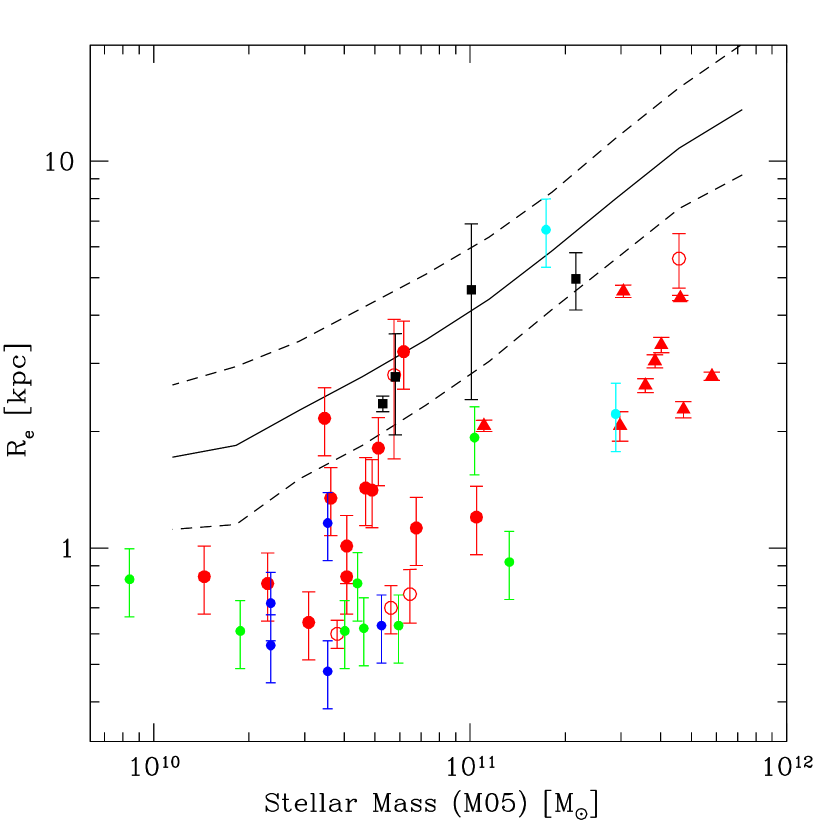
The result on the small sizes at holds independently of the adopted stellar masses (cf. Fig 15 left and right panels). For the GMASS galaxies only (for which we also have stellar masses estimated with CB07 models), the results are very similar to those of M05 stellar masses if CB07 stellar masses are used. The average ratio between the observed sizes and the size at (Shen et al. 2003) for the same stellar mass (all scaled to BC03 + Chabrier IMF) is = 0.420.25 and 0.290.14 for (=1.60) and (=2.52) respectively. No significant correlation was found between the galaxy size (or ) and physical or environmental properties (age of the stellar population, SFR, SSFR, rest-frame colors, , location inside our outside the structure at ).
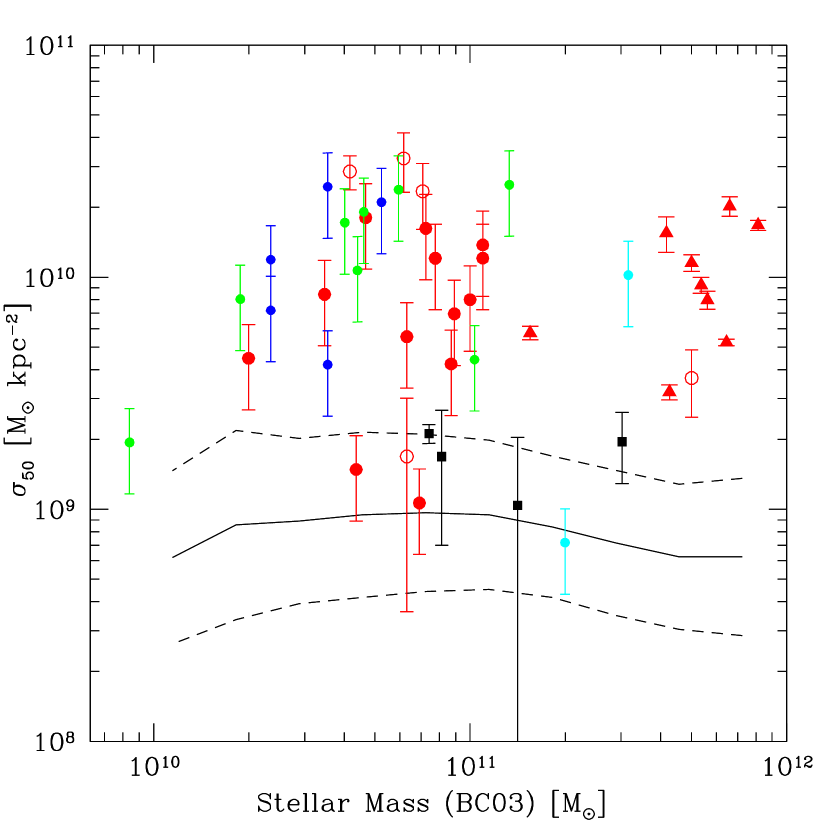
The sizes smaller by a factor of 2-3 than at imply that the stellar mass surface densities are 5–10 times larger. Fig. 16 shows the stellar mass surface densities () of the passive galaxies as a function of stellar mass and the comparison with the relation derived from Shen et al. (2003) sample. The stellar mass surface densities are estimated as . The difference with respect to galaxies becomes even more striking if stellar volume densities are considered: an excess by a factor of 3 in size () corresponds to a factor of 30 in volume density.
8 Comparison with early-type galaxies at
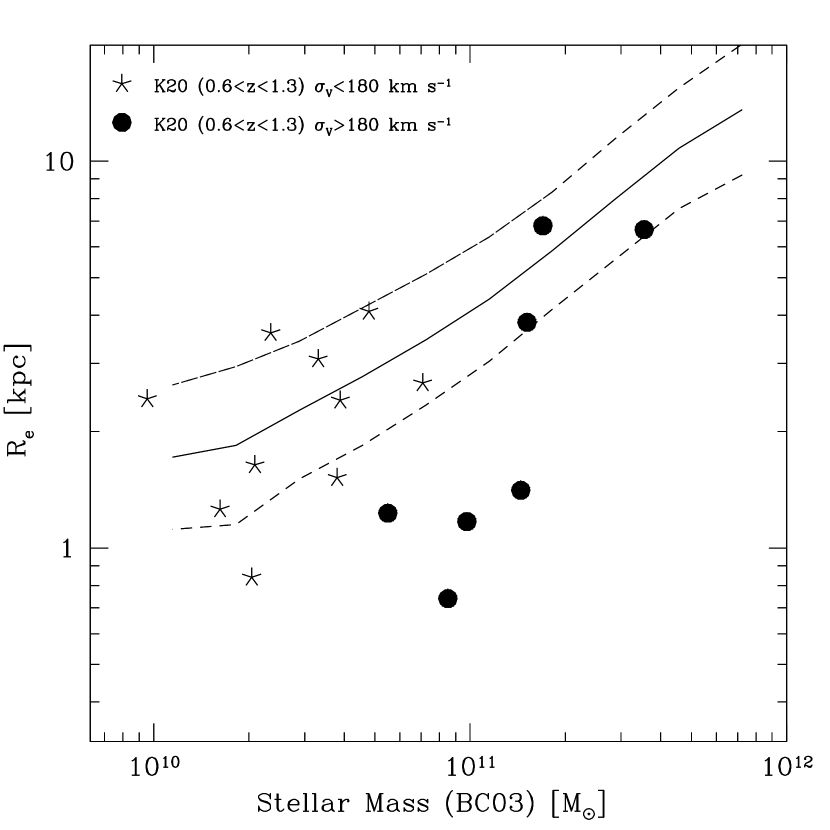
We also explored how the picture changes at lower redshifts using the small, but highly complete spectroscopic sample of K20 Survey (Cimatti et al. 2002b ) ETGs at for which also the absorption line velocity dispersion () is available. Fig. 17 shows that at 1 more galaxies can be located within the relations (see also McIntosh et al. (2005); Trujillo et al. (2007)).
From the scaling relation of ETGs (e.g. Jorgensen et al. (1995); van Dokkum (2005)), it is expected that the densest systems should have necessarily the highest velocity dispersion. Fig. 17 shows that while ETGs with high are located both inside and outside the –mass relation at , most of the smallest/densest outliers have high values of . The migration of passive galaxies in the – and – planes from regions of small size and high density to the relations (Fig. 15–17) is further evidence that the redshift range of about is the critical cosmic epoch for the assembly and structural transformation of ETGs (e.g. Fontana et al. (2004); Glazebrook et al. (2004); Abraham et al. (2007); Arnouts et al. (2007)).

9 The Kormendy relation
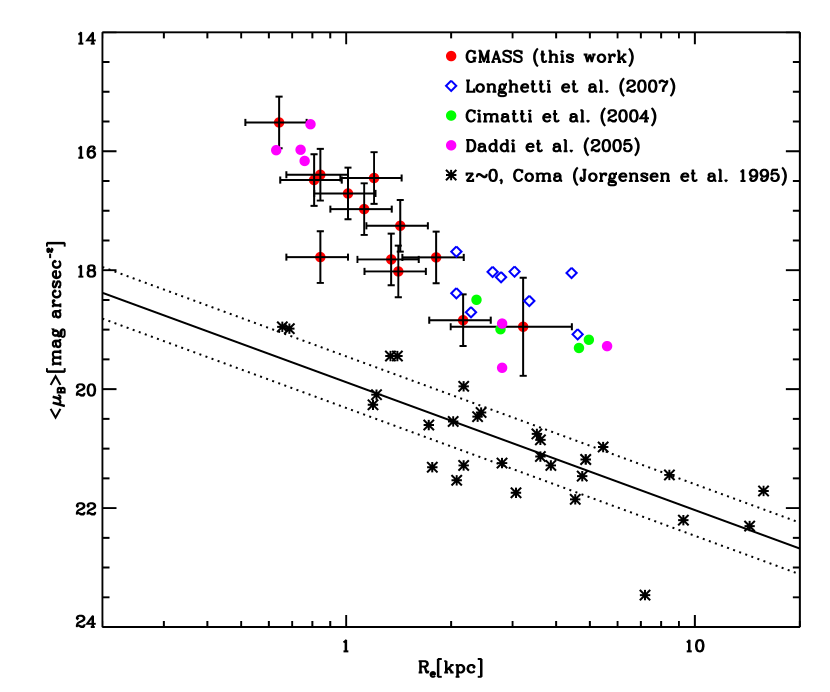
In the absence of the velocity dispersion measurements needed to study where the GMASS passive galaxies lie in the Fundamental Plane of ETGs, we explored how they behave with respect to the Kormendy relation, i.e. a projection of the Fundamental Plane which correlates , the mean surface brightness within and the physical size .
This relation for our sample is shown in Figure 18. The -band rest-frame magnitude is measured during the photometric SED fitting process described in Section 5.2. Here we applied the appropriate correction for the surface brightness dimming effect. The mean surface brightness is finally computed as:
| (2) |
where is the absolute magnitude in the B-band, is the distance modulus at redshift , is the effective radius in arcsec and is the redshift of the galaxy.
As a local () reference, we took the Kormendy relation for Coma galaxies by Jorgensen et al. (1995). In Fig 18 we show both the individual Coma galaxies and the best fit to their relation together with its scatter. We also plot the 1.4 galaxies of Longhetti et al (2007): their measurements (done on NICMOS images and then converted into the rest-frame Gunn band) have been properly translated in B-band magnitudes applying a typical color =1.4, and appear to be in good agreement with ours. It can be noted that the Kormendy relation seems to evolve very strongly between 0 and 1.5. In particular, galaxies of the same size appear to be more luminous by an amount between 2 and 3 magnitudes. This brightening is dependent on the physical size, being larger for smaller galaxies, thus making the slope of the relation steeper at . In any case, all the galaxies, if they have to end on top of the local relation, must fade their luminosity by more than 2 magnitudes from 1.5 to 0. This fading exceeds by at least 0.5 magnitudes the largest possible fading predicted by spectral evolution models of passive red galaxies (see also Longhetti et al. 2007 for a similar result). Since the surface mass density drops by a factor of 5-10 in the same redshift range, it means that these high- compact and dense galaxies can reach the local Kormendy relation only through a combination of increase in size () and fading due to the passive evolution of the stellar populations.
10 Are there superdense relics at ?
The superdense ETGs identified at seem to disappear in the present-day Universe (e.g. Shen et al. 2003). However, recent works based on SDSS data showed that there is a population of very massive ETGs with km s-1 which, compared to ETGs of the same luminosity, are characterized by very small sizes (Bernardi et al. (2006, 2007)). Thus, we investigated whether some of these local galaxies have properties similar to those observed in passive galaxies at .
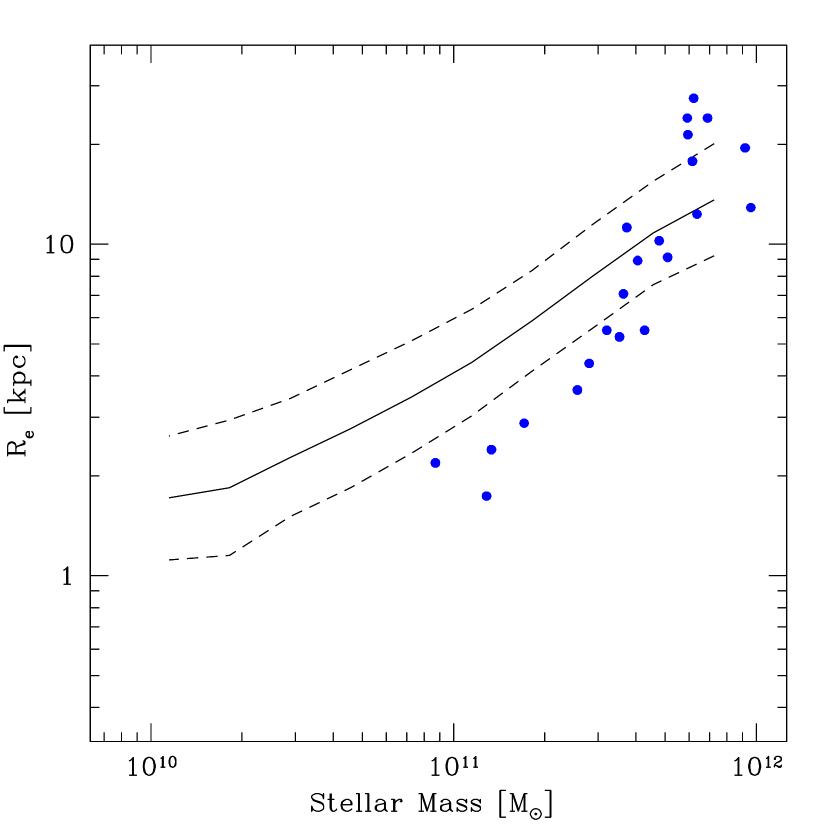
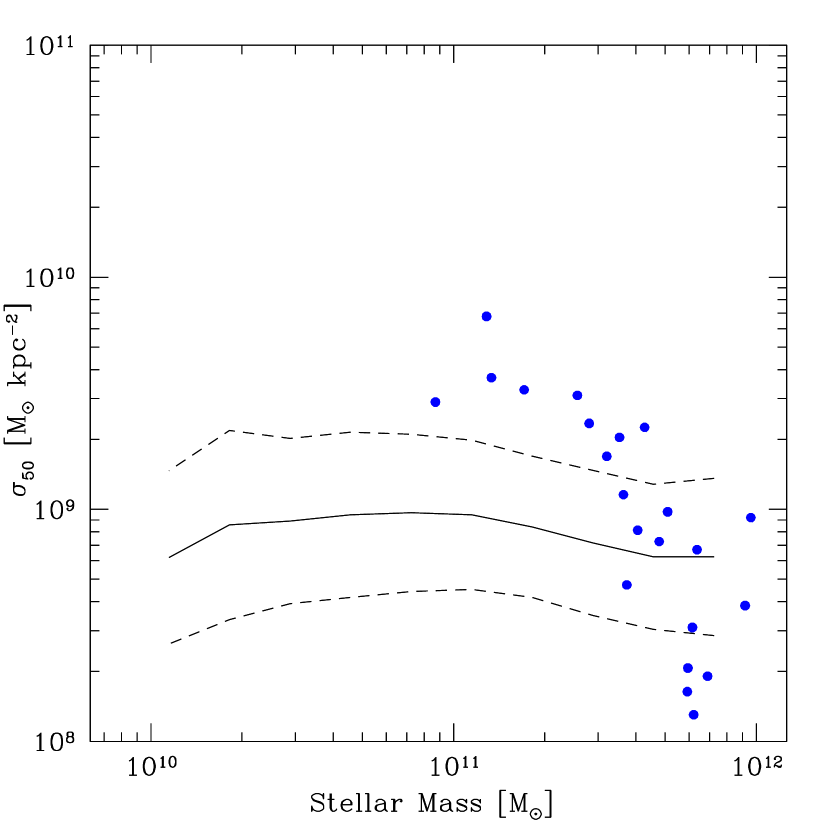
Fig. 19 shows the location of these galaxies in the –mass and –mass planes. The stellar masses derived with the method described by Kauffmann et al. (2003) (that are also used by Shen et al. 2003) were associated to the ETGs in the sample of Bernardi et al. (2007) (J. Brinchmann, private communication). Fig. 19 shows that there are a few outliers which are not located within the Shen et al. (2003) relations and are characterized by small sizes around 1–2 kpc with stellar masses around M⊙. These systems show a significant excess in stellar mass surface density (Fig. 19), but never as strong as observed in ETGs at . The number density of these systems at is very small (– Mpc-3, Bernardi et al. (2006)), and much smaller than the characteristic abundance of passive galaxies at ( Mpc-3, Kong et al. (2006)). Thus, we conclude that superdense relics with 1 kpc at are extremely rare with respect to , and absent if kpc. However, in the ”smooth envelope accretion” scenario discussed in Section 11.2.2, it might be possible that the superdense galaxies observed at survived as hidden, very dense cores inside present-day ETGs.
11 New constraints and open questions
These findings provide new pieces in the puzzle of massive galaxy formation and evolution, but at the same time open new crucial questions: (1) how did these systems form ? (2) what mechanism(s) can explain their subsequent size growth and decrease of the internal density ?
11.1 How did the superdense galaxies form ?
The mere existence of 1 Gyr old, passively evolving galaxies up to implies that the bulk of stars formed at higher redshifts. In particular, the constraints on the age, and stellar masses indicate that the star formation at was very intense (e.g. SFR M⊙ yr-1) in order to form stellar mass up to M⊙ with such short timescales (see also Cimatti et al. (2004); McCarthy et al. (2004); Daddi et al. 2005a ; Saracco et al. (2005); Longhetti et al. (2005); Kriek et al. (2006)).
The small sizes and high internal mass densities of the passive galaxies at provide new observational clues which help to unveil the nature of their precursors. Amongst all the precursor candidates mentioned in the Introduction, only the submm/mm-selected galaxies (SMGs) (Blain et al. (2002)) have sizes and mass surface density comparable to those of passive galaxies (Tacconi et al. (2006, 2007)).
Table 5 compares the properties of SMGs and passive galaxies. The similarity between the properties of the two populations is striking, with the notable exception of the comoving number density, with SMGs being an order of magnitude rarer (comoving number density Mpc-3; Scott et al. (2002); Chapman et al. (2005)) than the passive descendants ( Mpc-3; Daddi et al. 2004b ; Daddi et al. 2005a ; Kong et al. (2006)).
The other populations of massive star-forming galaxies identified at 1.5–2 (e.g. , BM/BX, …) show distinct properties if compared to SMGs: much larger sizes in the range of 2–8 kpc and mass surface densities lower by an order of magnitude ( M⊙pc-2) (see Bouché et al. (2007)).
The difference in these properties may reflect distinct dynamical and assembly histories. SMGs may represent the cases where rapid and highly dissipative major mergers occur at with timescales of 0.1 Gyr (e.g. Narayanan et al. (2006); Khochfar & Silk 2006a ; Tacconi et al. (2006, 2007) and references therein) and leave very compact, superdense remnants which then evolve almost passively at (see also Swinbank et al. (2006)). The other star-forming systems selected in the optical and near-infrared at may have a less violent evolution characterized by star formation activity extended over longer timescales (0.5–1 Gyr, Daddi et al. 2005b ) and by multiple minor mergers or rapid dissipative collapse from the halo, with either process capable to form early disks. These massive disks may later also evolve into spheroids through disk instabilities of further merging processes (see Genzel et al. (2006)).
In this framework, objects like GMASS ID 2543 might represent the transition phase of an object with a substantially developed old stellar population concentrated in a bulge-like structure which dominates the spectrum, SED and morphology, but with still a residual star formation activity of a few solar masses per year as indicated by the weak [O II]3727 emission and the possible detection at 24m.
| Quiescent galaxies | SMGs | |
|---|---|---|
| Redshift | ||
| Age of the Universe | 4.3 Gyr | 2.7 Gyr |
| Mass | M⊙ (stars) | M⊙ (gas) |
| Size | 1-2 kpc (stars) | 1-2 kpc (gas) |
| Mass surface density | M⊙pc-2 (stars) | M⊙pc-2 (total) |
| Starburst timescale | 0.1-0.3 Gyr | 0.1 Gyr |
| Star formation rate | M⊙ yr-1 | 100-1000 M⊙ yr-1 |
| Number density | Mpc-3 | Mpc-3 |
| Correlation length | Mpc | Mpc |
Under the assumption that all passive galaxies at are the descendants of the starburst phase occurring in SMGs at , the characteristic timescale (”duty cycle” or the ”duration”) of the SMG phase can be estimated as the ratio of the comoving number densities of the two populations and the amount of cosmic time available from to (1.5 Gyr), i.e. 0.15 Gyr. This timescale is broadly consistent with the -folding timescale derived independently from the SED fitting and from the recent studies based on SMG molecular gas (Tacconi et al. (2006, 2007)).
The evolutionary link between rapid, dissipational, gas–rich merging or collapse (traced observationally by the SMG phase) at 2–3 and the superdense passive spheroids at 1–2 provides one of the strongest constraints known to date on the physical mechanisms capable to lead to the formation of massive spheroidal galaxies. Although the physical processes are completely different, this mechanism is somehow reminiscent of the ”old–fashioned” monolithic collapse.
11.2 How did the superdense galaxies disappear ?
The other major question is to understand how the superdense galaxies decreased their internal stellar mass density from and migrated to the local size – mass relation at .
11.2.1 Dissipationless merging
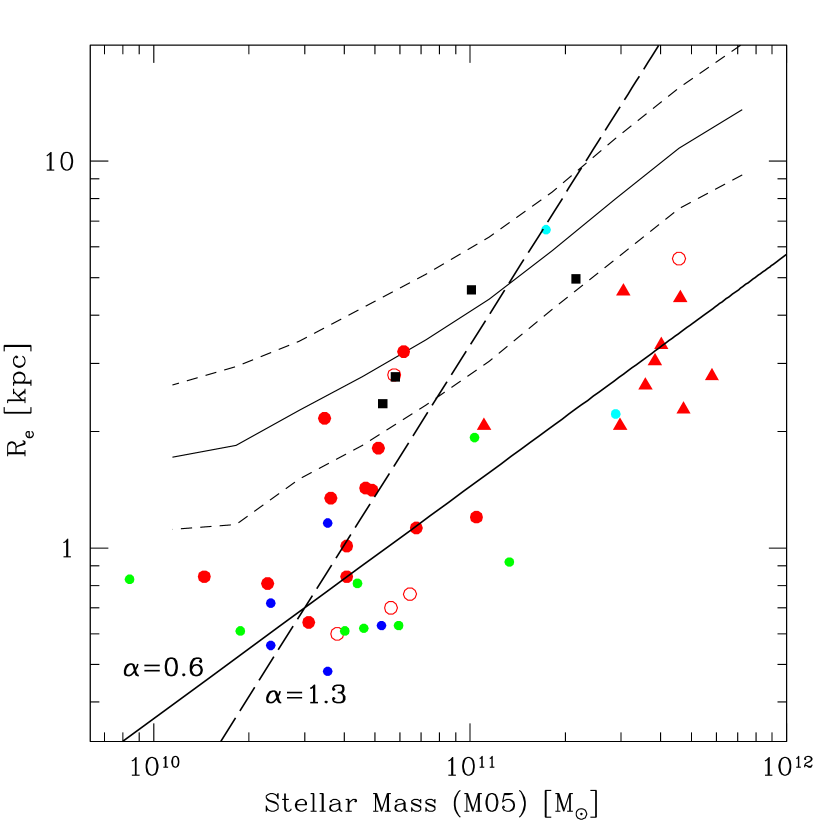
One possibility is the dissipationless (”dry”) major merging of ETGs. According to some models (Nipoti et al. 2003a ; Nipoti et al. 2003b ; Dominguez-Tenreiro et al. (2006); Naab et al. (2007); Ciotti et al. (2007); Boylan-Kolchin et al. (2006)), this process can increase the final size and mass of the system without altering substantially the stellar population content. In particular, Boylan-Kolchin et al. (2006) found that, under a set of orbital requirements, the stellar remnants of major dry mergers lie on the Fundamental Plane of their progenitors, and that the increase of the size with the increasing stellar mass is expected to follow a relation , with depending on the orbital properties (see also Nipoti et al. 2003b ; Ciotti et al. (2007)).
Fig. 20 shows the expected growth of as a function of mass for the extreme values of , and suggests that is needed to grow efficiently the compact galaxies from 1.5 and move them onto the local size – mass relation at . However, given all possible orbital parameters in dry merging events, we may expect the effective value of to be appreciably lower than its maximum value. Therefore, the ability of dry merging alone to solve the problem remains questionable.
The dry merging hypothesis can in principle be tested by deriving the statistics of pairs of close/interacting passive galaxies as a function of redshift. The redshift range seems to be the most important one because of the substantial decrease of the superdense ETG fraction from 1.4–2 to 0.6–1.3 (Fig. 17 vs Fig. 15; see also McIntosh et al. (2005); Trujillo et al. (2007)). Unfortunately, no dry merger statistics is available in this redshift range (see e.g. Bell et al. (2006)). We also recall that to be fully valid, the dry merging scenario should also be consistent with the recent findings of a very weak evolution of the stellar or dynamical mass functions of luminous and massive ( M⊙) ETGs at 0.7–0.8 (e.g. Bundy et al. (2007, 2006); Borch et al. (2006); Cimatti et al. (2006); Scarlata et al. (2006); Pozzetti et al. (2007)).
Due to the limited statistics of the present GMASS sample, it is not possible to place any strong constraint on the dry merging scenario. However, we note that 12 out of 13 galaxies (see Fig 11) have no visible companions within a distance of about 10-15 kpc. The only, exception is represented by ID 996 which has a companion galaxy located at a small distance, but neither spectroscopic nor photometric redshift are available for this galaxy. The only available constraint comes from the color () which looks similar to that of ID 996 (). However, even if this galaxy is at the same redshift of ID 996 and it will merge with it, this would not represent a ”major” merger as the companion is fainter than ID 996 by magnitudes, corresponding to a luminosity (or mass) ratio of 1:10.
Even if clear cases of dry merger candidates are not present in our sample, we note that about half of the passive galaxies found in the GMASS spectroscopic sample lie in the dense structure at (Vanzella et al. 2006; Castellano et al. 2007; Kurk et al. 2007b). The 7 galaxies present in this redshift spike have typical angular separations among themselves of 10 arcsec, corresponding to 85 kpc. It is tempting to speculate that some of these galaxies will later merge with each other along the filaments of this structure and form one or more larger massive ETG at lower redshift (see e.g. Nipoti et al. 2003b). McCarthy et al. (2007) have recently identified a compact cluster or group of red (passive) galaxies at which may represent an example of a short–lived phase leading to the subsequent assembly of more massive ETGs at later cosmic times.
In this framework, further constraints can come from the differential evolution of the size–mass relation of ETGs as a function of the environment. We preliminarily investigated this issue using the sample of Rettura et al. (2006) which includes literature cluster and field ETGs at 0.6–1.3. The sample is small and by no means complete. However, Fig. 21 suggests that environmental effects might be an important component of the size–mass relation evolution. Cluster ETGs seem to be preferentially located within or closer to the size–mass relation at with respect to the ETGs located in low density environment. If confirmed with larger and complete samples, this may be consistent with the scenario where the mass assembly and size growth of ETGs is accelerated within high–density environment.

Recent simulations attempted to explain the size evolution of ETGs in the scenario of dissipationless merging. Khochfar & Silk (2006b) used semianalytical models to show that the size of elliptical galaxies (relative to ) depends on the available amount of cold gas and the fraction of stars formed during the major merger event with which these galaxies formed. In this scenario, massive galaxies formed at high redshifts through gas-rich mergers which produced elliptical ”remnants” characterized by small sizes. The size evolution is stronger for more massive galaxies as they involve more gas at high redshifts when they form, compared to less massive ellipticals, and galaxies of the same mass at low redshift form mostly from gas-poor mergers (see also Khochfar & Silk 2006a). According to this picture, local ellipticals with present–day stellar masses M⊙ were only 1.25 times smaller at , whereas those with M⊙ were 4 times smaller at . Khochfar & Silk (2006b) also predict that the most massive ellipticals undergo on average 1–2 substantial ”dry” mergers between and today.
Figure 22 shows the location of the GMASS passive galaxies with respect to the model predictions of Khochfar & Silk (2006b). The ratio was obtained dividing the observed effective radius of the GMASS galaxies by that at derived from the stellar mass – size relation of SDSS ETGs of Shen et al. (2003) at the same mass of the GMASS passive galaxies. M05 stellar masses are used in this comparison, but the results do not change significantly if BC03 or CB07 masses are used. According to this comparison, the model predictions suggest that most GMASS passive galaxies are the progenitors (or the high- counterparts) of ETGs that today have stellar masses of M⊙, i.e. they are the progenitors of the most massive E/S0 systems at .
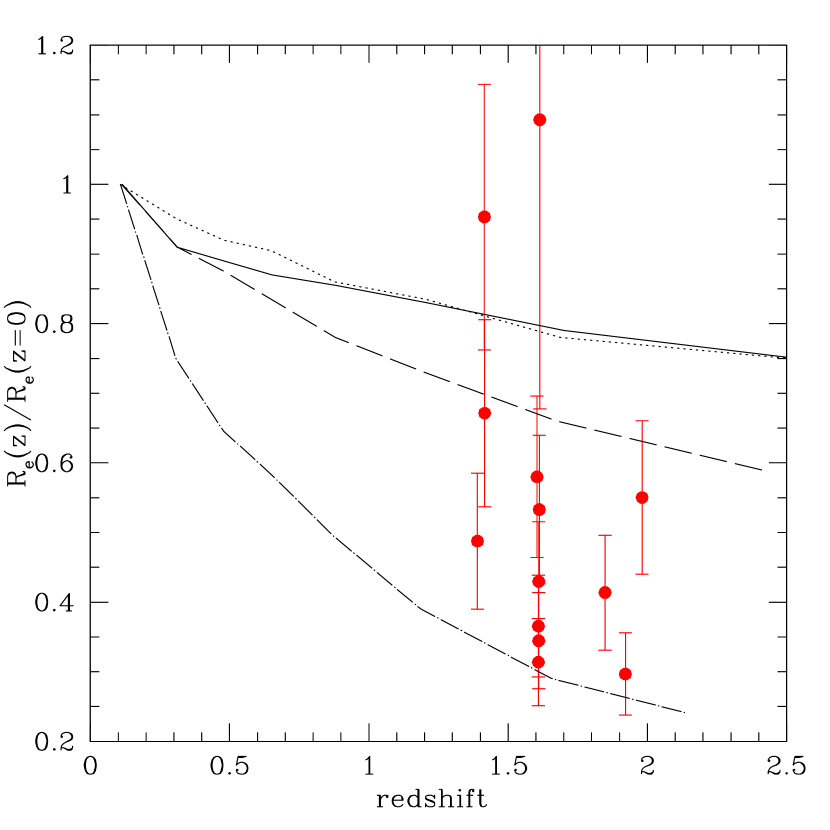
11.2.2 Smooth envelope accretion
With an alternative approach based on smoothed particle hydrodynamics (SPH) simulations, Naab et al. (2007) showed that ETGs can be formed with appropriate cosmological initial conditions and even without requiring recent major merger events or feedback from supernovae or AGN. These models also predict small sizes around 1-2 kpc at . The Naab et al. (2007) approach is also relevant because it shows that during the early formation at the assembly of massive ellipticals is dominated by mergers of gas-rich subcomponents and in situ star formation in a way characteristic of a dissipative collapse. Thereafter, smooth stellar accretion or minor/major mergers become more important and tend to dominate at , although major mergers are not always necessarily needed. In these simulations, the size evolution is mostly driven by the accreted stars. While the half-mass radius of the stars formed in situ (at high redshifts) remains almost constant independent of redshift, the accreted stars form an envelope whose half-mass radius increases smoothly with decreasing redshift around the compact and dense ”seed” formed at higher redshifts. If this scenario is correct, we may expect to find the compact, superdense cores ”hidden” inside present-day ETGs.
12 Summary and outlook
We presented a study of a 4.5m–selected sample of passive galaxies spectroscopically identified at 1.4–2 with the GMASS survey (Kurk et al. 2007a). This work benefits from ultradeep VLT+FORS2 optical spectroscopy complemented with multi-band photometry (0.4–8m) and HST imaging to investigate the physical, structural and evolutionary properties of these galaxies. The main results can be summarized as follows.
The GMASS passive galaxies have spectra and SEDs dominated by old stars and very weak or absent star formation. A comparison of the stacked rest-frame UV spectrum (equivalent to an integration time of 500 hours) with three different libraries of stellar population model spectra indicates an age of 0.7–2.8 Gyr for a metallicity range of 1.5–0.2 . Extending the model fitting at longer wavelengths using near-infrared and IRAC photometry helps to reduce the age–metallicity degeneracy and indicates ages of 1–1.6 Gyr, , -folding timescales 0.1–0.3 Gyr, where , and very low dust extinction. A comparison of the two libraries of model spectra which include TP-AGB stars shows that for a fixed age of 1 Gyr, the Maraston (2005) templates show a better agreement with the photometry than those of Charlot & Bruzual (2007) available to date.
Neither individual galaxies nor their stacked images are detected in the X-rays with Chandra data. This implies that a luminous AGN source ( erg/s) is absent or is very heavily obscured. However, the possibility of dust obscuration seems unlikely because none of the galaxies has been detected at 24m, with only one marginal exception of one galaxy at .
The stellar masses, estimated through the photometric SED fitting, are in the range of M⊙ and the specific star formation rates are very low ( Gyr-1). The stellar masses estimated with model spectra including TP-AGB stars are systematically lower by 0.1–0.2 dex than those estimated with models which do not include this phase of stellar evolution.
The HST+ACS morphological and surface brightness profile analysis indicate that the majority of the spectroscopically–selected passive galaxies have spheroidal morphologies consistent with being analogous to present-day ETGs. However, their sizes are smaller by a factor of 2-3 than at , and imply that the stellar mass surface and volume internal densities are up to 10 and 30 times larger respectively. If literature data are added to the GMASS sample, we find that only a few passive systems at lie within the size – mass relation, whereas the majority has systematically much smaller sizes.
The Kormendy relation at shows a large offset (2–3 mag) in effective surface brightness with respect to the local relation. This is difficult to explain with simple luminosity evolution models and requires that these high- compact and dense galaxies increase their size in order to reach the local Kormendy relation.
Samples of ETGs at lower redshifts () show that a larger fraction of passive galaxies follow the size – mass relation with respect to . The ETGs at which have the largest offsets with respect to the size – mass relation are the ones having the highest internal velocity dispersion, as expected from the ETG scaling relations. We find a hint that, for a fixed redshift 1, ETGs located within massive clusters are more preferentially located within the size – mass relation than ETGs located in lower density environments.
Superdense massive ETGs with 1 kpc are extremely rare at with respect to , and absent if kpc. However, it might be possible that compact and dense remnants are ”hidden” inside present-day ETGs if the size of ETGs grew through mechanisms such as the ”smooth envelope accretion”.
Submillimeter–selected galaxies are the only systems at 2 with sizes and mass surface densities (in gas) similar to those of the passive galaxies at 1–2. This suggests that a strong evolutionary link is present between these two galaxy populations.
It is currently unclear how the possible link between SMGs and compact passive galaxies fits within a more general framework which takes into account also the other galaxy populations so far identified at . A plausible scenario could be outlined as follows and summarized in Fig. 23. (1) Massive star-forming galaxies selected in the optical/near-IR are gas–rich disky systems with long–lived star formation (e.g. 0.5–1 Gyr, Daddi et al. 2005b ). (2) These systems can become unstable (e.g. Genzel et al. (2006)) or participate in major merger events with other gas-rich systems. (3) In both cases a major starburst event is triggered, and this phase could correspond to the SMG stage characterized by short-lived (0.1 Gyr) vigorous starburst (Tacconi et al. (2006, 2007)). (4) The concomitant AGN provides enough feedback to “quench” the star formation in massive systems (Daddi et al. 2007a), and (5) compact, superdense, passively evolving remnants are formed, (6) and evolve subsequently by increasing gradually their sizes with mechanisms like major dry merging and/or envelope accretion more or less rapidly depending on their mass and environment. (7) The majority of most massive ETGs reach the assembly completion around 0.7, while lower mass ETGs continue to assemble down to lower redshifts (downsizing).

Larger samples in the range of are needed to place stringent constraints on the mechanism(s) with which the sizes of high– passive galaxies grow as a function of cosmic time (e.g. dissipationless merging, envelope accretion, …). High–resolution spectroscopy in the near–infrared with the next generation of telescopes (e.g. E-ELT, JWST) will also be crucial to study the internal dynamics of these systems. Further studies at will shed light on the global processes which lead to formation and evolution of massive galaxies.
Acknowledgements.
We acknowledge the referee, Olivier Le Fevre, for the useful and constructive comments. We thank ESO for the generous allocation of observing time through the VLT Large Program 173.A–0687. We thank Mariangela Bernardi, Joel Brinchmann, Pat McCarthy, Georg Feulner, and Sadegh Khochfar for providing respectively unpublished information on SDSS galaxies with 350 km s-1, the SDSS stellar masses, the GDDS composite spectra, the data on SSFR, and the model predictions. Sadegh Khochfar, Thorsten Naab, Luca Ciotti, Carlo Nipoti and Gabriella De Lucia are acknowledged for the helpful discussion. AC is particularly grateful to Reinhard Genzel, Linda Tacconi and Natascha Förster-Schreiber for the warm hospitality at Max-Planck-Institut für Extraterrestrische Physik and the stimulating discussions. AC acknowledges support through a Bessel Prize of the Alexander von Humboldt Foundation.References
- Abraham et al. (2007) Abraham R., Nair P., McCarthy P.J. et al. 2007, ApJ,in press
- Alexander et al. (2003) Alexander D.M., Bauer F.E., Brandt W.N.et al 2003, AJ, 126, 539
- Arnouts et al. (2007) Arnouts S., Walcher C.J., Le Fevre O. et al. 2007, A&A, in press (2007arXiv0705.2438A)
- Beckwith et al. (2006) Beckwith S.V.W., Stiavelli M., Koekemoer A.M. et al 2006, AJ, 132, 1729
- Bell et al. (2006) Bell E., Naab T., McIntosh D.H. et al.2006, ApJ, 640, 241
- Bernardi et al. (2006) Bernardi M., Sheth R.K., Nichol R.C. et al. 2006, AJ, 131, 2018
- Bernardi et al. (2007) Bernardi M., Fritz A., Hyde J.B. et al. 2007, in preparation
- Berta et al. (2007) Berta S., Lonsdale C.J., Siana B. et al. 2007, ApJ, submitted
- Bertin & Arnouts (1997) Bertin E., Arnouts S. 1997, A&AS, 117, 393
- Blain et al. (2002) Blain A.W., Smail I., Ivison R.J., Kneib J.-P., Frayer D.T. 2002, PhR, 369, 111
- Blain et al. (2004) Blain A.W., Chapman S.C., Smail I., Ivison R. 2004, ApJ, 611, 725
- Boylan-Kolchin et al. (2006) Boylan-Kolchin M., Ma C.-P., Quataert E., 2006, MNRAS, 369, 1081
- Bournaud, Jog & Combes (2007) Bournaud F., Jog C.J. & Combes F. 2007, A&A, in press
- Borch et al. (2006) Borch A., Meisenheimer K., Bell E. et al. 2005, A&A, 453, 869
- Borys et al. (2003) Borys C., Chapman S., Halpern M., Scott D. 2003, MNRAS, 344, 385
- Bouché et al. (2007) Bouché N., Cresci G., Davies R. et al. 2007, ApJ, in press
- Brown et al. (2006) Brown M.J.I., Dey A., Jannuzi B.T. et al. 2006, ApJ, 654, 858
- Brusa et al. (2002) Brusa M., Comastri A., Daddi E. et al. 2002, ApJ, 581, L89
- Bruzual & Charlot (2003) Bruzual G. & Charlot S. 2003, MNRAS, 344, 1000
- Bruzual (2007) Bruzual G. 2007, Proceedings of the IAU Symposium No. 241 ”Stellar populations as building blocks of galaxies”, eds. A. Vazdekis and R. Peletier, Cambridge: Cambridge University Press, in press, arXiv:astro-ph/0703052
- Bundy et al. (2006) Bundy K., Ellis R.S., Conselice C.J. et al. 2006, ApJ, 651, 120
- Bundy et al. (2007) Bundy K., Treu T., Ellis R.S. 2007, ApJ, 665, L5
- Cassata et al. (2005) Cassata P., Cimatti A., Franceschini A. et al. 2005, MNRAS, 357, 903
- Castellano et al. (2007) Castellano M., Salimbeni S., Trevese D. et al. 2007, ApJ, in press
- Chabrier (2003) Chabrier G. 2003, PASP, 115, 763
- Chapman et al. (2005) Chapman S., Blain A.W., Smail I., Ivison R.J. 2005, ApJ, 622, 772
- Charlot & Bruzual (2007) Charlot S. & Bruzual G. 2007, in preparation
- Chary & Elbaz (2001) Chary R. & Elbaz D. 2001, 556, 562
- (29) Cimatti A., Mignoli M., Daddi E. et al 2002, A&A, 392, 395
- Cimatti et al. (2004) Cimatti A., Daddi E., Renzini A. et al. 2004, Nature, 430, 184
- Cimatti et al. (2006) Cimatti A., Daddi E., Renzini A. 2006, A&A, 453, L29
- Ciotti et al. (2007) Ciotti L., Lanzoni B., Volonteri M. 2007, ApJ, 658, 65
- Cotter et al. (2006) Cotter G., Simpson C., Bolton R.C. 2005, MNRAS, 360, 685
- Cowie et al. (1996) Cowie L.L., Songaila A., Hu E.M. & Cohen J.G. 1996, AJ, 112, 839
- Daddi et al. (2000) Daddi E. Cimatti A., Pozzetti L. et al. 2000, A&A, 361, 535
- (36) Daddi E., Cimatti A., Renzini A. et al. 2004b, ApJ, 617, 746
- (37) Daddi E., Renzini A., Pirzkal N. et al. 2005a, ApJ, 626, 680
- (38) Daddi E., Dickinson M., Chary R. et al. 20 05b, ApJL, 631, L13
- (39) Daddi E., Dickinson M., Morrison G. et al. 2007a, ApJ, in press
- (40) Daddi E., Alexander D.M., Dickinson M. et al. 2007b, ApJ, in press
- De Lucia et al. (2006) De Lucia G., Springel V., White S.D.M. et al. 2006, MNRAS, 366, 499
- di Serego Alighieri et al. (2005) di Serego Alighieri S., Vernet J., Cimatti A. et al. 2005, A&A, 442, 125
- Dominguez-Tenreiro et al. (2006) Dominguez-Tenreiro R., O orbe J., S iz A., Artal H., Serna A., 2006, ApJ, 636, L77
- Drory et al. (2004) Drory N., Bender R., Hopp U. 2004, ApJ, 616, L103
- Dunlop et al. (1996) Dunlop J., Peacock J., Spinrad H. et al. 1996, Nature, 381, 581
- Faber et al. (2005) Faber S.M., Willmer C.N.A., Wolf C. et al. 2007, ApJ, 665, 265
- Farrah et al. (2006) Farrah D., Lonsdale C.J., Borys C. et al. 2006, ApJ, 641, L17
- Feulner et al. (2005) Feulner G., Gabasch A., Salvato M. et al. 2005, ApJ, 633, L9
- Firth et al. (2002) Firth, A.E., Somerville R.S., McMahon R.G. et al. 2002, MNRAS, 332, 617
- Fontana et al. (2004) Fontana A., Pozzetti L., Donnarumma I. et al. 2004, A&A, 424, 23
- Förster-Schreiber et al. (2006) Förster Schreiber N.M., Genzel R., Lehnert M.D. et al. 2006, ApJ, 645, 1062
- Franceschini et al. (2006) Franceschini A., Rodighiero G., Cassata P. et al. 2006, A&A, 453, 397
- Franx et al. (2003) Franx M., Labbe’ I., Rudnick G. et al. 2003, ApJ, 587, L79
- Gavazzi & Scodeggio (1996) Gavazzi G. & Scodeggio M. 1996, A&A, 312, L29
- Genzel et al. (2006) Genzel R., Tacconi L.J., Eisenhauer F. et al. 2006, Nature, 442, 786
- Giacconi et al. (2002) Giacconi R., Zirm A., Wang J. et al. 2002, ApJS, 139, 369
- Giavalisco et al. (2004) Giavalisco M., Ferguson H.C., Koekemoer A.M. et al. 2004, ApJ, 600, L93
- Glazebrook et al. (2004) Glazebrook K., Abraham R.G., McCarthy P.J. et al. 2004, Nature, 430, 181
- Granato et al. (2004) Granato G., De Zotti G., Silva L. et al. 2004, ApJ, 600, 580
- Jorgensen et al. (1995) Jorgensen I., Franx M., Kjaergaard P. 1995, MNRAS, 273, 1097
- Juneau et al. (2005) Juneau S., Glazebrook K., Crampton D. et al. 2005, ApJ, 619, L135
- Kauffmann et al. (2003) Kauffmann G., Heckman T.M., White S.D.M. et al. 2003, MNRAS, 341, 33
- Kennicutt (1998) Kennicutt R. 1998, ARA&A, 36, 189
- (64) Khochfar S. & Silk J. 2006a, MNRAS, 370, 902
- (65) Khochfar S. & Silk J. 2006b, ApJ, 648, L21
- Kong et al. (2006) Kong X., Daddi E., Arimoto N. et al. 2006, ApJ, 638, 72
- Kriek et al. (2006) Kriek M., van Dokkum P.G., Franx M. et al. 2006, ApJ, 649, L71
- Kroupa (2001) Kroupa P. 2001, MNRAS, 322, 231
- (69) Kurk J. et al. 2007a, in preparation
- (70) Kurk J. et al. 2007b, in preparation
- Law et al. (2007) Law D.R., Steidel C.C., Erb D.K. et al. 2007, ApJ, in press
- Longhetti et al. (2005) Longhetti M., Saracco P., SevergniniP. et al. 2005, MNRAS, 361, 897
- Longhetti et al. (2007) Longhetti M., Saracco P., SevergniniP. et al. 2007, MNRAS, 374, 614
- Maraston (1998) Maraston C. 1998, MNRAS, 300, 872
- Maraston (2005) Maraston C. 2005, MNRAS, 362, 799
- Maraston et al. (2006) Maraston C., Daddi E., Renzini A. et al. 2006, ApJ, 652, 85
- Masjedi et al. (2006) Masjedi M., Hogg D., Cool R.J. et al. 2006, ApJ, 644, 54
- Masjedi et al. (2007) Masjedi M., Hogg D., Blanton M.R. 2007, ApJ, submitted
- McCarthy et al. (2004) McCarthy P.J., Le Borgne D., Crampton D. et al. 2004, ApJ, 614, L9
- McCarthy et al. (2007) McCarthy P.J., Yan H., Abraham R.G. et al. 2007, ApJ, 664, L17
- (81) McGrath E.J., Stockton A., Canalizo G. 2007, ApJ, in press
- (82) McGrath E., Stockton A., Canalizo G., Iye M., Maihara T. 2007, ApJ, submitted
- McIntosh et al. (2005) McIntosh D.H., Bell E.F., Rix H.-W. et al. 2005, ApJ, 632, 191
- Menci et al. (2006) Menci N., Fontana A., Giallongo E., Grazian A., Salimbeni S. 2006, ApJ, 647, 753
- Mignoli et al. (2005) Mignoli M., Cimatti A., Zamorani G. et al. 2005, A&A, 437, 883
- Naab et al. (2007) Naab T., Johansson P.H., Ostriker J.P., Efstathiou G. 2007, ApJ, 658, 710
- Narayanan et al. (2006) Narayanan D., Cox T.J., Robertson B. et al. 2006, ApJ, 642, L107
- (88) Nipoti C., Londrillo P., Ciotti L. 2003a, MNRAS, 342, 501
- (89) Nipoti C., Stiavelli M., Ciotti L., Treu T., Rosati P. 2003b, MNRAS, 344, 748
- Peletier et al. (1990) Peletier, R. F., Davies, R. L., Illingworth, G. D., Davis, L. E., & Cawson, M. 1990, AJ, 100, 1091
- Peng et al. (2002) Peng C.Y., Ho L.C., Impey C.D., Rix H.-W. 2002, AJ, 124, 266
- Perez-Gonzalez et al. (2007) Perez-Gonzalez G., Rieke G.H., Villar V. et al. 2007, ApJ, in press, arXiv:0709.1354
- Pirzkal et al. (2004) Pirzkal N., Xu C., Malhotra S. et al. 2004, ApJS, 154, 501
- Ponder et al. (1998) Ponder J.M., Burstein D., O’Connell R.W.,et al 1998, AJ, 116, 2297
- Pozzetti et al. (2003) Pozzetti L., Cimatti A., Zamorani G. et al. 2003, A&A, 402, 837
- Pozzetti et al. (2007) Pozzetti L., Bolzonella M., Lamareille F. et al. 2007, A&A, 474, 443
- Renzini (1981) Renzini A. 1981, Ann. Phys. Fr. 6, 87
- Renzini (2006) Renzini A. 2006, ARA&A, 44, 141
- Rettura et al. (2006) Rettura A., Rosati P., Strazzullo V. et al. 2006, A&A, 458, 717
- Rodighiero et al. (2007) Rodighiero G., Gruppioni C., Civano F. et al. 2007, MNRAS, 376, 416
- Salpeter (1955) Salpeter E.E. 1955, ApJ, 121, 161
- Saracco et al. (2005) Saracco P., Longhetti M., Severgnini P. et al. 2005, MNRAS, 372, L40
- Scarlata et al. (2006) Scarlata C., Carollo C.M., Lilly S.J. et al. 2007, ApJS, 172, 494
- Scott et al. (2002) Scott S.E., Fox M.J., Dunlop J.S. et al. 2002, 331, 817
- Shapley et al. (2004) Shapley A., Erb D.K., Pettini M., Steidel C.C., Adelberger K.L. 2004, ApJ, 612, 108
- Shen et al. (2003) Shen S., Mo H.J., White Simon D.M. et al. 2003, MNRAS, 343, 978
- Spinrad et al. (1997) Spinrad H., Dey A., Stern D. et al. 1997, ApJ, 484, 581
- Swinbank et al. (2006) Swinbank A.M., Chapman S.C., Smail I. et al. 2006, MNRAS, 465
- Tacconi et al. (2006) Tacconi L., Neri R., Chapman S.C. et al. 2006, ApJ, 640, 228
- Tacconi et al. (2007) Tacconi L., Genzel R., Smail I. et al. 2007, ApJ, submitted
- Thompson et al. (2005) Thompson R.I., Illingworth G., Bouwens R. et al. 2005, AJ, 130, 1
- Toft et al. (2007) S. Toft, P. van Dokkum, M. Franx et al. 2007, ApJ, in press
- Totani et al. (2001) Totani T.i, Yoshii Y., Iwamuro F. et al. 2001, ApJ, 558, L87
- Trujillo et al. (2006) Trujillo I., Feulner G., Goranova Y. et al. 2006, MNRAS, 373, L36
- Trujillo et al. (2007) Trujillo I., Conselice C., Bundy K. et al. 2007, MNRAS, in press
- van Dokkum (2005) van Dokkum P., Stanford S.A. 2003, ApJ, 585, 78
- van Dokkum (2005) van Dokkum P. 2005, AJ, 130, 2647
- Vanzella et al. (2006) Vanzella E., Cristiani S., Dickinson M. et al. 2006, A&A, 454, 423
- Yamada et al. (2005) Yamada T., Kodama T., Kobayashi Y. et al. 2005, ApJ, 634, 861
- Yan H. et al. (2004) Yan H., Dickinson M., Eisenhardt P. et al 2004, ApJ, 616, 63
- Yan et al. (2006) Yan R., Newman J.A., Faber S.M. et al. 2006, ApJ, 648, 281
- Wright et al. (2007) Wright S.A., Larkin J.E., Barczys M. et al. 2007, ApJ, 655, 51
- Wuyts et al. (2007) Wuyts S., Labb Ivo, Franx M. et al. 2007, ApJ, 655, 51
- Zirm et al. (2007) Zirm A.W., van der Wel A., Franx M. et al. 2007, ApJ, 656, 66