A Catalog of Local E+A(post-starburst) Galaxies selected from the Sloan Digital Sky Survey Data Release 5
Abstract
E+A galaxies have been interpreted as post-starburst galaxies based on the presence of strong Balmer absorption lines combined with the absence of major emission lines ([OII] nor H). As a population of galaxies in the midst of the transformation, E+A galaxies has been subject to an intense research activity. It has been, however, difficult to investigate E+A galaxies statistically since E+A galaxies are an extremely rare population of galaxies (1% of all galaxies in the local Universe).
Here, we present a large catalog of 564 E+A (post-starburst) galaxies carefully selected from half million spectra of the Sloan Digital Sky Survey Data Release 5. We define E+A galaxies as those with H equivalent width 5Å and no detectable emission in [OII] H. The catalog contains 564 E+A galaxies, and thus, is one of the largest of the kind to date. In addition, we have included the H line in the selection to remove dusty star-forming galaxies, which could have contaminated previous [OII]-based samples of E+A galaxies up to 52%. Thus, the catalog is one of the most homogeneous, let alone its size. The catalog presented here can be used for follow-up observations and statistical analyses of this rare population of galaxies.
keywords:
galaxies: evolution, galaxies:interactions, galaxies:starburst, galaxies:peculiar, galaxies:formation1 Introduction
Dressler & Gunn (1983, 1992) found galaxies with mysterious spectra while investigating high redshift cluster galaxies. The galaxies had strong Balmer absorption lines with no emission in [OII]. These galaxies are called “E+A” galaxies since their spectra looked like a superposition of that of elliptical galaxies (Mg5175, Fe5270 and Ca3934,3468 absorption lines) and that of A-type stars (strong Balmer absorption lines) 111Since some of E+A galaxies are found to have disk-like morphology (Couch et al., 1994; Dressler et al., 1994; Caldwell & Rose, 1997; Dressler et al., 1999), these galaxies are sometimes called “K+A” galaxies. However, Goto (2003) found that their E+A sample with higher completeness has early-type morphology. Following this discovery, we call them as “E+A” throughout this work.. The existence of strong Balmer absorption lines shows that these galaxies have experienced starburst recently (within a gigayear; Goto, 2004). However, these galaxies do not show any sign of on-going star formation as non-detection in the [OII] emission line indicates. Therefore, E+A galaxies have been interpreted as a post-starburst galaxy, that is, a galaxy which truncated starburst suddenly (Dressler & Gunn, 1983, 1992; Couch & Sharples, 1987; MacLaren, Ellis, & Couch, 1988; Newberry, Boroson, & Kirshner, 1990; Fabricant, McClintock, & Bautz, 1991; Abraham et al., 1996; Dressler et al., 1999; Poggianti et al., 1999; Dressler et al., 2004; Goto et al., 2003; Goto, 2004, 2005b, 2007). However, the reason why they started starburst, and why they abruptly stopped starburst remain one of the mysteries in galaxy evolution.
One of the major difficulties in investigating E+A galaxies has been their rarity: less than 1% galaxies are in the E+A phase in the present Universe (Goto et al., 2003). In this work, we solve this problem by creating a large catalog of 564 E+A galaxies carefully selected from the fifth public data release of the Sloan Digital Sky Survey (SDSS; Adelman-McCarthy et al., 2006). In addition to its size, due to the availability of the information on the H line, this catalog is one of the most homogeneous of the kind, nicely removing the contanimation from the H emitting galaxies. The catalog is publicly released222 http://www.ir.isas.jaxa.jp/∼tomo/ea5 so that world-wide researchers can utilize for statistical analyses and follow-up observations in various wavelength. Unless otherwise stated, we adopt the best-fit WMAP cosmology: (Bennett et al., 2003).
2 Catalog

2.1 Selection
Our new catalog of 564 E+A galaxies is based on the fifth public data release of the SDSS (Adelman-McCarthy et al., 2006). This is the final data release of the SDSS I , and containts spectra of 675,000 galaxies. The selection algorithm is similar to that in Goto (2005b), which we summarize below (also used in Goto, 2004; Yamauchi & Goto, 2005; Yagi & Goto, 2006; Yagi, Goto, & Hattori, 2006).
We only use those objects classified as galaxies (type=3, i.e., extended objects) with spectroscopically classified not to be a star (SpecClass is not a star) and the spectroscopic signal-to-noise 10 per pixel (in the continuum of the -band wavelength range). These criteria nicely remove contamination from nearby stars and star-forming regions. For these galaxies, we have measured H, [OII] and H equivalent widths (EWs) and obtained their errors using the flux summing method described in Goto et al. (2003). This flux summing technique is advantageous over the Guassian fitting method in measuring reliable line strengths for noisy spectra. For the H line, we only used the wider window of 40824122Å as a line region to ease the comparison with models (c.f. Goto et al., 2003). A histogram of H EW distribution is shown in Figure 1.
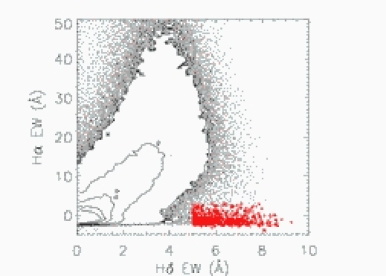
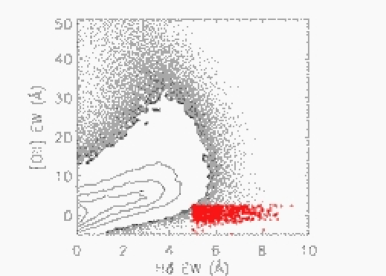
Once these lines are measured, we select E+A galaxies as those with H EW 5.0Å, and H EW 3.0Å, and [OII] EW 2.5Å333Absorption lines have a positive sign throughout this paper.. Although the criteria on emission lines allow small amount of emission in the E+A sample, they are relatively small amount in terms of the star formation rate (SFR). We also exclude galaxies at from our sample because of the sky feature at 5577Å . Our criteria are more strict than previous ones (e.g., H EW 4.0Å and [OII] EW 2.5Å), suppressing possible contaminations from other populations of galaxies (Goto, 2004). To illustrate our selection criteria, we plot H EW (emission) against H EW (absorption) for galaxies with SN() in Figure 2. E+A galaxies are shown in larger dots. In Figure 3, we show [OII] EW (emission) against H EW (absorption) for galaxies with SN(). Compared with the distribution of all galaxies shown in the contours, these two figures show that E+A galaxies have a unique emission/absorption line properties.
We stress an advantage in using the H line in selecting E+A galaxies. Previous samples of E+A galaxies were often selected based solely on [OII] emission and Balmer absorption lines either due to the high redshift of the samples or due to instrumental reasons. Goto et al. (2003) showed that such selections of E+A galaxies without information on H line would suffer from 52% of contamination from H emitting galaxies, whose morphology and color are very different from that of E+A galaxies (Goto et al., 2003). To back this up, Blake et al. (2004) selected E+A galaxies from the 2dF using only Balmer and [OII] lines to find that some E+A galaxies in their sample have the H line in emission. When H line is not available for the E+A selection, since H and H absorption features are subject to the emission filling, Blake et al. (2004) suggested that using three Balmer absorption lines (H, H and H) can supress the contamination from the galaxies with detectable H emission.
2.2 Catalog of 564 E+A galaxies
Among 451759 galaxies which satisfy the redshift and S/N criteria with measurable [OII], H and H lines, we have found 564 E+A galaxies. This is one of the largest sample of E+A galaxies to date. The 564 E+A galaxies span a redshift range of 0.03270.3421, within which H line is securely covered by the SDSS spectrograph.
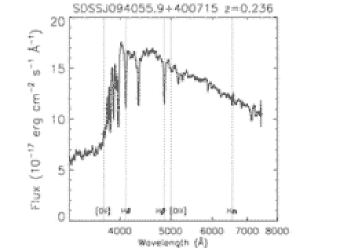
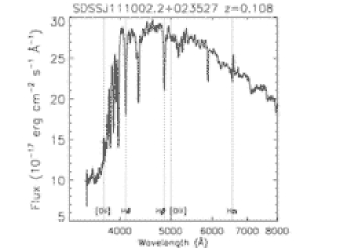
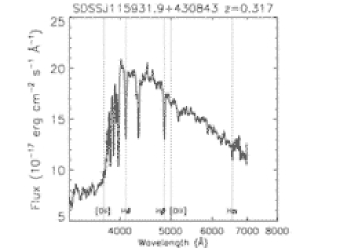
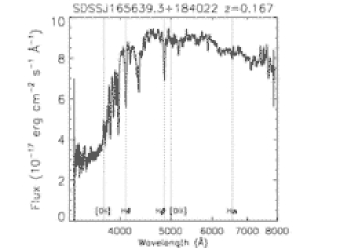
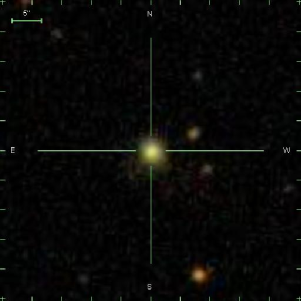
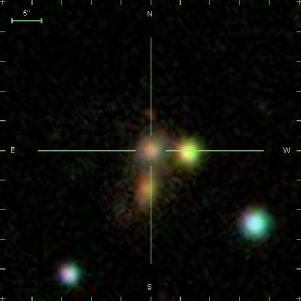
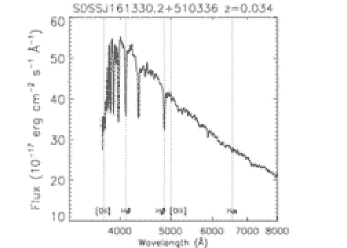
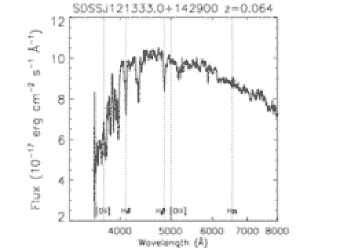
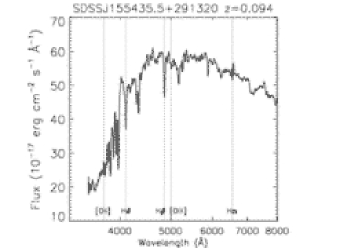
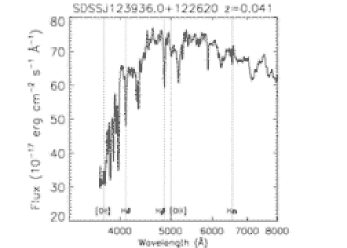
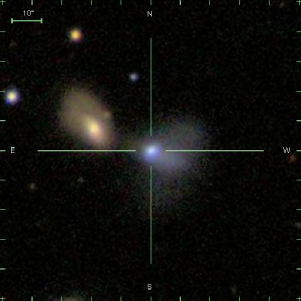
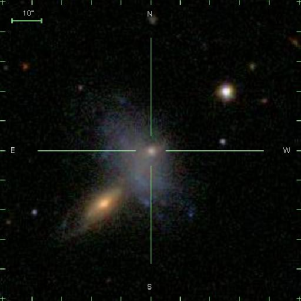
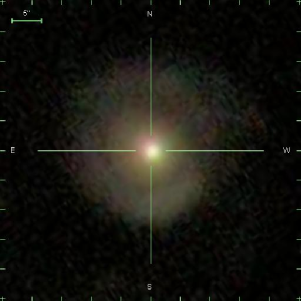
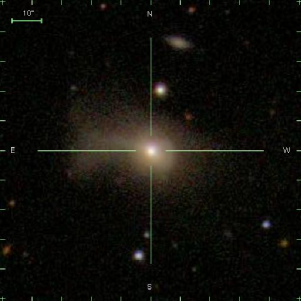
In Figure 4, we show four example spectra of E+A galaxies with strong H EW of 8.62-9.27Å. The corresponding -composite images are shown in Figure 5.
The catalog is publicly available in the Table at http://www.ir.isas.jaxa.jp/∼tomo/ea5 . The columns are name, z, RA, DEC, H EW, errors of H EW, [OII] EW, errors of [OII] EW, H EW, errors of H EW err, Petrosian magnitude in , signal-to-noise ratio in -band wavelength range, and a link to the NASA skyview and images. On the object names, there is also a link to the SDSS object explorer where one can see a -composite image and a GIF spectrum.
3 Discussion
3.1 Redshift Distribution

In Figure 6, we show the redshift distribution of the E+A galaxies. The median redshift is z=0.138.
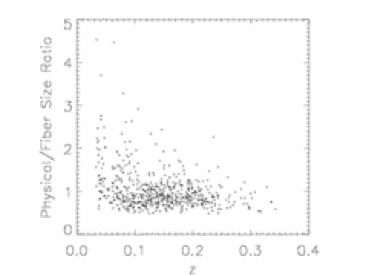
There is a possible peak at the lowest redshift bin (). The reason for the peak is not certain. We have checked all the images of E+A galaxies by eye to find that all of them show strong H absorption, confirming that our selection criteria work properly. We, however, suspect the aperture bias may be one of the causes; the SDSS fiber spectrograph only samples the light within the inner 3” (Strauss et al., 2002). This does not bring a large bias into the distant E+A galaxies, whose sizes are smaller (the median Petrosian 50% radius of our sample is 1.4”), but it does bring a large aperture bias to nearby E+A galaxies due to their large apparent size. At , the median physical size (taken from the Petrosian 50% light radius) of E+A galaxies is 2.0”, whereas the 3”-fiber only collects the light from the inner 1.5” of radius. In Figure 7, we plot the ratio of Petrosian 50% light radius to the fiber radius (1.5”) as a function of redshift. The figure shows that at , there are significant number of E+A galaxies a few times larger than the fiber size. Therefore, we recommend to use a low redshift cut (e.g., ; see also Gómez et al., 2003; Goto et al., 2003) when one performs statistical analysis on the sample.
These nearby E+A galaxies may have remaining star-formation activity outside of the 3” fiber. Nevertheless, it is also true that these galaxies have a post-starburst stellar population within the 3” of radius. It is still important to investigate what caused the central post-starburst in these galaxies, and thus, we keep these nearby E+A galaxies in our sample. Due to their larger apparent size, these E+A galaxies are suitable targets for spatially-resolved observations (e.g., Yagi, Goto, & Hattori, 2006; Yagi & Goto, 2006).
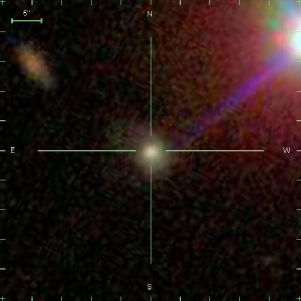
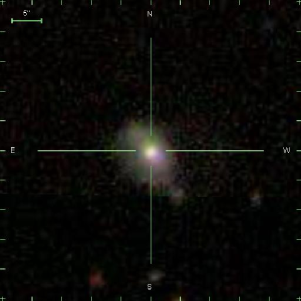
In Figure 8, we show four example spectra of E+A galaxies with a large apparent size of Petrosian 90% radius of . These E+A galaxies are large enough for detailed morphological/substructure studies. The corresponding -composite images are shown in Figure 9. There is a hint of possible dynamical disturbances in all four galaxies shown here.
3.2 E+As in the high redshift Universe
Our catalog of E+A galaxies provides us with a useful benchmark in studying the evolution of E+A galaxies in higher redshift Universe. It has been known that cosmic star formation density was higher at (Madau et al., 1996). According to Le Borgne et al. (2006), the fractions of the post-starburst galaxies was larger by a factor of 2 at (also see Roseboom et al., 2006). By comparing the fraction of E+A galaxies in different redshift, we can trace the cosmic star formation history in terms of the post-starburst galaxies.
In high redshift cluster environments, E+A galaxies are much more numerous; pioneering work were done by Dressler et al. (1999); Poggianti et al. (1999), who found E+A galaxies (H EW3Åand not detectable emission in [OII]) are significantly more common in 10 clusters at 0.370.56 than in the field (212% compared with 63%). Later, Tran et al. (2003) found 7-13% of E+A galaxies in three high redshift clusters at z=0.33,0.58, and 0.83, claiming that % of E+S0 members may have undergone the E+A phase if the effects of E+A downsizing and increasing E+A fraction as a function of redshift are considered (their selection criteria is and [OII] EW -5Å). In their search for field E+A galaxies among 800 spectra, Tran et al. (2004) measured the E+A fraction at 0.3 1 to be 2.7% 1.1%, a value lower than that in galaxy clusters at comparable redshifts. 444Note that Balogh et al. (1999) found smaller E+A fractions of 1.5% 0.8% in high redshift clusters (0.25). However, it has been controversial whether there is a discrepany on the fraction of E+A galaxies in the high redshift clusters. See Section 5.1 of Dressler et al. (2004) for detailed discussion.
Taken together with the much smaller fraction of E+A galaxies in the local field, the sudden increase of the fractions in distant clusters over all other environments suggests that there is something unique to this time and the environment that gives rise to so many E+A galaxies. It is also important to note that E+A galaxies may have heterogeneous origins; in the local Universe, E+As are preferentially found in the rarefied field regions, whereas at higher redshift, E+As are found in the cluster environment. Considering the large difference in time and the environment, E+As in the local field and high-z clusters may have been created by different physical mechanisms. For example, Goto (2005b) has shown that local (z0.1) E+A galaxies have more close companion galaxies than average galaxies, showing that the dynamical merger/interaction could be the physical origin of E+A galaxies. However, most E+A galaxies in the high redshift clusters are known not to be major mergers (Dressler et al., 1999).
3.3 Selection criteria of E+A galaxies
We used the selection criteria of HEW and H EW ,[OII] EW to select 564 E+A galaxies (Section 2.2). However, we caution readers that the number (or fraction) of the selected E+A galaxies strongly depends on the selection criteria. For example, if we loosen our criteria to H EW, the number of E+A galaxies increases to 1062 (almost twice as numerous). With H EW, 2298 E+A galaxies are selected (4 times more numerous). Therefore, when one compares samples of E+A galaxies selected from different data sets, it is important to synchronize the selection criteria. Especially, one compares to a sample at higher redshift, inconsistency in selection criteria can produce spurious evolutionary effect.
4 Summary
We have constructed one of the largest catalogs of 564 local E+A (post-starburst) galaxies carefully selected from the SDSS DR5. The sample provides us with a useful tool to investigate statistical properties and/or for follow-up observations of this rare, but important population of galaxies.
Acknowledgments
We are grateful to the referee, Prof.A.Dressler, for many insightful comments that improved the paper significantly. We thank Dr. M.Yagi, and C.Yamauchi for useful discussion.
The research was financially supported by the Sasakawa Scientific Research Grant from The Japan Science Society.
This research was partially supported by the Japan Society for the Promotion of Science through Grant-in-Aid for Scientific Research 18840047.
Funding for the creation and distribution of the SDSS Archive has been provided by the Alfred P. Sloan Foundation, the Participating Institutions, the National Aeronautics and Space Administration, the National Science Foundation, the U.S. Department of Energy, the Japanese Monbukagakusho, and the Max Planck Society. The SDSS Web site is http://www.sdss.org/.
The SDSS is managed by the Astrophysical Research Consortium (ARC) for the Participating Institutions. The Participating Institutions are The University of Chicago, Fermilab, the Institute for Advanced Study, the Japan Participation Group, The Johns Hopkins University, Los Alamos National Laboratory, the Max-Planck-Institute for Astronomy (MPIA), the Max-Planck-Institute for Astrophysics (MPA), New Mexico State University, University of Pittsburgh, Princeton University, the United States Naval Observatory, and the University of Washington.
References
- Abraham et al. (1996) Abraham R. G., et al., 1996, ApJ, 471, 694
- Adelman-McCarthy et al. (2006) Adelman-McCarthy J. K., et al., 2006, ApJS, 162, 38
- Balogh et al. (1999) Balogh M. L., Morris S. L., Yee H. K. C., Carlberg R. G., Ellingson E., 1999, ApJ, 527, 54
- Bennett et al. (2003) Bennett C.L., et al., 2003, ApJS, 148, 1
- Blake et al. (2004) Blake C., et al., 2004, MNRAS, 355, 713
- Caldwell & Rose (1997) Caldwell N., Rose J. A., 1997, AJ, 113, 492
- Couch & Sharples (1987) Couch W. J., Sharples R. M., 1987, MNRAS, 229, 423
- Couch et al. (1994) Couch W. J., Ellis R. S., Sharples R. M., Smail I., 1994, ApJ, 430, 121
- Dressler et al. (2004) Dressler A., Oemler A. J., Poggianti B. M., Smail I., Trager S., Shectman S. A., Couch W. J., Ellis R. S., 2004, ApJ, 617, 867
- Dressler et al. (1999) Dressler A., Smail I., Poggianti B. M., Butcher H., Couch W. J., Ellis R. S., Oemler A. J., 1999, ApJS, 122, 51
- Dressler & Gunn (1992) Dressler A., Gunn J. E., 1992, ApJS, 78, 1
- Dressler et al. (1994) Dressler A., Oemler A. J., Butcher H. R., Gunn J. E., 1994, ApJ, 430, 107
- Dressler & Gunn (1983) Dressler A., Gunn J. E., 1983, ApJ, 270, 7
- Fabricant, McClintock, & Bautz (1991) Fabricant D. G., McClintock J. E., Bautz M. W., 1991, ApJ, 381, 33
- Gómez et al. (2003) Gómez P. L., et al., 2003, ApJ, 584, 210
- Goto (2007) Goto T., 2007, MNRAS, 377, 1222
- Goto (2005b) Goto T., 2005b, MNRAS, 357, 937
- Goto (2004) Goto T., 2004, A&A, 427, 125
- Goto et al. (2003) Goto T., Yamauchi C., Fujita Y., Okamura S., Sekiguchi M., Smail I., Bernardi M., Gomez P. L., 2003, MNRAS, 346, 601
- Goto et al. (2003) Goto T., et al., 2003, PASJ, 55, 771
- Goto (2003) Goto T., 2003, PhD. Thesis, The University of Tokyo
- Le Borgne et al. (2006) Le Borgne D., et al., 2006, ApJ, 642, 48
- MacLaren, Ellis, & Couch (1988) MacLaren I., Ellis R. S., Couch W. J., 1988, MNRAS, 230, 249
- Madau et al. (1996) Madau P., Ferguson H. C., Dickinson M. E., Giavalisco M., Steidel C. C., Fruchter A., 1996, MNRAS, 283, 1388
- Newberry, Boroson, & Kirshner (1990) Newberry M. V., Boroson T. A., Kirshner R. P., 1990, ApJ, 350, 585
- Poggianti et al. (1999) Poggianti B. M., Smail I., Dressler A., Couch W. J., Barger A. J., Butcher H., Ellis R. S., Oemler A. J., 1999, ApJ, 518, 576
- Roseboom et al. (2006) Roseboom I. G., et al., 2006, MNRAS, 373, 349
- Strauss et al. (2002) Strauss M. A., et al., 2002, AJ, 124, 1810
- Tran et al. (2004) Tran K.-V. H., Franx M., Illingworth G. D., van Dokkum P., Kelson D. D., Magee D., 2004, ApJ, 609, 683
- Tran et al. (2003) Tran K.-V. H., Franx M., Illingworth G., Kelson D. D., van Dokkum P., 2003, ApJ, 599, 865
- Yagi, Goto, & Hattori (2006) Yagi M., Goto T., Hattori T., 2006, ApJ, 642, 152
- Yagi & Goto (2006) Yagi M., Goto T., 2006, AJ, 131, 2050
- Yamauchi & Goto (2005) Yamauchi C., Goto T., 2005, MNRAS, 359, 1557