22email: frits@astro.columbia.edu 33institutetext: Jelle Kaastra 44institutetext: SRON Netherlands Institute for Space Research, Sorbonnelaan 2, 3584 CA Utrecht, the Netherlands
Sterrenkundig Instituut, Universiteit Utrecht P.O. Box 80000, NL-3508 TA Utrecht, the Netherlands 55institutetext: Takaya Ohashi 66institutetext: Department of Physics, School of Science, Tokyo Metropolitan University, 1-1 Minami-Osawa, Hachioji, Tokyo 192-0397, Japan 77institutetext: Philipp Richter 88institutetext: Institut füer Physik, Universität Potsdam, Am Neuen Palais 10, 14469 Potsdam, Germany 99institutetext: Andrei Bykov 1010institutetext: A.F. Ioffe Institute of Physics and Technology, Russian Academy of Sciences, 26 Polytekhnicheskaya, St. Petersburg 194021, Russia 1111institutetext: Jukka Nevalainen 1212institutetext: Observatory, University of Helsinki, P.O. Box 14, 00014 Tähtitornimäki, Finland
Future instrumentation for the study of the Warm-Hot Intergalactic Medium
Abstract
We briefly review capabilities and requirements for future instrumentation in UV- and X-ray astronomy that can contribute to advancing our understanding of the diffuse, highly ionised intergalactic medium.
Keywords:
instrumentation: spectrographs instrumentation: photometers ultraviolet: general X-rays: general -rays: general1 Introduction
A convergence of recent theoretical and observational work has generated rapidly growing interest in the physics of a highly ionised intergalactic medium (IGM). At low redshifts, this phase of the IGM likely holds the balance of the baryon mass density not accounted for by the mass densities in stars, diffuse gas in galaxies, the local Ly forest, the Intracluster Medium (ICM) in galaxy clusters and groups, etc. (Fukugita & Peebles 2004). Model calculations suggest that in fact the baryon density in the IGM could indeed be comparable to the summed baryon densities of the known mass components, as would be required to reach the baryon density determined using independent arguments (big bang nucleosynthesis and the measured abundances of the light elements, and the measured fluctuation spectrum of the cosmic microwave background).
It is clear that the study of non-equilibrium phenomena in the low-redshift diffuse intergalactic medium, both within and outside bound structures, can produce a wealth of information on a large range of important astrophysical problems, ranging from the formation of galaxies to the generation of the first dynamically important magnetic fields. In this paper, we will attempt to summarise the requirements and prospects for significant progress on the observational study of these phenomena, considered in the light of planned or proposed instrumentation. We begin with a slightly abstract discussion of required and desired instrumental capabilities (spectral resolution, sensitivity, etc.), before we consider specific future or proposed instruments.
2 X-ray and UV spectroscopy of the ICM and IGM
2.1 Imaging spectroscopy (emission line imaging)
Imaging X-ray spectroscopy will play a crucial role in the study of non-equilibrium phenomena in highly ionised diffuse media. High spectroscopic resolution is a requirement here, not only for the measurement (if possible) of velocity fields and the application of standard emission line plasma diagnostics, but also simply as a means to separate extragalactic emission from the bright and rich foreground emission from hot gas in and around our Milky Way Galaxy, the (time variable) contribution from geocoronal and heliospheric charge exchange excitation by the Solar wind (Wargelin et al. 2004) and to suppress the continuum background from unresolved point sources and non-X-ray instrumental backgrounds.
To start with the latter point (suppression of continuum backgrounds for the detection of line emission from highly ionised species in the WHIM), we need a rough estimate for the expected emission line intensity; the extragalactic background intensity in the soft X-ray band (below 653 eV, corresponding to O viii Ly at ) can be inferred from an extrapolation of the smooth isotropic background above 1 keV. We assume that the emission is dominated by collisional excitation, ignoring the recombination-excited contribution, as well as the contribution from resonant excitation by the X-ray background continuum (Churazov et al. 2001). Even though the oxygen ionisation balance is probably largely determined by X-ray photoionisation, the line emission rate will respond strongly to heating of the gas, as it passes through the structure formation shocks. As far as oxygen is concerned, the WHIM is a hybrid medium, with the ionisation provided by photons, but the cooling (line emission) provided by electron collisions.
A simple estimate for the expected intensity in the resonance lines of O vii and O viii is thus
| (1) | |||||
| (2) |
with the absolute elemental abundance, the fractions of atoms in the relevant ionisation state, the path length, the clumping factor (). From explicit simulations (see for instance Davé et al. 2001), we estimate the clumping factor . The average should really be carried out explicitly over redshift as well, since the WHIM rapidly evolves at small redshift.
is the thermal average of the collisional excitation cross section times the electron-ion velocity . A useful discussion of thermal collisional excitation rates is given by Mewe (Mewe 1999; his Sect. 8.1; see also Kaastra et al. 2008 - Chapter 9, this volume). Very roughly, for a H-like ion, the absolute collision cross section is of order ( is the Bohr radius, the nuclear charge). For electron temperatures small compared to the excitation energy (which is what we are dealing with here), a strong temperature dependence in results from the small, strongly temperature-dependent fraction of the electrons that have sufficient energy to excite the ions. The steep functional dependence of is almost entirely determined by the temperature dependence of this fraction. Mewe (1999) gives very useful numerical expressions for the excitation rates, as well as references to more detailed, precise data. We use these precise rates in our estimate for , since the analytical approximations, while nicely reproducing the functional shape of the temperature dependence, fail in absolute value by more than an order of magnitude for electron temperatures far below threshold.
For the O viii Ly and O vii resonance lines, a very rough estimate for the rate is plotted as a function of electron temperature in Fig. 1. We have assumed one-tenth Solar abundance, for both ions (at the low densities characteristic of the average WHIM, the ionisation fractions have to be calculated from the photoionisation balance and depend mostly on density rather than on electron temperature; strictly speaking, should have been taken inside the average for the density), and , with the Hubble constant, as suggested by the simulations (the WHIM does not rise until after redshifts (Davé et al. 2001), and the integral will of course be weighted towards the higher densities, at the smaller redshifts).

This faint line emission has to be detected against at least the extragalactic continuum background (assuming it is largely unresolved, and that the background is dominated by the astrophysical background). If we adopt an average background continuum intensity of photons cm-2 s-1 sr-1 keV-1 at keV (see McCammon & Sanders 1990, their Fig. 12), we need an energy resolution of order eV at 0.5 keV in order to keep the continuum background in a spectral resolution element comparable to the emission line count per resolution element. Obviously, higher contrast in emission line images requires higher spectral resolution.
The soft background ( keV) is largely dominated by the foreground emission from our Galaxy and its immediate environment. As was dramatically demonstrated by the Wisconsin/Goddard X-ray Quantum Calorimeter (XQC) rocket experiment (McCammon et al. 2002), most of this ’foreground’ emission is in emission lines, dominated by the O vii and O viii resonance lines. But normalising simple models for the emission from K, Solar abundance gas to the measured emission line intensities indicates that there will be numerous weaker foreground lines, between which the weak redshifted, extragalactic emission lines will have to be detected. This will likely be impossible with data that does not at least have a resolution of eV. For an impression of what the foreground spectrum might look like, see Fig. 13 in Kaastra et al. (2008) - Chapter 9, this volume. Note that due to the complexity of this foreground, convincing detection and interpretation of the extragalactic line emission will likely depend on a sophisticated simultaneous analysis of the Galactic emission.
As far as spectroscopic diagnostics are concerned, at eV, the important He-like O vii triplet is resolved. Resolving the thermal width of oxygen emission lines will require a very high resolving power . More likely, the velocity dispersion observed in a finite spatial volume will be dominated by turbulence and bulk motion in the WHIM, with characteristic amplitude probably several 100 km s-1, which is resolved at eV in observations in which the individual WHIM filaments are spatially just resolved.
The predicted emission line intensities are very small, and an equally important instrument characteristic is the grasp (product of field of view and effective area ) of the imaging spectrometer. With an intensity of photons cm-2 s-1 sr-1, one gets less than 10 counts in s of exposure if the grasp is smaller than cm2 sr, or cm2 deg2. For an effective mapping and true physical characterisation of the WHIM (as opposed to a single detection experiment), one probably needs at least two orders of magnitude larger grasp.
From the large scale structure/hydrodynamics simulations, the characteristic cross section of the WHIM filaments is about 10 Mpc, which spans an angle of rad, or half a degree, at redshift . To purely resolve the WHIM structure, the angular resolution requirements therefore appear to be modest; instead, you need a large field of view of order at least a square degree to effectively map the structure. But low angular resolution, apart from contaminating the signal with unresolved point sources, will also introduce ambiguity in the precise location of the emitting ions with respect to other components of the large scale structure. At angular resolution arcmin, one can no longer distinguish truly diffuse intergalactic metal line emission, from emission due to small-scale galactic winds (and the interpretation of the data would involve assuming an explicit, complete model for the galactic feedback on the IGM). Finally, in addition to angular resolution requirements, any proposed optical system will also have to satisfy a contrast (or dynamic range) requirement: if too large a fraction of the photons are reflected or scattered far from the image core (i.e. large wings on the point source response function), bright clusters in an image will outshine the faint WHIM emission. This may be a non-negligible problem, since the core densities of clusters and the average densities of the WHIM differ by a factor , which result in a surface brightness contrast of a factor of up to 1000.
At the time of writing, a number of CCD-based imaging experiments, on the Chandra, XMM-Newton, and Suzaku observatories, are producing data. The spectral resolution is limited to eV, which makes it possible to discern and partially resolve C vi, N vii, O vii and O viii, and Fe xvii line emission, but not without a model for contaminating fore- and backgrounds. Much more promising are imaging arrays of cryogenic spectrometers (microcalorimeters and Super Conducting Tunneling Junctions, STJ), and such instruments are part of the baseline for the Constellation-X and XEUS observatories (for general descriptions of the operational principles of these types of detector, see for instance Enss 2005). In addition, dedicated soft X-ray, wide field microcalorimeter-based experiments have been proposed with the explicit aim of finding and characterising the WHIM (DIOS, NEW, EDGE). A brief description of these future instruments follows.
Both Constellation-X111http://constellation.gsfc.nasa.gov/ (NASA), and XEUS 222http://www.rssd.esa.int/index.php?project=XEUS&page=index (ESA) are designed as general facilities, with a wide energy band, up to 10 keV (and a hard X-ray telescope above keV, on Constellation-X), and, consequently, a rather long focal length and relatively small field of view (10 m focal length and F/8 focal ratio for Constellation-X; 35 m focal length for XEUS and F/10 focal ratio for XEUS). In the Constellation-X focal plane, an array of microcalorimeters provides imaging spectroscopy. In the baseline designs, the microcalorimeters are of the Transition Edge Sensor (TES) variety, with a design energy resolution goal of eV. The field of view is approximately 5 arcmin in diameter, and the spectrometer has an effective area of m2 at sub-keV energies, achieved by flying four identical telescopes in parallel. Constellation-X also has a novel reflection grating spectrometer, which can be applied to high resolution spectroscopy of point sources. XEUS has been designed with two different types of cryogenic spectrometers in mind, Superconducting Tunneling Junctions and TES microcalorimeters; the latter are currently the baseline. The energy resolution goals are 1 eV (STJ) and 2 eV (TES). The field of view of the cryogenic spectrometer will be approximately 0.75 arcmin diameter, with an effective area m2 at low energies. Note that all cryogenic spectrometers need extensive blocking of UV/optical/infrared radiation, and the possible beam filters all have considerable low energy X-ray photoelectric absorption, resulting in sensitivities that steeply decline with decreasing photon energy. The effective areas listed above therefore are no more than easy reference numbers; for detailed sensitivity calculations, be sure to consult the relevant observatory technical information.
From the above characteristics, it is clear that the cryogenic imaging spectrometers on Constellation-X and XEUS will have sufficient energy resolution, but that their efficiency is limited. The relevant grasps are cm2 deg2, and cm2deg2 for Constellation-X and XEUS, respectively. Note that these figures do not include the transmission of the optical blocking filters, which lowers the grasps by factors of a few at the X-ray energies of interest. In addition, the fields of view are not ideally matched to the problem. We will probably see line emission from the WHIM in (possibly) most deep observations, but only from a series of individual lines-of-sight.
By contrast, there has also been a number of proposals for smaller missions, that aim at detection of the WHIM line emission with a dedicated wide field of view, short focal length, high spectral resolution, soft X-ray imaging spectrometer. These characteristics (with the exception of the spectral resolution) are interlocking: a short focal length promotes sensitivity to faint emission against non-astrophysical background, allows a large field of view, but limits the energy response to low X-ray energies (which is ideal for study of the WHIM). Coupled with a high resolution imaging spectrometer, this is the natural design for study of extended diffuse faint soft X-ray line emission. We will therefore describe these mission concepts in somewhat greater detail.
The Diffuse Intergalactic Oxygen Surveyor (DIOS) concept originated in Japan (Ohashi et al. 2006). It is built around an imaging array of TES microcalorimeters, with an energy resolution of 2 eV, a 50 arcmin diameter field of view, an effective area in the O K band of cm2, which gives a grasp of order 100 cm2 deg2. The mission lifetime should be yrs. With this grasp and field of view, the WHIM should clearly come into view; the total fraction of the baryonic mass density probed could be as high as 20 %.
A similar concept was studied by the Dutch: NEW, or the Netherlands Explorer of the Web (Den Herder et al. 2006). In outline, it is very similar to DIOS. It has a 242 array of TES microcalorimeters, viewing a deg2 field of view at 2 eV energy resolution. The effective area is substantially larger than DIOS, with a 500 cm2 baseline design in the O K band.
Other proposed missions incorporate the imaging spectroscopy of the high-ionisation metal emission lines with arrays of cryogenic spectrometers, but complement this with absorption line spectroscopy (Estremo and EDGE). For convenience, we will discuss these missions below, in the section on X-ray absorption spectroscopy.
Finally, the broad Hydrogen Ly absorption lines discussed in Richter et al. (2008) - Chapter 3, this volume, trace the (small) neutral H content of the highly ionised medium. One can search for the corresponding faint Ly emission lines, which would have to be done with a high-resolution UV imaging spectrometer. Work is proceeding on a balloon-borne experiment, to perform a first survey of line emission in the Å band; this band is accessible from a balloon, and is limited by strong atmospheric absorption on either end (FIREBALL, or Faint Intergalactic Redshifted Emission BALLoon 333http://www.srl.caltech.edu/sal/igm_project.htm). With a proven spectrometer concept, a survey from space could then follow up at shorter wavelengths. The Å window contains H Ly 1216 Å at , C iv 1550 Å at , and O vi 1033 Å at . The instrument, based on an echelle spectrograph, images approximately arcsec2, and can send the light of 20 individual, contiguous 7 arcsec wide strips through the spectrograph. The resolving power set by the 7 arcsec slit size is in the first version of the instrument. The sensitivity is such that a diffuse Ly intensity of photons cm-2 s-1 sr-1 can be detected in a single night, which corresponds to emission from regions of overdensity .
2.2 Absorption line spectroscopy
2.2.1 Ultraviolet
As discussed by Richter et al. 2008 - Chapter 3, this volume, UV absorption spectroscopy of intervening hydrogen and metal absorbers currently represents the most sensitive method to study the statistical and physical properties of warm-hot intergalactic gas at low redshift. During the last years, UV spectra of several low-redshift QSOs obtained with the Far Ultraviolet Spectroscopic Explorer (FUSE) and the Space Telescope Imaging Spectrograph (STIS) aboard the Hubble Space Telescope (HST) have been used to study the properties of WHIM absorbers in great detail. By now, however, both instruments unfortunately are out of commission due to technical problems and therefore additional UV observations of the WHIM have to await future space-based UV instruments, which are discusssed in the following.
While the spectral resolution of the former FUSE and STIS UV spectrographs () were sufficient to reliably identify and analyse absorption features from the WHIM at low redshifts (in contrast to current X-ray spectrographs; see Richter et al. 2008 - Chapter 3, this volume), the most important requirement for the next-generation UV spectrographs is a substantial gain in sensitivity. Only with more sensitive UV instruments will it be possible to achieve better statistics on the distribution and properties of WHIM absorbers along a large number of QSO sightlines at low and intermediate redshifts and to obtain spectra with higher signal-to-noise ratios. The latter aspect, in particular, is crucial to minimising systematic errors in the data analysis and interpretation of the UV absorption signatures.
Fortunately, the next UV spectrograph most likely will become available already in late 2008, when the Cosmic Origins Spectrograph (COS) will be installed on HST during the fifth and final service mission (SM5) of HST (note that SM5 is nothing but the reinstated SM4 that was canceled in 2004). SM5 (flight STS125) currently is scheduled for August 7, 2008 (see www.nasa.gov for regular updates on the NASA space shuttle launch schedule). COS is designed for high throughput, medium-resolution () spectroscopy of point sources in the UV wavelength range. The COS instrument has two channels, a far-UV channel covering Å, and a near-UV channel operating in the range Å. The COS instrument has been built with maximum effective area as primary constraint. It will provide a gain in sensitivity of more than one order of magnitude compared to STIS and other previous spectrographs (e.g., GHRS) installed on the HST. COS is therefore expected to deliver a large number of high-quality spectra of low- and intermediate-redshift QSOs and AGN. These data will allow us to better understand the baryon budget and physical conditions in intervening O vi systems and broad Ly absorbers (BLAs) and the space distribution of warm-hot intergalactic gas in relation to galactic structures. Note that it is also planned to repair STIS during the same service mission, so that there will be two powerful UV spectrographs with different spectral capabilities available at the HST at the same time.
Next to the COS and STIS instruments aboard the HST, there possibly will be another powerful UV instrument available at the beginning of the next decade. The Russian-led World Space Observatory (WSO) is an independent UV space telescope and is designed to represent an international follow-up of the HST mission. Next to Russia, other countries such as China, Spain, Italy, Germany are also involved in the WSO project and partly contribute with either money and/or instrumentation. The WSO will be equipped with a 1.7 m primary mirror, two high-resolution spectrographs with operating in the FUV and UV wavelength bands Å, and Å, and a low-resolution spectrograph () for the range Å (for details and further information see WSO homepage.444http://wso.inasan.ru A big advantage of the WSO is that it represents an instrument entirely dedicated to the UV range. This will enable observers also to aim for long integration times of relatively faint (i.e. distant) UV background sources without facing competition with observers in other wavelength bands (as is the case for COS on HST, for instance). In addition, WSO observations of intermediate-redshift QSOs will be particularly important to search for moderately redshifted WHIM EUV absorption from Ne viii and Mg x (see Richter et al. 2008 - Chapter 3, this volume, Sect. 2.2.1) that can be observed in the WSO FUV band. Consequently, the WSO will represent another very powerful UV instrument to study ultraviolet absorption signatures of the WHIM at low and intermediate redshift.
Next to STIS, COS, and the WSO, which by now represent approved science missions, there are various future mission concepts for space-based UV instruments, for instance as part of NASA’s Origins Program.555 http://www.nasa.gov/home/hqnews/2004/jul/HQ-04246_mission_concepts.html Among these concepts, the Baryonic Structure Probe (PI: Kenneth Sembach, STScI) and the High Orbit Ultraviolet-visible Satellite (HORUS; PI: Jon Morse, Arizona State University) represent particularly interesting concepts for future UV observatories, as these instruments would be able to investigate warm-hot intergalactic gas in the ultraviolet in both absorption and emission.
2.2.2 X-ray
As discussed in Richter et al. 2008 - Chapter 3, this volume, detecting X-ray line absorption from the highly ionised light- and medium- elements in the WHIM (in practice, C, perhaps N, O, Ne, perhaps Fe) is challenging, due to the fact that the expected equivalent widths are very small, as well as to the fact that the absorption is expected to be sparse, at any spectrometer sensitivity currently foreseen. The absorption will be sparse in two senses: a single absorbing filament of WHIM gas will produce only one, or at most a few absorption lines; and on any line of sight to a bright, distant background continuum source we expect to be able to see only of order a few filaments at most. It is conceptually somewhat misleading to refer to the intergalactic X-ray absorption lines as the ’X-ray Forest’ counterpart to the Ly Forest (Hellsten et al. 1998). Nevertheless, X-ray absorption spectroscopy of the WHIM complements study of its line emission in very important ways: the sensitivity of absorption spectroscopy, for a given spectrometer sensitivity, only depends on the continuum flux of the background source, and, given sufficiently bright sources, studying the WHIM in absorption is potentially more sensitive to small column density filaments, as well as more distant filaments. Detecting the line emission from distant and/or low-density filaments will always be difficult. Finally, it is possible in principle to build (very) high resolution slitless grating spectrometers for point-source spectroscopy, and one could study the velocity structure (and hence the physical structure) of individual filaments, and the relation between, for instance, Ly and O vi absorbers, and more highly ionised X-ray absorbers. Performing similarly high resolution diffuse emission line spectroscopy will probably be even much harder. On the other hand, given the sparseness of suitable backlighter sources, the absorption spectroscopy will most likely not reveal much about the full 3D topology of the WHIM, as the emission line imaging naturally does.
Detecting the weak X-ray absorption lines will require high spectral resolution and high sensitivity, the latter to ensure a sufficiently large number of photons per resolution element, as well as to make sure sufficiently weak (and therefore numerous) sources can be used, thereby covering both the sky as well as providing enough redshift depth. The appropriate scale for the spectral resolution is set by the thermal width of the lines. In the worst case (no large scale or turbulent velocity fields) the C, N, O, and Fe resonance lines will rapidly saturate, and the equivalent width will approximately stall at the value it attains at the thermal width. The thermal width, expressed as the Gaussian velocity dispersion, is km s-1 for oxygen ions. In Kaastra et al. 2008 - Chapter 9, this volume (their Fig. 9), we show the curve of growth for O vii and O viii resonance lines; at the thermal width, these first saturate at equivalent width mÅ, which corresponds to a resolving power of 5000. The equivalent number for the resolution in energy measure is eV.
In Richter et al. 2008 - Chapter 3, this volume, we reproduced a cumulative probability distribution, derived from large scale structure/hydrodynamics simulations, for the O vii and O viii column densities. At equivalent width mÅ, the expectation value for the number of filaments per unit redshift producing that EW or larger on a random line of sight is approximately . A requirement for a future experiment could therefore be phrased as ’the capability to detect mÅ equivalent width absorption lines in multiple high redshift () continuum sources’.
The grating spectrometers on Chandra and XMM-Newton do not have sufficient resolution; they have mÅ at 20 Å (the Chandra HETGS has better resolution, but only very limited efficiency in the O K band). The results of searches on very bright targets with these instruments are described in Richter et al. (2008) - Chapter 3, this volume.
The imaging X-ray spectrometers discussed above can also be used for absorption spectroscopy, of course. The relatively coarse energy resolution (few eV) is not better than the resolving power we currently have with the grating spectrometers on Chandra and XMM-Newton (Å corresponds to eV at 20 Å), and the improvement in sensitivity would come entirely from the larger effective area. In order to significantly improve our understanding of the WHIM by X-ray absorption spectroscopy with practicable cryogenic spectrometers, the effective area should therefore be appreciably larger than those of the Chandra and XMM-Newton grating spectrometers. Nevertheless, a survey based on moderate sensitivity spectroscopy of, roughly speaking, the extragalactic sources in the 4U catalog is not likely to produce much relevant information, beyond bare detection of the WHIM.
Even though the energy resolution of the microcalorimeter spectrometer envisioned for XEUS is not ideal for the intergalactic absorption spectroscopy, pointing 5 m2 of spectroscopic effective area at a bright continuum source will of course produce a very high signal-to-noise continuum, in which absorption lines of equivalent width well below the formal spectroscopic resolution will be detectable in principle. The recent attempts with the grating spectrometers on Chandra and XMM-Newton under similar circumstances have illustrated how important a very detailed understanding of the continuum sensitivity of the spectrometer is; in fact, in practice this understanding could well be the ultimate limiting factor on the sensitivity, not the photon counting fluctuations or background characteristics. The goals for intergalactic absorption spectroscopy with XEUS have been summarised by Barcons (2003): a spectrum on each of about 50 AGN at redshifts few tenths, sensitive enough to detect oxygen resonance absorption lines of equivalent width eV.666for a recent update, see the XEUS Science Requirements Document, 4th edition, http://www.rssd.esa.int/index.php?project=XEUS&page=Multimedia, p. 11
Using the microcalorimeter spectrometer on Constellation-X for absorption spectroscopy faces a similar problem, since the projected energy resolution is very similar to that for XEUS. But the baseline design for the observatory includes a reflection grating spectrometer with substantially higher spectral resolution (though smaller effective area; Cottam et al. 2006). The baseline design calls for a resolving power of at least 300 at 20 Å, with a goal of 3000. The effective area should exceed 1000 cm2, so that the sensitivity should be at least a factor 10 higher than currently reachable with the Reflection Grating Spectrometer on XMM-Newton. This is illustrated graphically on the Constellation-X website777http://constellationx.nasa.gov/science/missing_baryons/whim.html; but note that the prominent absorption line in that figure (which presumably displays the capability of the Constellation-X grating spectrometer) is the O vii resonance line at redshift (from gas in a putative hot halo of our Galaxy and/or the intragroup medium of the Local group), which has an equivalent width of mÅ (Williams et al. 2005; Rasmussen et al. 2007), a factor 3 larger than the strongest true intergalactic absorption lines we expect.
The problem of a sufficiently large population of suitably bright point sources at non-trivial redshifts can be solved by using a ’renewable’ set of sources: gamma-ray burst afterglows. If one catches the afterglow early enough, the cumulative fluence over the course of the burst decay compares favorably with the fluence of the brightest extragalactic steady sources, observed over a similar time interval. There is no limit to the number of sources this way; moreover, GRB happen to originate on average at fairly high redshift (), which is ideal for the WHIM problem. But in order to take advantage of these characteristics, one needs to be able to point at a GRB afterglow literally within a matter of minutes. The Pharos888http://hea-www.harvard.edu/elvis/Pharos_GSFC_Aug06.pdf; (Elvis & Fiore 2003) and Estremo (Piro et al. 2006) mission concepts build on the all-sky GRB monitoring and rapid repointing scheme first employed by Swift. Pharos employs a relatively short focal length, moderate angular resolution soft X-ray telescope to feed high reflectivity, high dispersion reflection gratings, of the so-called off-plane variety (see for instance McEntaffer et al. 2004), and reading out in the third spectral order. The spectrometer is designed to reach the thermal width of the oxygen absorption lines ( mÅ at 20 Å). Estremo, instead, relies on non-diffractive spectroscopy, with an array of TES microcalorimeters.
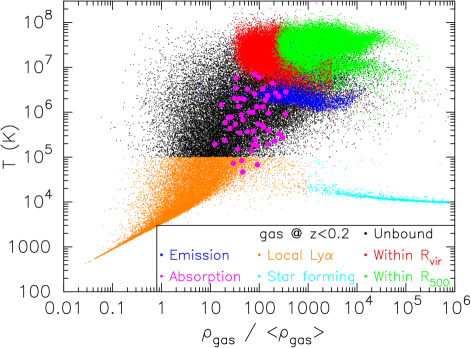
More recently, the Estremo, NEW, and DIOS ideas have tentatively been merged into a new proposal to ESA’s Cosmic Vision program, under the name EDGE (Piro et al. 2007; Explorer of Diffuse emission and Gamma-ray burst Explosions). The EDGE concept relies on rapid repointing to perform absorption spectroscopy on gamma-ray burst afterglows, with a TES-microcalorimeter-based spectrometer, with baseline energy resolution eV. The same array of microcalorimeters views an area of deg2 of the sky, with an effective area of 1000 cm2, which translates to a grasp of cm2 deg2. With this instrument, the observatory will carry out an imaging soft X-ray emission line survey as part of its core mission; part of the available exposure time will be dedicated to imaging the WHIM on lines of sight for which there is a significant absorption spectrum. There is compelling scientific rationale for combining absorption and emission spectroscopy. If nothing else, determining both the optical depth and the emission measure in a given transition gives a rough measurement of linear size and ion density of the system; with assumptions on the atomic abundance, one can derive the total density. This, the largest and most ambitious of the various proposed WHIM experiments, will probe999or rather, could have probed; ESA did not select the concept for the Cosmic Vision program in the Fall of 2007 a significant fraction of the phase plane of the low-density IGM at (see Fig. 2).
2.3 Comparisons
We will attempt to summarise the capabilities of the specific X-ray instrumentation discussed above in a single graph. The sensitivity to detection of either weak emission or absorption lines will roughly scale as , with and the effective area and field of view, and the spectral resolution, for the purely counting statistics-dominated case. For each of the instruments, we plot this figure of merit against the spectral resolution in Fig. 3. We argued that the requirements for detecting WHIM emission or absorption limit the viable experiments to the region eV, cm2 deg2, or m arcmin eV-1/2. That shows that the future large observatories XEUS and Constellation-X are right at the lower end of the requirements; a large dedicated experiment such as EDGE has the required capability.

2.4 Spectroscopy: a warning
It has been emphasised throughout the papers in this volume that advancing our understanding of the low-density IGM (outskirts of clusters and the WHIM) means: determining the physical properties (density, temperature, abundances, possibly velocity fields) of the medium to an accuracy sufficient to uniquely trace total mass and thermodynamical/enrichment history. A mere detection, and a rough determination of the total mass density in the WHIM, is not sufficient motivation to warrant the (potentially large) expenditure of funds and other resources on the experiments required to address this problem. Also, a proper study of the astrophysics of the low-density, highly ionised IGM naturally complements studies in other fields (galaxy formation and evolution, signatures of cosmic feedback from star formation and supermassive Black Holes, maybe even reionisation) and therefore forms a natural component of modern astrophysics.

We therefore emphasise again the importance of high resolution spectroscopy, spatial resolution, and sky coverage. Below, we reproduce the phase diagram of metals in the low-density IGM at , as shown in Bykov et al. (2008), to emphasise the fact that measurements and conclusions based on simple assumptions concerning the physical state of the metals in the highly ionised IGM are likely to yield biased and unreliable results. For instance, even detection of both an O vii resonance absorption line as well as a corresponding O viii Ly absorption line from a single filament, does not uniquely translate into an electron temperature, unless one knows what the dominant ionisation mechanism is. And in fact, it is quite possible that the ionisation balance between H- and He-like oxygen has not reached equilibrium in the filament under study, if its density is very low. Likewise, at limited spatial resolution, we may confuse the topology of line emitting and absorbing gas, relative to the distribution of galaxies, and our images are confused by metals freshly injected into the IGM by actively star-forming galaxies. Finally, at limited sensitivity, we will collect a sample of absorption line measurements and emission line images that will necessarily be biased towards the most massive filaments (the emission line images even more so than the absorption line detections), as well as the most nearby ones (in emission). Given the very large spread in density, temperature, and enrichment expected in the WHIM, we should keep in mind that sampling the properties of the most massive, densest phases of the medium is highly biased, and our measurements should reach well below these ’tips of the iceberg’ before we can claim to have characterised the WHIM.
3 Hard X-ray and -ray emission
We conclude with a brief, non-exhaustive description of future instrumentation for the detection of hard X-ray and -ray emission associated with nonthermal processes, as described in Petrosian et al. 2008 - Chapter 10, this volume. The potential of GLAST for detection of high energy -rays is briefly addressed in this latter reference; here, we concentrate on detection of hard X-ray emission (traditionally approximately the keV band). The challenge is to detect faint, extended diffuse emission over a large ( several arcminutes) field of view in the presence of strong detector backgrounds. Traditionally, instruments in this band have operated with collimators or coded masks, because it is difficult to focus hard X-rays for true imaging. However, the coming generation of hard X-ray experiments is built around innovative focusing optics, which promises much higher contrasts for astrophysical sources, and the detection of hard nonthermal emission from clusters is one of the primary science areas for these new instruments.
Simbol-X is a hard X-ray mission, operating in the keV range, proposed as a collaboration between the French and Italian space agencies with participation of German laboratories for a launch in 2013 (Ferrando et al. 2006). Relying on two spacecraft in a formation flying configuration, Simbol-X uses a m focal length X-ray mirror to focus X-rays with energies above 10 keV, resulting in over two orders of magnitude improvement in angular resolution and sensitivity in the hard X-ray range with respect to non-focusing techniques. The field of view of the instrument (at 30 keV) is in diameter. The on-axis sensitivity is better than 10-14 erg cm-2 s-1 (i.e. 0.5 Crab) in the keV band, providing a 3 detection in 1 Ms for a power law source spectrum with a photon index of 1.6. The goals for on-axis effective area S are: at 0.5 keV photon energy S 100 cm2, at 2 keV S 1000 cm2, at 8 keV S 600 cm2, at 30 keV S 300 cm2, at 70 keV S 100 cm2, and at 80 keV S 50 cm2.
The focal plane has two detector systems: the Low Energy Detector (LED) and the High Energy Detector (HED). The heart of the low energy detector is a monolithic macro pixel detector array of 128 128 pixels. The readout scheme of the pixel detector is that of an active pixel sensor. An active pixel sensor consists of a Silicon drift detector with an integrated DEPFET for readout. An optical blocking filter is deposited directly onto the surface of the LED. The LED detector is made of a single Si wafer on which the 128 128 pixels are integrated. The HED is a hard X-ray camera made of an array of modules of 1 cm2 arranged in a 8 8 square to cover the field of view. The detector material is CdTe (or CdZnTe) which provides the stopping power necessary to detect the hard X-rays. This material has flight heritage on INTEGRAL and SWIFT. The broad sensitivity calculated for the keV band provides a flux limit of about 6 10 that can be reached in 1 Ms.
The NuSTAR (Harrison et al. 2005) and NEXT missions (Nakazawa et al. 2006) similarly feature focusing hard X-ray optics.
Acknowledgements.
The authors express their gratitude to ISSI for its support of the team ’Non-virialized X-ray components in clusters of galaxies’. FP acknowledges support from the Dutch Organization for Scientific Research NWO, and expresses his gratitude to SRON, the Netherlands Institute for Space Research, for its hospitality.References
- Barcons (2003) Barcons, X., 2003, in XEUS - Studying the evolution of the hot Universe, MPE Report 281, 77
- Bykov et al. (2008) Bykov, A.M., Paerels, F.B.S., & Petrosian, V., 2008, SSR, in press
- Churazov et al. (2001) Churazov, E., Haehnelt, M., Kotov, O., & Sunyaev, R., 2001, MNRAS, 323, 93
- Cottam et al. (2006) Cottam, J., Cash, W., Flanagan, K., et al., 2006, Proc. SPIE, 6266, 62661X
- Davé et al. (2001) Davé, R., Cen, R., Ostriker, J., et al., 2001, ApJ, 552, 473
- Den Herder et al. (2006) den Herder, J.-W., Kaastra, J.S., Paerels, F.B.S., et al., 2006, Proc. SPIE, 6266, 62660H
- Elvis & Fiore (2003) Elvis, M. & Fiore, F., 2003, Proc. SPIE, 4851, 377 (astro-ph/0303444).
- Enss (2005) Enss, C., 2005, Cryogenic Particle Detection, Springer, Heidelberg-Berlin.
- Ferrando et al. (2006) Ferrando, P, Arnaud, M., Briel, U., et al., 2006, Proc. SPIE, 6266, 62660F
- Fukugita & Peebles (2004) Fukugita, M., & Peebles, P.J.E., 2004, ApJ, 616, 643
- Harrison et al. (2005) Harrison, F.A., Christensen, F., Craig, W., et al., 2005, Exp. Astron., 20, 131
- Hellsten et al. (1998) Hellsten, U., Gnedin, N. Y., & Miralda-Escudé, J., 1998, ApJ, 509, 56
- Kaastra et al. (2008) Kaastra, J.S, Paerels, F.B.S., Durret, F., Schindler, S., & Richter, P., 2008, SSSR, in press
- McCammon & Sanders (1990) McCammon, D., & Sanders, W., 1990, ARAA, 28, 657
- McCammon et al. (2002) McCammon, D., Almy, R., Apodaca, E., et al., 2002, ApJ, 576, 188
- McEntaffer et al. (2004) McEntaffer, R., Osterman, S., Cash, W., et al., 2004, Proc. SPIE, 5168, 492
- Mewe (1999) Mewe, R., 1999, in X-ray Spectroscopy in Astrophysics, eds. J. van Paradijs & J.A.M. Bleeker, Springer, Heidelberg-Berlin.
- Nakazawa et al. (2006) Nakazawa, K., Fukazawa, Y., Kamae, T., et al., 2006, Proc. SPIE, 6266, 62662H
- Ohashi et al. (2006) Ohashi, T., Ishida, M., Sasaki, S., et al., 2006, Proc. SPIE, 6266, 62660G
- Petrosian et al. (2008) Petrosian, V., Bykov, A.M., & Rephaeli, Y., 2008, SSR, in press
- Piro et al. (2006) Piro, L., Amati, L., Barbera, M., et al., 2006, Proc. SPIE, 6266, 62660K
- Piro et al. (2007) Piro, L., den Herder, J.-W., Ohashi, T., et al., 2007, ESA Cosmic Vision proposal (astro-ph/07074103)
- Rasmussen et al. (2007) Rasmussen, A.P., Kahn, S.M., Paerels, F., et al., 2007, ApJ, 656, 129
- Richter et al. (2008) Richter, P., Paerels, F.B.S., & Kaastra, J.S., 2008, SSR, in press
- Wargelin et al. (2004) Wargelin, B.J., Markevitch, M., Juda, M., et al., 2004, ApJ, 607, 596
- Williams et al. (2005) Williams, R.J., Mathur, S., Nicastro, F., et al., 2005, ApJ, 631, 856