∎
Present address: Santa Cruz Institute for Particle Physics, University of California at Santa Cruz, 1156 High Street, Santa Cruz CA 95064, USA
22email: serena@scipp.ucsc.edu 33institutetext: J. Schaye 44institutetext: Leiden Observatory, Leiden University, P.O. Box 9513, 2300 RA Leiden, The Netherlands
44email: schaye@strw.leidenuniv.nl 55institutetext: K. Dolag 66institutetext: Max-Planck-Institut für Astrophysik, P.O. Box 1317, D-85741 Garching, Germany
66email: kdolag@mpa-garching.mpg.de
Numerical simulations of the Warm-Hot Intergalactic Medium
Abstract
In this paper we review the current predictions of numerical simulations for the origin and observability of the warm hot intergalactic medium (WHIM), the diffuse gas that contains up to 50 per cent of the baryons at . During structure formation, gravitational accretion shocks emerging from collapsing regions gradually heat the intergalactic medium (IGM) to temperatures in the range K. The WHIM is predicted to radiate most of its energy in the ultraviolet (UV) and X-ray bands and to contribute a significant fraction of the soft X-ray background emission. While O vi and C iv absorption systems arising in the cooler fraction of the WHIM with K are seen in FUSE and Hubble Space Telescope observations, models agree that current X-ray telescopes such as Chandra and XMM-Newton do not have enough sensitivity to detect the hotter WHIM. However, future missions such as Constellation-X and XEUS might be able to detect both emission lines and absorption systems from highly ionised atoms such as O vii, O viii and Fe xvii.
Keywords:
large-scale structure of the universe, intergalactic medium, diffuse radiation, X-rays: diffuse background, quasars: absorption lines1 Introduction
The cosmic baryon abundance was first inferred by applying the theory of primordial nucleosynthesis to observations of light element abundances (e.g. (Olive et al., 2000)) and has been confirmed by observations of the cosmic microwave background radiation (CMB). A recent measurement from the Wilkinson Microwave Anisotropy Probe reveals that , where the Hubble parameter is (Spergel et al., 2007). At most of the baryons are thought to reside in the diffuse, photoionised intergalactic medium (IGM) with K, traced by the Ly forest111Since the diffuse intergalactic medium is highly ionised, the baryon density inferred from Ly forest observations is inversely proportional to the assumed ionisation rate. Since independent constraints on the UV intensity are only accurate to a factor of few at best, we cannot prove that most of the baryons reside in the forest. (e.g. Rauch et al 1997; Weinberg et al. 1997; Schaye 2001). The gas traced by the Ly forest, together with the mass in galaxies, fully accounts for the cosmic baryon abundance at and confirms the prediction of nucleosynthesis theories and the CMB measurements.
However, when the mass of stars, interstellar gas and plasma in clusters of galaxies at redshift is considered, only a small fraction of the mass budget can be accounted for (e.g. Persic & Salucci 1992; Fukugita et al. 1998; Fukugita & Peebles 2004). While the gas traced by Ly forest may account for about a third of the low- baryons (e.g. Danforth & Shull 2007), the majority of the baryons remain invisible. Unless the baryon budget at high redshift has been overestimated by two different measurements, a large amount of the low redshift baryons must be “missing”.
One of the basic predictions of cosmological, gas-dynamical simulations is the distribution of baryons in the universe. How many baryons are locked in stars? How many reside in clusters and filaments? What is the state of the diffuse gas? Simulations of structure formation predict that the missing baryons problem is measure of our technological limitations rather than a real problem. In other words, the baryons are out there, but we cannot see them because they reside in gas that is too dilute to be detected in emission and too hot to be traced by Ly absorption.
The idea of gravitational heating of the intergalactic gas was first suggested by Sunyaev & Zel’dovich (1972) and subsequently developed (e.g. Nath & Silk 2001; Furlanetto & Loeb 2004; Rasera & Teyssier 2006). While the largest structures in the universe form, the IGM is heated by gravitational shocks that efficiently propagate from the collapsing regions to the surrounding medium. Simulations predict that gas compressed and heated by shocks can reach temperatures of K in rich clusters of galaxies, while filaments and mildly overdense regions are heated to temperatures in the range to K (e.g. Cen & Ostriker 1999; Davé et al. 2001; Cen & Ostriker 2006). The latter are commonly known as the Warm-Hot Intergalactic Medium (WHIM), which represents about half the total baryonic mass in the universe at .
At K, the IGM is collisionally ionised and becomes transparent to Ly radiation. As a consequence, the H i Ly forest does not trace the bulk of the gas mass at low redshift. Although the shock-heated IGM emits radiation in the UV and in the soft X-ray bands, the total energy radiated away by mildly overdense gas is orders of magnitude too small to be detected by current instruments. Similarly, the absorption from such a gas along the line of sight to a bright X-ray source is too weak to be resolved by current spectrographs (Richter et al. 2008 - Chapter 3, this volume).
In this Paper, we review the predictions of numerical simulations for the properties and the observability of the WHIM. In Sect. 2 we briefly mention the numerical techniques used to simulate the IGM and we discuss the mechanisms that produce the WHIM, namely heating by gravitational accretion shocks and other, non-gravitational, heating processes. A more detailed description of the numerical techniques themselves can be found in Dolag et al. (2008) - Chapter 12, this volume. Sect. 3 describes the contribution of the WHIM emission to the soft X-ray background. The current predictions for the detectability of the WHIM in emission and absorption are discussed in Sect. 4 and in Sect. 5 respectively. Sect. 6 briefly reports on the effect of the WHIM on the CMB radiation and Sect. 7 discusses the magnetisation of the IGM. We draw our conclusions in Sect. 8.
2 Origin and properties of the WHIM
2.1 Numerical techniques
In this Subsection, we briefly discuss the numerical techniques that have been used to investigate the IGM and the WHIM in particular. However, we refer the reader to the review of Dolag et al. (2008) - Chapter 12, this volume for a thorough description of specific simulation techniques.
The most common approach to model the WHIM is through cosmological hydrodynamical simulations. The strength of hydrodynamical simulations is that the basic gas dynamical processes that determine the evolution of the diffuse gas are directly simulated and that it is possible to make virtual observations of the WHIM with existing or future instruments. However, ad hoc empirical prescriptions are needed to include processes such as galactic winds and feedback from active galactic nuclei (AGN), whose physics is still poorly understood and in any case would require a resolution far beyond the current standards to be included self-consistently. Hydrodynamical simulations of the WHIM have typically used either Smoothed Particle Hydrodynamics (SPH, e.g. Hellsten et al. 1998; Croft et al. 2001; Davé et al. 2001; Yoshikawa et al. 2004; Yoshikawa & Sasaki 2006; Dolag et al. 2006), a uniform grid (e.g. Cen & Ostriker 1999; Cen & Ostriker 2006), or Adaptive Mesh Refinement (AMR, e.g. Kravtsov et al. 2002) to solve the gas dynamics.
Several properties of the WHIM, including the impact of gravitational and non-gravitational heating processes on the IGM, and the observability of emission lines and absorption systems in UV and X-ray spectra, have been successfully investigated with analytical and semi-analytical techniques (Perna & Loeb 1998; Pen 1999; Nath & Silk 2001; Valageas et al. 2002; Viel et al. 2003; Furlanetto et al. 2004; Viel et al. 2005; Furlanetto et al. 2005; Rasera & Teyssier 2006).
2.2 Gravitational heating

Theoretical predictions and numerical simulations agree that the heating of the IGM is fuelled by the gravitational accretion shocks emerging during the collapse of cosmic structures (e.g. Cen & Ostriker 1999; Davé et al. 2001; Nath & Silk 2001; Valageas et al. 2002; Kang et al. 2005; Cen & Ostriker 2006; Bykov et al. 2008 - Chapter 7, this volume). Simulations suggest that the distribution of the warm-hot gas closely reflects the distribution of the shock waves, and therefore the underlying density field. The role of shock waves in heating the IGM has been investigated using cosmological hydrodynamical simulations by Kang et al. (2005), who find that the fastest shocks can be found around clusters and groups of galaxies, while the slowest shocks usually propagate across low density regions like sheets and filaments. This reflects the fact that the infall velocity is a measure of the depth of the potential well. Furlanetto et al. (2005) reach similar conclusions using analytical techniques and find that the shocks with the highest temperatures are associated with the most massive virialised objects, up to distances larger than their virial radii.
The WHIM gas is organised in a complex structure of filaments and sheets, that generally reflects the dynamics of structure formation. According to Dolag et al. (2006), the gas density in filaments is typically times the mean density and varies more smoothly than in clusters. Filaments have a coherence length of about 5 Mpc, although some can be as long as 25 Mpc, and a diameter of about Mpc. The detailed thermal structure of the WHIM strongly depends on the direction of propagation of the accretion shocks, while the velocity field appears to be orthogonal to the filaments at large distances from galaxy clusters and aligned to the filaments at small distances.
Most simulations predict that between 30 and 50 per cent of all the baryons in the low redshift universe have temperatures in the interval K (e.g. Hellsten et al. 1998; Cen & Ostriker 1999; Davé et al. 1999; Davé et al. 2001; Cen & Ostriker 2006). Fig. 1 shows the distribution of the gas in the temperature-density plane at 3, 2, 1, and 0. Hot gas with K resides in the hottest cores of groups and in large clusters of galaxies. Most of the gas, however, is at temperatures K and at is about evenly spread between the WHIM and the cooler, mostly photo-ionised IGM. At higher redshifts, a larger fraction of the baryons resides in the photo-ionised IGM. Kang et al. (2005) find that, besides the gas shock-heated to K, a significant amount of mass, distributed mostly along sheet-like structures, is shock-heated to K by shock waves propagating with velocities km s-1. This mostly photo-ionised gas is responsible for the majority of the O v and O vi absorption lines, but contributes little to the total O v and O vi emission, which is instead produced by warmer, collisionally ionised ions.
2.3 Non-equilibrium calculations
Simulations that include non-equilibrium processes have been performed by Teyssier et al. (1998), Cen & Fang (2006) and Yoshikawa & Sasaki (2006). In most hydrodynamical simulations, it is routinely assumed that diffuse gas is in ionisation equilibrium (Cen & Ostriker 1999; Davé et al. 2001; Yoshikawa et al. 2003; Yoshikawa et al. 2004; Kang et al. 2005; Roncarelli et al. 2006). In general, ionisation equilibrium is nearly achieved in the centres of galaxy clusters and in photo-ionised regions with K. However, this may not happen in the outer regions of clusters, in groups, and in the WHIM (Yoshikawa et al., 2003).
Similar conclusions are reached by Cen & Fang (2006) and Yoshikawa & Sasaki (2006). Cen & Fang (2006) claim that observational results for the abundance of O vi absorption lines are better reproduced by models including non-equilibrium processes. Yoshikawa & Sasaki (2006) find that a significant fraction of the WHIM at is not in ionisation equilibrium, as do Yoshida et al. (2005). However, Yoshikawa & Sasaki (2006) calculate that although this strongly affects the relative abundance of ions such as O vi, O vii and O viii, it does not have a significant effect on the observable signatures of the WHIM in emission or absorption.
When gas is infalling onto a collapsing structure and is heated by gravitational accretion shocks, most of its energy is carried by ions, while electrons can only gain thermal energy through collisions with ions. The temperatures of ions and electrons can therefore be very different and converge only if energy can be efficiently transferred from ions to electrons. If only Coulomb interactions are considered, then the relaxation timescale can be shorter than the age of the universe for the WHIM (Yoshikawa et al. 2003; Yoshida et al. 2005). Since the relative abundance of metal ions and the plasma emissivity are sensitive to the electron temperature, this would have consequences for the observability of the WHIM.
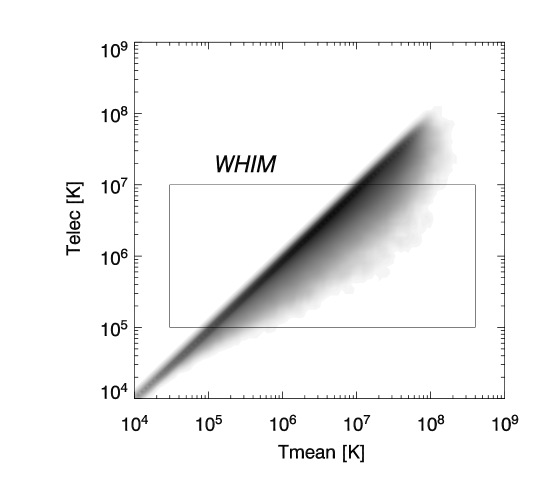
Yoshida et al. (2005) introduce a two-temperature model for the thermal evolution of an ionised gas. Their model includes an explicit treatment for collisional relaxation processes between electrons and ions and allows one to follow the temperature of free electrons separately from the temperature of ions. They find that at most WHIM gas shows a two-temperature structure. Fig. 2 shows the electron temperature in the two-temperature model compared to the mean temperature of the gas at for the simulations of Yoshida et al. (2005). Clearly, the electron temperature of the WHIM is significantly lower than the mean gas temperature, when non-equilibrium processes are taken into account. Yoshida et al. (2005) calculate that the relative abundance of O vi, O vii and O viii predicted by a two-temperature model can be about an order of magnitude different from that predicted by a one-temperature model. This yields similarly different values for the line emission of ions.
However, from supernova remnants we know that plasma waves are typically much more efficient than collisional processes in transferring energy from ions to electrons (e.g. Rakowski 2005) and these effects have not yet been included in simulations of the WHIM. Yoshida et al. (2005) may therefore have overestimated the importance of the two-temperature structure of the post-shock gas.
2.4 Non-gravitational physics
Several studies have investigated whether sources of non-gravitational heating might significantly affect the thermal state of the IGM. Simulations by Cen & Ostriker 2006 predict that non-gravitational processes, such as galactic winds and X-ray emission from galaxies and quasars, contribute no more than 20 per cent of the energy required to heat the IGM, in agreement with previous results from Davé et al. (2001) and Nath & Silk (2001).
A powerful test to constrain the contribution of non-gravitational processes is the comparison of the observed intensity of the soft X-ray background to the predictions of numerical simulations. Since most of the observed background emission has been resolved into point sources (Hasinger et al. 1993; Worsley et al. 2005), the comparison of the predictions of hydrodynamical simulations with observations can put tight constraints on the amount of the observed background emission that can be attributed to the diffuse intergalactic gas.
In general, the intensity of the soft X-ray background predicted by simulations that include only gravitational heating processes strongly exceeds the observed emission from high density, collapsed regions (e.g. Nath & Silk 2001; Bryan & Voit 2001; Davé et al. 2001; Cen & Ostriker 2006). The emission is primarily due to Bremsstrahlung and reflects the cooling of gas in groups and clusters of galaxies. Analytical calculations by Pen (1999) and Wu et al. (2001) find an order of magnitude more background light than predicted by simulations, owing to the importance of gravitational pre-heating. They suggest that additional heating from non-gravitational processes might be necessary to “puff up” and hence decrease the emission from collapsed regions and reconcile the theoretical predictions with the observations. However, they note that non-gravitational heating does not seem to be relevant for uncollapsed regions like filaments and voids.
Voit & Bryan (2001) argue that non-gravitational processes can help to establish an entropy floor in high density regions. The lowest entropy material will drop out and form stars unless it is heated through feedback from star formation. They suggest that an entropy floor of keV cm-2 is required to reconcile the theoretical results with observations. Bryan & Voit (2001) demonstrate further that radiative cooling and additional heating from feedback can efficiently suppress the X-ray background, while substantially modifying the characteristic spectral shape of the background itself.
3 WHIM contribution to the soft X-ray background
The extended spatial distribution over cosmological scales makes the WHIM an essential contributor to the diffuse X-ray background radiation. The most intense X-ray emission comes from relatively compact sources such as clusters, active galactic nuclei and galaxies. The gas in these objects has high emissivity power, but accounts for only a small fraction of the baryon mass in the universe. The emissivity of the WHIM is usually a few orders of magnitude lower, because of its lower density and temperature. However, the WHIM accounts for up to half the baryonic mass at and its integrated emission over cosmological scales might be roughly comparable to that of dense regions and compact objects.
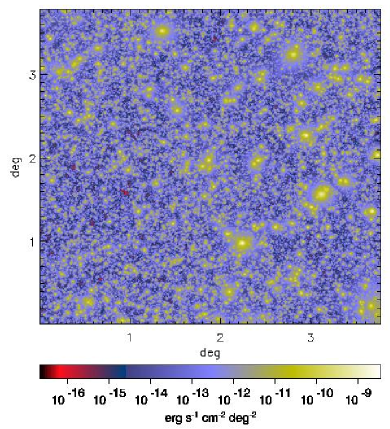
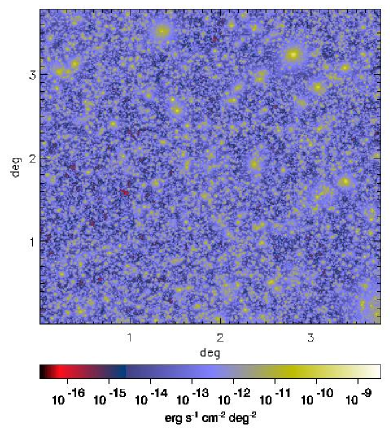
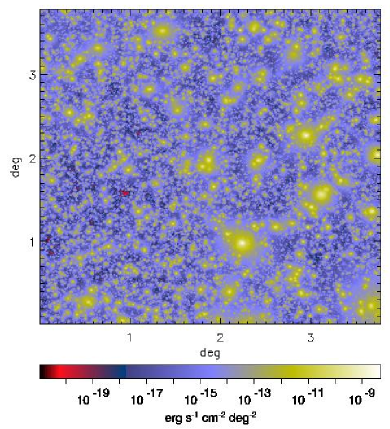
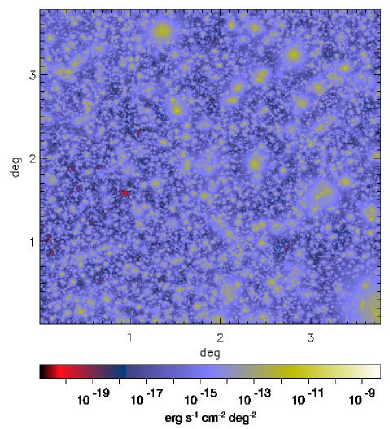
Analytical calculations (Valageas et al., 2002) and numerical simulations predict that the WHIM contributes between a few per cent (Kang et al., 2005) and 40 per cent (Croft et al. 2001; Roncarelli et al. 2006) of the total X-ray background emission, consistent with the observational upper limit of erg s-1 cm-2 deg-2 (Worsley et al., 2005). Because of the softness of the spectrum, the WHIM produces only between 4 per cent (Croft et al., 2001) and 10 per cent (Roncarelli et al., 2006) of the total hard X-ray emission. According to the simulations of Roncarelli et al. (2006), about 90 per cent of the X-ray background emission is produced at . Fig. 3 shows simulated maps of the soft ( keV, upper panels) and hard ( keV, lower panels) X-ray emission from a region 3.78 degree on a side. The left panels show the total emission from the gas, while the right panels show the contribution of the WHIM.

Phillips et al. (2001) estimate that in hydrodynamical simulations the WHIM gas at is responsible for about per cent of the total extragalactic surface brightness in the energy range keV (Fig. 4), corresponding to a flux of erg s-1 cm-2 deg-2. The WHIM line emission peaks in the keV energy range, where observations by ASCA and ROSAT show a spectral bump, as shown in Fig. 4. Phillips et al. (2001) argue that the bump is due to WHIM emission, and in particular to metal line emission. Similarly, Kravtsov et al. (2002) produce simulations that faithfully reconstruct the local universe and find that about per cent of the X-ray background at energies of about 1 keV may be contributed by the WHIM. Ursino & Galeazzi (2006) find a contribution of up to 20 per cent in the energy range keV, most of which is emitted by filaments at redshifts between 0.1 and 0.6. Dense and bright filaments are present in about 10 per cent of a generic field of view, and can account for more than 20 per cent of the total emission. In such cases, redshifted emission lines from highly ionised atoms should be clearly detectable.
3.1 Soft X-ray excess radiation in galaxy clusters
Soft X-ray excess radiation in clusters has been detected in observations by the Extreme Ultraviolet Explorer (EUVE), ROSAT and XMM-Newton (Lieu et al. 1996; Bonamente et al. 2001; Finoguenov et al. 2003; see Durret et al. 2008 - Chapter 4, this volume for an overview). The temperature of the ICM is usually estimated by assuming a one-temperature plasma model for the diffuse gas. The soft X-ray flux calculated from the observed X-ray emission of clusters, however, often appears to be above the expected thermal contribution. It has been suggested that the excess radiation may be due to foreground emission from the WHIM, or from warm diffuse gas in the clusters.
Cheng et al. (2005) investigate the origin of this excess with a set of cluster simulations. They find that the presence of WHIM is not necessary to explain the observations, because the excess emission is produced by extremely dense gas associated with merging substructures within the cluster. In clusters where this gas is present, the temperature of the inner regions is usually per cent above that predicted by the one-temperature plasma model. Dolag et al. (2006) find that, since the WHIM surface brightness in X-rays reaches at most erg s-1 cm-2 arcmin-1, projection effects of WHIM filaments in front of galaxy clusters can account for no more than 10 per cent of the cluster emission. This may partly explain the soft X-ray excess, but clearly does not fully account for it. Similar conclusions have been reached by Mittaz et al. (2004).
4 Line emission
Most of the energy radiated by the WHIM in the UV and soft X-ray bands is emitted through emission lines. The detection of emission lines from the WHIM is key to understanding the properties of the gas itself. The relative intensities of emission lines from highly ionised metals in the WHIM gives information about the temperature of the emitting gas, while the absolute intensities reflect the density and the degree of metal enrichment of the gas.
The relative abundances of ionised atoms is determined by the temperature and, if photo-ionisation plays a role, the density of the WHIM. Ions whose abundance peaks at the highest temperatures, such as Fe xxv and Fe xxvi, are concentrated in the hottest, highest density regions, while ions that peak at lower temperatures, such as O vii, O viii and Fe xvii, are more widespread and originate in groups and filaments (Fang et al., 2002). The detection of WHIM emission from the intracluster medium of filaments, groups and cluster with different masses helps to understand the impact of feedback in these structures (Pierre et al., 2000).
4.1 Soft X-rays
Yoshikawa et al. (2003) and Yoshikawa et al. (2004) find that the temperature of the IGM can be estimated if both the O vii and O viii ions are simultaneously observed. However, if only one line is detectable, then the line cannot be identified unambiguously. Fig. 5 shows template spectra of a collisionally ionised plasma with temperature K, K, and K, and with metallicity and , which display the contribution of oxygen ions as a function of temperature. Clearly, the detectability of the line emission depends strongly on the metallicity.

It is still controversial if the WHIM can actually be detected in emission by current and future X-ray telescopes. Voit et al. (2001) calculate that the virialised regions of groups and clusters cover about a third of the sky. This is a potential problem in the identification of X-ray emission from the WHIM in filaments and distant groups, because it creates source-confusion and strongly contaminates the observations. Pierre et al. (2000) predict that XMM-Newton should be able to detect diffuse emission from strong filaments at , although no such detections have been confirmed so far. As Fang et al. (2005) calculate, X-ray emission lines from the WHIM are hard to detect in high density regions and in voids. The emission from clusters and groups is dominated by the hot intracluster medium, while in voids the X-ray spectrum is completely dominated by radiation from background AGN and by the Galactic foreground. In both cases, the emission of the WHIM would be too low to be distinguished from the dominant component. On the other hand, it might be possible to resolve at least a few strong emission lines from the WHIM in filamentary regions, despite the fact that most of the emission is contributed by AGN and by the Galactic foreground.
Fang et al. (2005) argue that planned telescopes such as Constellation-X and the X-ray Evolving Universe Spectroscopy mission (XEUS) have little chance to see a significant signal for the WHIM emission, because their effective collecting area is too small to detect diffuse line emission from an extended area. Ideally, a mission to detect line emission from the WHIM should have a large field of view, coupled with a high resolving power and spectral resolution. Yoshikawa et al. (2003) and Yoshikawa et al. (2004) use large scale simulations and simulations that reproduce the local universe to produce mock X-ray spectra of the WHIM emission. The simulated maps of the local universe (Yoshikawa et al., 2004) demonstrate that WHIM gas in filamentary structures can be successfully imaged in targeted observations by the proposed Diffuse Intergalactic Oxygen Surveyor (DIOS), an X-ray telescope of new generation which combines a large field of view with high spatial and spectral resolution. DIOS and several other proposed missions are discussed in more detail in Paerels et al. (2008) - Chapter 19, this volume.
4.2 UV
While O vii and O viii lines are emitted by gas with K, line emission from the O vi Å and C iv Å doublets traces the coolest fraction of the WHIM, with K. For the bulk of the WHIM mass, the line strengths are predicted to be a few orders of magnitude lower than the background (Furlanetto et al., 2004). Kravtsov et al. (2002) estimate the intensity of the O vi emission line at and column densities cm-2 to be photons cm-2 s-1 sr-1, which is an order of magnitude below the sensitivity of past and current telescopes such as the Far Ultraviolet Spectroscopic Explorer (FUSE) and SPEAR.
However, Furlanetto et al. (2004) predict that O vi and C iv line emission could be detected above the background from enriched dense regions with sizes of about kpc. Furlanetto et al. (2004) argue that the connection between the line emission and the enrichment by galactic winds may help understand the chemical enrichment history of the IGM and the physics of winds.
5 Absorption
The X-ray forest is the high-energy counterpart of the Ly forest. While the Ly forest is produced by cool gas absorbing Ly photons in the optical spectra of high redshift quasars, the X-ray forest is the result of absorption by highly ionised atoms in the spectra of bright X-ray sources (Richter et al. 2008 - Chapter 3, this volume).
The detection of the X-ray forest in high resolution spectra of quasars and gamma ray bursts (GRB) is possibly one of the most powerful tools to investigate the properties of the WHIM in the low redshift universe. For example, the number density of absorbers gives an estimate of the baryon density times the metallicity of the IGM, while the ratio between the O vii and the O viii line strengths gives information on the distribution of the gas temperature and density.
A thorough knowledge of the physical state of the WHIM, as Furlanetto et al. (2005) point out, helps to understand the mechanisms that have determined its evolution in a cosmological context. Furlanetto et al. (2005) use analytic techniques to investigate how the accretion shocks that heat up the IGM during the formation of cosmic structures can give rise to absorption systems such as O vi and O vii. They find that the observed column densities of absorbers are predicted by post-shock cooling models, when both slow and fast cooling channels are taken into account. The observed number density of absorbers can be realistically reproduced if each virialised structure is surrounded by a network of shocks with a total cross section a few times the size of the virialised region. In this scenario, fast cooling would produce stronger O vii absorbers associated to O vi systems than expected from models of collisional ionisation equilibrium. O vii absorption systems should be the most common because the abundance of the O vii ion dominates over a large temperature range.
5.1 Soft X-rays
The observability of the WHIM in the X-ray forest by current and future facilities has been a very popular topic in recent years (Richter et al. 2008 - Chapter 3, this volume). A variety of predictions has been provided by hydrodynamical simulations (e.g. Hellsten et al. 1998; Kravtsov et al. 2002; Chen et al. 2003; Cen & Fang 2006; Kawahara et al. 2006) and semi-analytic models (e.g. Perna & Loeb 1998; Viel et al. 2003; Viel et al. 2005).
Kravtsov et al. (2002) find that the regions of the highest column densities of O vii and O viii correspond to the high density regions in and around galaxy groups. The gas in these regions, with K and , should produce the strongest O vii and O viii absorption lines, with equivalent width km s-1 (Hellsten et al., 1998). These lines should occur on average once per sight line in the redshift range (Hellsten et al. 1998; Cen & Fang 2006). Cen & Fang (2006) predict abundances for O vi, O vii, and O viii lines in the range per unit redshift at km s-1, decreasing to per unit redshift at km s-1.
Chen et al. (2003) suggest that the most promising strategy to find O vii and O viii absorbers in the X-ray forest would be to search at the redshifts of known O vi absorbers. However, since O vi absorption traces gas at somewhat lower temperatures than O vii and O viii, only future missions like Constellation-X and XEUS will be able to find absorption systems at higher temperatures.
Most predictions agree that Chandra and XMM-Newton do not have enough sensitivity to detect the WHIM in absorption. Chen et al. (2003) claim that a few strong O vii and O viii absorption systems might be within reach of Chandra and XMM-Newton, but the probability to detect such lines in random lines of sight is less than 5 per cent (Kravtsov et al., 2002).
Future telescopes such as Constellation-X and XEUS might have a better chance to detect the WHIM in absorption, thanks to higher spectral resolution and larger collecting areas. Constellation-X should have a 50 per cent probability to detect the strongest O vii and O viii absorption lines (Kravtsov et al., 2002). Because of its high sensitivity at high energies, it should also be able to detect absorption from ions such as Ne ix and Fe xvii, whose intensity peaks at about the same temperature as O vii, and Fe xx lines, which appear for K (Hellsten et al., 1998). Perna & Loeb (1998) predict that one day of integration time will allow Constellation-X and XEUS to detect a few O viii absorption lines per unit redshift in the spectra of X-ray bright quasars. According to Viel et al. (2003), Constellation-X will detect about 6 absorption lines per unit redshift with km s-1, while XEUS could detect up to 30 lines with km s-1 per unit redshift. Under the assumption of constant IGM metallicity, Kawahara et al. (2006) estimate that XEUS will be able to detect on average two O vii absorption systems with along any line of sight to bright quasars at in an 8 hours exposure.
It should be noted, however, that the characteristics of the proposed facilities have been evolving and that some of the above predictions are therefore likely too optimistic.
5.2 UV
Cen et al. (2001) find that about 20–30 per cent of the WHIM at , or equivalently, about 10 per cent of the baryonic mass, is traced by O vi absorption lines with equivalent width mÅ. They expect about five O vi absorption lines per unit redshift with mÅ and about 0.5 per unit redshift with mÅ. Fang & Bryan (2001) estimate that most O vi absorption lines are correlated to filamentary regions with overdensities of 5–100 and temperatures of a few times K.
The equivalent width of absorption systems in the ultraviolet region can be useful to distinguish a prevalently photoionised from a prevalently collisionally ionised IGM. Collisional ionisation dominates in the denser and warmer regions of the IGM and is responsible for most lines with mÅ. On the other hand, photoionisation is predominant in the cooler and less dense regions and usually produces narrow absorption lines with mÅ. Essentially all lines with equivalent width mÅ are due to collisionally ionised gas (Fang & Bryan, 2001).
Richter et al. (2006) investigate the origin of the broad H i Ly absorbers (BLA) with Doppler parameters km s-1 seen in UV spectra from the Hubble Space Telescope and FUSE (Richter et al. 2004; Richter et al. 2008 - Chapter 4, this volume). They find that such absorbers are associated with WHIM gas with temperatures in the range K, that represents about a quarter of the gas mass in the simulation at . Less than one third of the broad H i absorbers are associated with cooler gas with K, whose broadening is produced by non-thermal processes such as turbulence and velocity structures in the IGM.
6 Sunyaev-Zel’dovich signal of the WHIM
It has been suggested that ionised WHIM gas could possibly be detected through the thermal Sunyaev-Zel’dovich effect it produces in the CMB (e.g. Croft et al. 2006; Cao et al. 2006; Hallman et al. 2007; Bregman 2007). When the CMB radiation crosses a hot ionised medium such as the WHIM, the energy of the passing photons can be increased by collisions with the free electrons in the WHIM. This produces a local increase of the CMB temperature, with an increase proportional to the line integral of the pressure of the hot gas. Although the signal arising from the hot gas in large clusters has been clearly identified, a weaker signal associated with WHIM gas has not yet been reliably detected in current CMB data (Hernandez-Monteagudo et al. 2004; Hansen et al. 2005).
Hallman et al. (2007) estimate that the WHIM could contribute on average between 4 and 12 per cent of the integrated Sunyaev-Zel’dovich effect (SZE) signal for individual sources identified in upcoming surveys. The WHIM is a particularly relevant source of contamination for observations of clusters of galaxies, because it would strongly affect the calibration of the cluster relationship. Unless the WHIM signal can be unambiguously modelled and separated from the cluster signal, it introduces a bias and a source of scatter difficult to quantify in the relationship. Ultimately, this would limit the reliability of the relationship for estimating cosmological parameters.
7 Intergalactic magnetic fields
It has been suggested that cosmic shear and gravitational shocks might be able to amplify the magnetic fields that permeate the large-scale structure (e.g. Dolag, Bartelmann & Lesch 1999; Miniati et al. 2001; Brüggen et al. 2005). Given the strong interconnection between the origin of the WHIM and gravitational shocks, it is possible for the WHIM to be magnetised, although it might be difficult to predict to what level.
While magnetic fields have been unambiguously detected in the cores of galaxy clusters, few observations have attempted to establish the presence of magnetised plasma in low density regions such as groups and filaments. However, there is now compelling evidence that magnetic fields might exist beyond clusters, and in particular in the WHIM. Kim et al. (1989) claim the detection of an extended magnetic field in the region of the Coma supercluster. They observe radio-synchrotron radiation from a region with an enhanced number density of galaxies, seeming to indicate the presence of a group of galaxies, perhaps in the process of merging with the Coma cluster. Evidence for intergalactic magnetic fields in the region ZwCL 2341+0000 at , where galaxies seems to lie along a filament, has been reported by Bagchi et al. (2002). In both cases, the inferred strength of the magnetic field is of order G.
Several mechanisms have been proposed to explain the injection of seed magnetic fields into the intracluster and intergalactic media, later to be amplified by cosmic shear and gravitational shocks. Among them, primordial magnetic fields, jets and radio lobes emerging from radio galaxies (e.g. Hoyle 1969; Chakrabarti et al. 1994; Enßlin et al. 1997) and galactic winds (e.g. Kronberg et al. 1999; Bertone et al. 2006). Simulations (Kronberg et al. 1999; Kronberg et al. 2001; Bertone et al. 2006) show that magnetic fields can be efficiently transported into the IGM and fill most of the universe by . Bertone et al. (2006) predict that galactic winds alone could be responsible for IGM magnetic fields of order G, in agreement with observations.
8 Conclusions
The search for the “missing baryons” has opened the way to our understanding of the most elusive baryonic component in the universe: the hot diffuse gas that traces the cosmic web.
Given the paucity of observational findings, most of what we know about the WHIM is based on numerical simulations. These predict that at up to 50 per cent of the IGM has been heated to temperatures in the range K. While most of the heating is provided by gravitational accretion shocks propagating out of regions undergoing gravitational collapse, non-gravitational processes such as galactic winds and AGN feedback may play an important role in high density regions, mostly by preventing cooling and regulating the intensity of the X-ray background.
The observability of the WHIM by future facilities has received a lot of attention and a wealth of predictions have been made based on numerical results. The detection of the WHIM seems to be extremely challenging, if not impossible, with current instruments and a new generation of X-ray telescopes with higher sensitivity and spectral resolution, such as Constellation-X and XEUS, is needed to study the WHIM in absorption. In addition to high sensitivity and spectral resolution, high spatial resolution on a large field of view, as proposed for the Explorer of Diffuse emission and Gamma-ray burst Explosions (EDGE), would be ideal for mapping the WHIM emission on the sky.
Although most theoretical predictions claim optimistically that we will be able to detect the WHIM in absorption with Constellation-X and XEUS, and maybe in emission with some luck, there is a long way to go before observations can confirm the simulation predictions, or show us a different picture altogether of what and where the WHIM is.
Acknowledgements.
We are grateful to Frits Paerels and Philipp Richter for a careful reading of the manuscript. We thank ISSI (Bern) for support of the team “Non-virialized X-ray components in clusters of galaxies”. This work was supported by a Marie Curie Excellence Grant MEXT-CT-2004-014112. SB acknowledges support from STFC and from a NSF grant AST-0507117.References
- Bagchi et al. (2002) Bagchi, J., Enßlin, T.A., Miniati, F., et al., 2002, New Astronomy, 7, 249
- Barcons et al. (2000) Barcons, X., Mateos, S., & Ceballos, M T., 2000, MNRAS, 361, 13
- Bertone et al. (2006) Bertone, S., Vogt, C., & Enßlin, T.A., 2006, MNRAS, 370, 319
- Bonamente et al. (2001) Bonamente, M., Lieu, R., & Mittaz, J.P.D., 2001, ApJ, 547, L7
- Bregman (2007) Bregman, J.N., 2007, ARA&A, 45, 221
- Bryan & Voit (2001) Bryan, G.L., & Voit, G.M., 2001, ApJ, 556, 590
- Brüggen et al. (2005) Brüggen, M., Ruszkowski, M., Simionescu, A., Hoeft, M., & Dalla Vecchia, C., 2005, ApJ, 631, L21
- Bykov et al. (2008) Bykov, A.M., Dolag, K., & Durret, F., 2008, SSR, in press
- Cao et al. (2006) Cao, L., Zuo, W., & Chu, Y.-Q., 2006, Mod. Phys. Lett. A, 21, 2233
- Cen & Ostriker (1999) Cen, R., & Ostriker, J.P., 1999, ApJ, 514, 1
- Cen et al. (2001) Cen, R., Tripp, T.M., Ostriker, J.P., & Jenkins, E.B., 2001, ApJ, 559, L5
- Cen & Fang (2006) Cen, R., & Fang, T., 2006, ApJ, 650, 573
- Cen & Ostriker (2006) Cen, R., & Ostriker, J.P., 2006, ApJ, 650, 560
- Chakrabarti et al. (1994) Chakrabarti, S.K., Rosner, R., & Vainshtein, S.I., 1994, Nature, 368, 434
- Chen et al. (2003) Chen, X., Weinberg, D.H., Katz, N., & Davé, R., 2003, ApJ, 594, 42
- Cheng et al. (2005) Cheng, L.-M., Borgani, S., Tozzi, P., et al., 2005, A&A, 431, 405
- Croft et al. (2006) Croft, R.A.C., Banday, A.J.R., & Hernquist, L., 2006, MNRAS, 369, 1090
- Croft et al. (2001) Croft, R.A.C., Di Matteo, T., Davé R., et al., 2001, ApJ, 557, 67
- Danforth & Shull (2007) Danforth, C. W., & Shull, J. M., 2007, ApJ, submitted (astro-ph/0709.4030)
- Davé et al. (1999) Davé, R., Hernquist, L., Katz, N., & Weinberg, D. H. 1999, ApJ, 511, 521
- Davé et al. (2001) Davé, R., Cen, R., Ostriker, J.P., et al., 2001, ApJ, 552, 473
- Dolag et al. (2006) Dolag, K., Meneghetti, M., Moscardini, L., Rasia, E., & Bonaldi, A., 2006, MNRAS, 370, 656
- Dolag, Bartelmann & Lesch (1999) Dolag, K., Bartelmann, M., & Lesch, H., 1999, A&A, 348, 351
- Dolag et al. (2008) Dolag, K., Borgani, S., Schindler, S., Diaferio, A., Bykov, A., 2008, SSR, in press
- Durret et al. (2008) Durret, F., Kaastra, J., Nevalainen, J., Ohashi, T., & Werner, N., 2008, SSR, in press
- Enßlin et al. (1997) Enßlin, T.A., Biermann, P.L., Kronberg, P.P., & Wu, X., 1997, ApJ, 477, 560
- Fang & Bryan (2001) Fang, T., & Bryan, G.L., 2001, ApJ, 561, L31
- Fang et al. (2002) Fang, T., Bryan, G.L., & Canizares, C.R., 2002, ApJ, 564, 604
- Fang et al. (2005) Fang, T., Croft, R.A.C., Sanders, W.T., et al., 2005, ApJ, 623, 612
- Finoguenov et al. (2003) Finoguenov, A., Briel, G.U., & Henry, P.J., 2003, A&A, 410, 777
- Fukugita & Peebles (2004) Fukugita, M., & Peebles, P.J.E., 2004, ApJ, 616, 643
- Fukugita et al. (1998) Fukugita, M., Hogan, C.J., & Peebles, P.J.E., 1998, ApJ, 503, 518
- Furlanetto & Loeb (2004) Furlanetto S.R., & Loeb A., 2004, ApJ, 611, 642
- Furlanetto et al. (2004) Furlanetto, S.R., Schaye, J., Springel, V., & Hernquist, L., 2004, ApJ, 606, 221
- Furlanetto et al. (2005) Furlanetto, S.R., Phillips, L.A., & Kamionkowski, M., 2005, MNRAS, 359, 295
- Hallman et al. (2007) Hallman, E.J., O’Shea, B.W., Burns, J.O., et al., ApJ, in press (astro-ph/0704.2607)
- Hansen et al. (2005) Hansen, F.K., Branchini, E., Mazzotta, P., Cabella, P., & Dolag, K., 2005, MNRAS, 361, 753
- Hasinger et al. (1993) Hasinger, G., Burg, R., Giacconi, R., et al., 1998, A&A, 329, 482
- Hellsten et al. (1998) Hellsten, U., Gnedin, N.Y., & Miralda-Escudé, J., 1998, ApJ, 509, 56
- Hernandez-Monteagudo et al. (2004) Hernandez-Monteagudo, C., Genova-Santos, R., & Atrio-Barandela, F., 2004, ApJ, 613, L89
- Hoyle (1969) Hoyle, F., 1969, QJRAS, 10, 10
- Kang et al. (2005) Kang, H., Ryu, D., Cen, R., & Song, D., 2005, ApJ, 620, 21
- Kawahara et al. (2006) Kawahara, H., Yoshikawa, K., Sasaki, S., et al., 2006, PASJ, 58, 657
- Kim et al. (1989) Kim, K.-T., Kronberg, P.P., Giovannini, G., & Venturi, T., 1989, Nature, 341, 720
- Kravtsov et al. (2002) Kravtsov, A.V., Klypin, A., & Hoffman, Y., 2002, ApJ, 571, 563
- Kronberg et al. (1999) Kronberg, P.P, Lesch, H., & Hopp, U., 1999, ApJ, 511, 56
- Kronberg et al. (2001) Kronberg, P.P., Dufton, Q.W., Li, H., & Colgate, S.A., 2001, ApJ, 560, 178
- Lieu et al. (1996) Lieu, R., Mittaz, J.P.D., Bowyer, S., et al., 1996, ApJ, 458, L5
- Miniati et al. (2001) Miniati, F., Jones, T.W., Kang, H., & Ryu, D., 2001, ApJ, 562, 233
- Mittaz et al. (2004) Mittaz, J.P.D., Lieu, R., Cen, R., & Bonamente, M., 2004, ApJ, 617, 860
- Miyaji et al. (2000) Miyaji, T., Hasinger, G., & Schmidt, M., 2000, A&A, 353, 25
- Nath & Silk (2001) Nath, B.B., & Silk, J., 2001, MNRAS, 327, L5
- Olive et al. (2000) Olive, K.A., Steigman, G., & Walker, T.P., 2000, Phys. Rep., 333, 389
- Paerels et al. (2008) Paerels, F.B.S., Kaastra, J.S., Ohashi, T., et al., 2008, SSR, in press
- Pen (1999) Pen, U.L., 1999, ApJ, 510, L1
- Perna & Loeb (1998) Perna, R., & Loeb, A., 1998, ApJ, 503, L135
- Persic & Salucci (1992) Persic, M., & Salucci, P., 1992, MNRAS, 258, 14
- Phillips et al. (2001) Phillips, L.A., Ostriker, J.P., & Cen, R., 2001, ApJ, 554, L9
- Pierre et al. (2000) Pierre, M., Bryan, G., & Gastaud, R., 2000, A&A, 356, 403
- Rakowski (2005) Rakowski, C.E., 2005, Adv. Sp. Res., 35, 1017
- Rasera & Teyssier (2006) Rasera, Y., & Teyssier, R., 2006, A&A, 445, 1
- Rauch et al (1997) Rauch, M., Miralda-Escudé, J., Sargent, W.L.W., et al., 1997, ApJ, 489, 7
- Richter et al. (2004) Richter, P., Savage, B.D., Tripp, T.M., & Sembach, K.R., 2004, ApJS, 153, 165
- Richter et al. (2006) Richter, P., Fang, T., & Bryan, G.L., 2006, A&A, 451, 767
- Richter et al. (2008) Richter, P., Paerels, F.B.S., Kaastra, J.S., 2008, SSR, in press
- Roncarelli et al. (2006) Roncarelli, M., Moscardini, L., Tozzi, P., et al., 2006, MNRAS, 368, 74
- Schaye (2001) Schaye, J., 2001, ApJ, 559, 507
- Spergel et al. (2007) Spergel, D.N., Bean, R., Doré, O., et al., 2007, ApJS, 170, 377
- Sunyaev & Zel’dovich (1972) Sunyaev, R., & Zel’dovich, Y., 1972, A&A, 20, 189
- Teyssier et al. (1998) Teyssier, R., Chièze, J.-P., Alimi, J.-M., 1998, ApJ, 509, 62
- Ursino & Galeazzi (2006) Ursino E., & Galeazzi M., 2006, ApJ, 652, 1085
- Valageas et al. (2002) Valageas, P., Schaeffer, R., & Silk, J., 2002, A&A, 388, 741
- Viel et al. (2003) Viel, M., Branchini, E., Cen, R., et al., 2003, MNRAS, 341, 792
- Viel et al. (2005) Viel, M., Branchini, E., Cen, R., et al., 2005, MNRAS, 360, 1110
- Voit et al. (2001) Voit, G.M., Evrard, A.E., & Bryan, G.L., 2001, ApJ, 548, L123
- Voit & Bryan (2001) Voit, G.M., & Bryan, G.L., 2001, ApJ, 551, L139
- Weinberg et al. (1997) Weinberg, D.H., Miralda-Escude, J., Hernquist, L., & Katz, N., 1997, ApJ, 490, 564
- Yoshida et al. (2005) Yoshida, N., Furlanetto, S.R., & Hernquist, L., 2005, ApJ, 618, L91
- Yoshikawa et al. (2003) Yoshikawa, K., Yamasaki, N.Y., Suto, Y., et al., 2003, PASJ, 55, 879
- Yoshikawa et al. (2004) Yoshikawa, K., Dolag, K., Suto, Y., et al., 2004, PASJ, 56, 939
- Yoshikawa & Sasaki (2006) Yoshikawa, K., & Sasaki, S., 2006, PASJ, 58, 641
- Worsley et al. (2005) Worsley, M.A., Fabian, A.C., Bauer, F.E., et al., 2005, MNRAS, 357, 1281
- Wu et al. (2001) Wu, K.K.S., Fabian, A.C., & Nulsen, P.E.J., 2001, MNRAS, 324, 95
- Zhang & Pen (2003) Zhang, P., Pen, U.-L., 2003, ApJ, 588, 704