An evolution of the IR-Radio correlation at very low flux densities?
Abstract
In this paper we investigate the radio-MIR correlation at very low flux densities using extremely deep 1.4 GHz sub-arcsecond angular resolution MERLINVLA observations of a 8585 field centred upon the Hubble Deep Field North, in conjunction with Spitzer 24 m data. From these results the MIR-radio correlation is extended to the very faint (microJy) radio source population. Tentatively we detect a small deviation from the correlation at the faintest IR flux densities. We suggest that this small observed change in the gradient of the correlation is the result of a suppression of the MIR emission in faint star-forming galaxies. This deviation potentially has significant implications for using either the MIR or non-thermal radio emission as a star-formation tracer of very low luminosity galaxies.
keywords:
galaxies:starburst galaxies: high-redshift infrared: galaxies radio continuum: galaxies1 Introduction
Since 1970s and 1980s studies of the radio and far-infrared (FIR) properties of galaxies have shown there to be a tight correlation between their emission in these two observing bands which extends over several orders of magnitude in luminosity (van der Kruit, 1973; Condon et al., 1982). The advent of the Infrared Astronomical Satellite (IRAS) All Sky Survey in 1983 (Neugebauer et al., 1984; Soifer et al., 1987) enabled much larger systematic samples of galaxies to be studied at infrared wavelengths and hence further demonstrated the consistency and tightness of this correlation, albeit for relatively nearby sources (Helou et al., 1985; de Jong et al., 1985; Condon & Broderick, 1986; Condon et al., 1991; Yun et al., 2001). Following IRAS, deep observations using the Infrared Space Observatory (ISO) allowed fainter and higher redshift galaxies to be observed at mid-infrared (MIR) wavelengths. These ISO observations showed that the MIR emission from galaxies is loosely correlated with radio emission across a wide range of redshifts, tentatively extending to z4 (Cohen et al., 2000; Elbaz et al., 2002; Garrett, 2002).
More recently the launch of the Spitzer Space Telescope in August 2003 has greatly increased the sensitivity of MIR observations and hence our ability to study the MIR-radio correlation. Early results, such as from the Spitzer First Look Survey (FLS), have confirmed that the MIR-radio correlation holds for relatively bright star-forming galaxies (S Jy) out to at least a redshift of 1 (Appleton et al., 2004).
Radio and infrared emission from galaxies in both the nearby and distant Universe is thought to arise from processes related to star-formation, hence resulting in the correlation between these two observing bands. The infrared emission is produced from dust heated by photons from young stars and the radio emission predominately arises from synchrotron radiation produced by the acceleration of charged particles from supernovae explosions. It has however recently been suggested that at low flux density and luminosities there may be some deviation from the tight well-known radio-IR correlation seen for brighter galaxies (Bell, 2003; Boyle et al., 2007).
Bell (2003) argue that while the IR emission from luminous galaxies will trace the majority of the star-formation in these sources, in low luminosity galaxies the IR emission will be less luminous than expected considering the rate of star-formation within the source (i.e. the IR emission will not fully trace the star-formation). In this scenario the reduced efficiency of IR production relative to the source star-formation rate (SFR) would be the result of inherently lower dust opacities in lower luminosity sources and consequently less efficient reprocessing of UV photons from hot young stars into IR emission. The simple consequence of this is that at lower luminosities the near linear radio-IR correlation LL, with (e.g Cox et al., 1988; Price & Duric, 1992) will be deviated from. Of course such an assertion is dependent upon the radio emission providing a reliable tracer of star-formation at low luminosities which may be equally invalid.
Recently Boyle et al. (2007) have presented a statistical analysis of Australia Telescope Compact Array (ATCA) 20 cm observations of the 24 m sources within two regions (the Chandra Deep Field South (CDFS) and the European Large Area ISO Survey S1 (ELAIS)) of the Spitzer Wide Field Survey (SWIRE). In this work Boyle et al. (2007) have co-added sensitive (rms30 Jy) radio data at the locations of several thousand 24 m sources. Using this method they have statistically detected the microJy radio counterparts of faint 24 m sources. At low flux densities (SJy) they confirm the IR-radio correlation but find it to have a lower coefficient (S = 0.039 S) than had previously been reported at higher flux densities. This coefficient is significantly different from results previously derived from detections of individual objects (e.g. Appleton et al. 2004) and is speculated by Boyle et al. (2007) to be the result of a change in the slope of the radio-IR correlation at low flux densities.
In this paper, we utilise very deep, high resolution 20 cm observations of the Hubble Deep Field North and surrounding area made using MERLIN and the VLA (Muxlow et al., 2005) in combination with publicly available 24 m Spitzer source catalogues from GOODS to study the MIR-Radio correlation for microjansky radio sources. This study extends the flux density limits of the radio-IR correlation by more than an order of magnitude for individual sources and overlaps the flux density regime studied using statistical stacking methods by Boyle et al. (2007). Additionally we employ statistical stacking methods, similar to those used by Boyle et al. (2007), to extend the correlation further to still lower flux densities.
We adopt H75 km s-1 Mpc-1, and =0.7 throughout this paper.
2 Data and Analysis
2.1 MERLINVLA observations
Extremely deep radio observations of the HDF-N region were made in 1996-97 at 1.4 GHz using both MERLIN and the VLA. These observations were initially presented in Muxlow et al. (2005), Richards et al. (1998) and Richards (2000). The results from the combined 18 day MERLIN and 42 hr VLA observations are described in detail in Muxlow et al. (2005). The combined MERLINVLA image has an rms noise level of 3.3 Jy per 02 circular beam making it amongst the most sensitive, high-resolution radio images made to date.
Using the same methods as described in Muxlow et al. (2005) these combined MERLIN and VLA observations have been used to image the entire unaberrated field of view, 8.58.5 arcmin2 in size, centred upon the original MERLIN pointing position (h 36m 494000, ° 12′ 58000 (J2000))111Public access to these radio data will be made available via an on-demand radio imaging tool developed by the authors using Virtual Observatory tools. A detailed explanation of this service can be found in Richards et al. (2007).. This image has an rms noise level of 3.6 Jy beam-1 and has been convolved with a 04 circular beam. These observations have been shown to align with the International Coordinate Reference Frame (ICRF) to better than 15 mas (Muxlow et al., 2005).
2.2 GOODS-N Spitzer 24 m observations
As part of the GOODS enhanced data release222http://www.stsci.edu/science/goods/DataProducts/ (DR1+ February 2005) a catalogue of Spitzer 24 m source positions and flux densities for the GOODS-N field were released. This source catalogue is limited to flux densities 80 Jy providing a highly complete and reliable sample. At the time of writing this 24 m source catalogue represents the most complete and accurate mid-infrared source list publicly available for the GOODS-N/HDF-N field.
All 24 m sources which are detected optically in GOODS HST ACS images show an accurate astrometric alignment with their optical counterparts implying that the astrometry between these two data-sets and their subsequent catalogues is self-consistent. However, a comparison of the astrometric alignment of the positions of sources catalogued by GOODS derived from their HST ACS images (Richards et al. 2007; Muxlow et al. in prep) shows there to be a systematic offset in declination of 0342 from the radio reference frame. This linear declination correction, although small relative to the Spitzer resolution at 24 m is significant when compared to these high resolution radio data. This linear correction has been applied to the Spitzer source positions prior to all comparisons between the two data sets.
| Survey | Radio | Instrument | Radio senitivity | Angular | Reference |
|---|---|---|---|---|---|
| Survey Area | (Jy beam-1) | Resolution | |||
| HDF-N/GOODS-N | 72.25 arcmin2 | VLA+MERLIN | 3.3 | 0202 | Muxlow et al. 2005, this paper |
| ATLAS (CDFS/ELAIS) | 3.7 deg2 | ATCA | 2060 | 115 | Norris et al. 2006 |
| Spitzer FLS | 5 deg2 | VLA | 23 | 5 | Condon et al. 2003, Fadda et al. 2006 |
2.3 Measurement of source radio flux densities
The field covered by these GOODS-N Spitzer 24 m observations contains 1199 24-m sources identified with flux densities 80 Jy. The 8.58.5 arcmin2 radio field contains 377 of these Spitzer sources with 24 m flux densities ranging from 80.1 to 1480 Jy.
Radio emission with the deep MERLIN+VLA data has been measured at the corrected position of each individual 24 m source within the radio image. The radio flux density was measured within a series of concentric rings with a maximum radius of 4 arcsec centred on each 24 m source. Statistical analysis of these measurements and a sample of stronger radio sources within the same field shows that the radio flux density increases within progressively larger annuli out to a radius of 15. For stronger () radio sources the total flux density recovered using this method within a radius of 15 is between 90 and 100 of the source’s total flux density as measured by other means, such as Gaussian fitting. Additionally the average (either mean or median) radial profile of all of the 24 m sources shows that almost all of the radio flux density is recovered within radii less than 15 (Beswick et al. 2006; Beswick et al. in prep). Throughout the rest of this paper the radio flux density recovered within a radius of 15 of each IR Spitzer source will be assumed to be equal to the total radio source flux density.
As a confirmation of this method several thousand random sky positions within the radio field were selected and cross-referenced to exclude any which were at the positions of known sources at any wavelengths. At each of these blank positions the radio flux density was measured using an identical method as outlined above. The flux densities recorded within each of these annuli showed no positive bias within any ring and followed the same Gaussian distribution as derived from the pixel-by-pixel noise statistics of the whole image once all radio sources greater than 40 Jy have been subtracted. As further test of these methods 90 fake, faint () and partially-resolved radio sources were injected into the u-v data. These data were then Fourier inverted and cleaned in an identical manner to the real data and then the flux densities of these fake sources were extracted using the methods outlined above. Whilst, as expected, these sources were not detected individually their radio emission, when averaged together, was consistent with the average flux density of the population of fake sources injected into the data.
A more detailed description of this method and the radio characteristics of this sample of 24 m Spitzer source, including source catalogues and size information, will be presented in a forthcoming paper.
3 Results
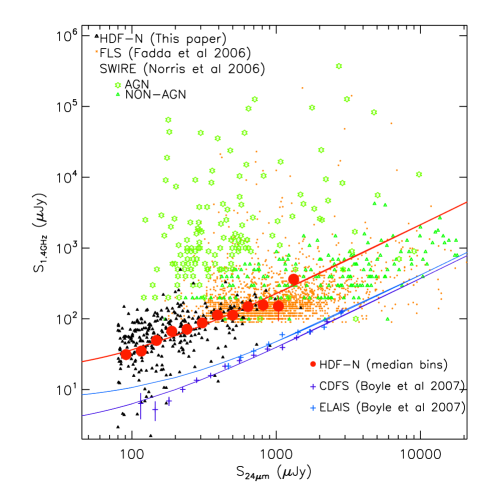
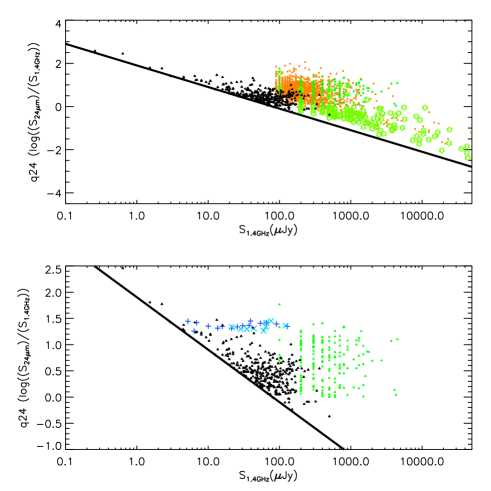
Of the 377 24 m Spitzer sources within the radio field 303 were found, by this method, to have total radio flux densities greater than 3 times the local map rms. Many of these source have peak flux densities below 3- and hence were not selected using the radio-only detection methods employed by Muxlow et al. (2005). The 1.4 GHz versus 24 m flux densities of all 377 of these source are plotted in left-hand panel of Fig 1. The control sample, plotted in the right-hand panel of Fig 1, is derived using an identical radio flux extraction methods and from the same radio data but at randomly assigned locations coincident with no known source position. The flux densities of these sources are also plotted in Fig 2, along with sources detected in the shallower surveys of the CDFS-SWIRE field by Norris et al. (2006) using ATCA, and the Spitzer FLS using the VLA by Fadda et al. (2006). Sources from the southern CDFS-SWIRE field which have been categorised by Norris et al. (2006) as containing AGN (plotted as stars) are generally situated toward the upper half of this figure and show an expected radio excess when compared to their 24 m flux densities. Source which were not identified as AGN by Norris et al. (2006) are plotted as triangles in this figure. It should be noted that these sources have not been classified as containing an AGN but may in fact be either AGN, star-forming galaxies or a combination of the two.
Overlaid in blue in the lower half of Fig. 2 are the flux densities of groups of median stacked infrared sources from the ELAIS and CDFS field from Boyle et al. (2007) along with fits to these data. Also overlaid, as filled red circles, in this figure are the median values of all of the HDF-N sources logarithmically binned by their 24 m flux densities. There is a clear discrepancy between the averaged radio flux densities derived from these HDF-N observations and the flux densities from the ELAIS and CDFS fields (Boyle et al., 2007) which will be discussed further in the following sections.
| Binned data | Stacked images | ||||||
| Median | Mean | Median | Mean | ||||
| S | Number | S | S | Number | S | S | |
| (Jy) | (Jy) | (Jy) | (Jy) | (Jy) | (Jy) | ||
| 88.8 | 65 | 28.9 | 22.6 | 0.68 | 65 | 26.78 | 27.86 |
| 112.5 | 72 | 34.1 | 32.0 | 0.62 | 70 | 34.07 | 32.95 |
| 138.9 | 57 | 49.5 | 47.7 | 0.81 | 54 | 63.19 | 58.17 |
| 174.7 | 46 | 58.8 | 56.1 | 1.21 | 44 | 64.810 | 60.48 |
| 219.4 | 49 | 69.4 | 90.7 | 1.68 | 49 | 76.18 | 90.46 |
| 275.0 | 22 | 72.5 | 79.0 | 3.01 | 22 | 81.913 | 53.34 |
Using an analysis method similar to Boyle et al. (2007) the mean and median images of the radio emission from HDF-N field of the 6 lowest 24 m flux density logarithmic bins (as plotted in Figs. 1 and 2) have been derived and are shown in Fig. 3. Each of these images is the statistically combined radio emission from the location of several tens of Spitzer 24 m sources and has been contoured at multiples of three times 3.3 Jy beam-1 divided by where N equals the number of Spitzer source positions that have been stacked together. As can be seen in these images the off-source noise levels achieved approaches the value expected when co-adding multiple images with near-Gaussian noise properties. The co-added image rms achieved in the faintest 24 m flux density bin (80.0 to 100.25 Jy) is 0.45 and 0.56 Jy beam-1 in the mean and median co-added images respectively. The flux densities measured directly from these stacked radio images are consistent with the statistical mean and median flux densities within the equivalent bins derived from the individual source flux extraction method described in Section 2.3 (Table 2) and plotted in Figs. 1 and 2. In each stacked image the largest angular size of the regions showing elevated radio emission within Fig. 3 is enclosed within the 15 radius circular area from which the individual source flux densities have been extracted.
The sizes of the composite radio sources in these co-added images (Fig. 3) represent a combination of the true radio source size, any offsets between the IR and radio emitting regions within the sources and any random errors in the Spitzer source positions, all of which will be convolved with the synthesised beam applied to these radio data (04 circular beam in this case). No systematic offset is seen between the emission in these composite radio images from their nominal image centres implying that no significant non-random errors between the astrometric alignment of these data-sets remain. Further analysis of the radio source sizes and structures will be the subject of a future paper.
In Fig. 3 the mean (left) images of the radio emission for the two highest 24 m flux density bins are dominated by emission from a few bright sources. Several of these brighter radio sources can be seen in Fig. 1 scattered above S200 Jy. The presence of these brighter radio sources and the low numbers of images stacked together is clearly evident when the mean and median averaged images are compared. In particular in the second brightest bin (197.27 to 247.27 Jy) two mJy radio sources are present and offset from their equivalent 24 m position. It is likely that these bright radio sources, which deviate from the radio-IR correlation, may contain radio AGN which would feasibly be spatially offset from any ongoing star-formation and 24 m position.
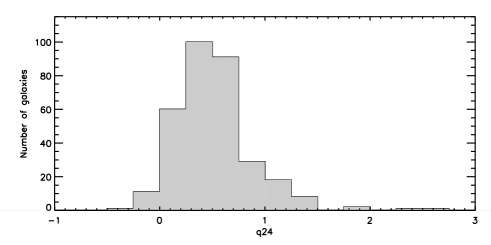
An alternative method of projecting the correlation between these 24 m and 1.4 GHz data is as a function of the commonly defined parameter q24, where q24 = log(S/S). The mean and median value of q24 for all of the HDF-N sources presented in this study is 0.52 and 0.48 respectively, compared to the value of 0.690.36 and 0.73 derived from non-AGN sources catalogued in observations of the SWIRE field by Norris et al. (2006). A similar study of brighter sources in the Spitzer FLS (Appleton et al., 2004) show the mean value to be (q24 =0.840.28) slightly higher than average value derived here. The distribution of q24 values for all sources in this HDF-N study is shown in Fig. 4.
In Figs. 5, 6, 7 and 8 the parameter q24 is plotted against S, S and redshift. The monochromatic value of q24 represents the slope of the IR-radio correlation and the size of dispersion in q24 is related to the strength of the correlation. In each of these figures no k-correction has been applied to either the radio or IR luminosities since we have incomplete redshifts for the sample, and inadequate spectral information is known about the majority of the individual sources in either the IR or radio bands. A similar study by Appleton et al. (2004) has shown that k-corrections made to individual sources result in only a minimal systematic effect on the average value of q24 below redshift 1.
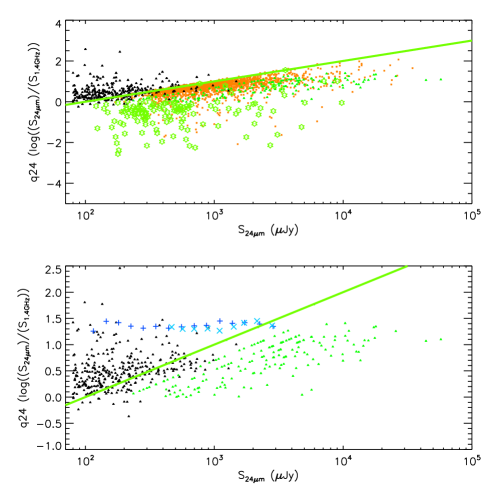
In Fig. 5 the values of q24 for sources from these HDF-N data, the SWIRE field (Norris et al., 2006) and the Spitzer FLS field (Fadda et al., 2006) are plotted against 24 m flux density. In the upper panel both the AGN identified and non-AGN sources of Norris et al. (2006) are shown whilst in the lower panel the AGN sources are excluded for clarity. In the upper panel the AGN sources from the SWIRE field, as expected, deviate from the correlation generally showing an excess of 1.4 GHz radio emission compared to their 24 m emission. The HDF-N field covers a considerably smaller area and was originally chosen to have few bright radio-AGN, which is confirmed by the minimal number of HDF-N sources displaying an excess of 1.4 GHz radio emission. Amongst the HDF-N sources and the non-AGN sources from the SWIRE field (Norris et al., 2006, and Fig. 5 here) q24 shows a small trend toward lower values at smaller 24 m flux densities. The SWIRE sources plotted here have been selected to have both radio and IR flux density above a certain threshold. The lowest radio flux density of sources within the SWIRE field catalogue (Norris et al., 2006) is 100 Jy. A line of constant radio flux density (100 Jy, the lowest individual source detections in the SWIRE catelogue) is overlaid on Fig. 5 above which sources from the SWIRE study are excluded. The HDF-N radio data plotted here has a sensitivity limit 10 times lower than that of the SWIRE data, thus potentially only excluding sources in the extreme top left-hand part of this plot. Furthermore, the sample of sources plotted here has been subject to no radio detection threshold limit hence removing this potential bias completely.
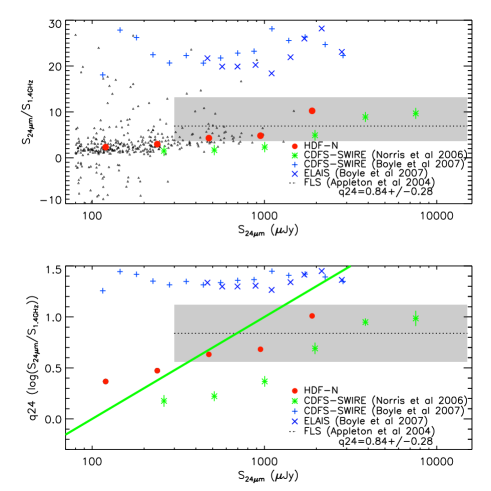
The q24 values for the HDF-N data and the sources from Norris et al. (2006) binned as a function of S, along with the ratio of S and S are shown in Fig 6. Especially within the binned points, these two plots show a tentative trend for low q24 and with declining 24 m flux density. The gray areas and dotted line in these two panels show the value of the q24 as derived from the Spitzer FLS (Appleton et al., 2004). The HDF-N observations presented here are consistent with those of Appleton et al. (2004) at high 24m flux densities.
The effect of the 24 m sensitivity cut-off (80.1 Jy) in the GOODS-N data and the equivalent limit in the data of Norris et al. (2006) will, however, positively bias measurements of q24 at low radio flux densities. This is clearly shown in Fig. 7. The lower flux density limit imposed by the Spitzer sensitivity results in an exclusion of sources in the lower portion of Fig. 7. This consequently biases the determination of the value of q24 for any complete sample of sources with low radio flux densities.
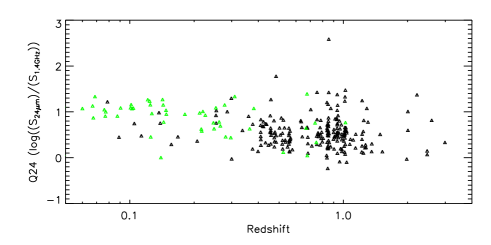
Of the 377 Spitzer source within the 8585 HDF-N radio field, 259 of these galaxies have published spectroscopic or photometric redshifts. The q24 values for this subset of sources, along with 50 non-AGN SWIRE sources, are plotted with respect to their redshift in Fig 8. Within these two data-sets q24 is seen to slightly reduce at higher redshifts although this effect is small and significantly less than the scatter. These values of q24 have not been k-corrected. The application of a k-correction to these data will result in a small increase in q24 which will increase as a function of z. It is interesting to also note that recent studies of discrete areas within 4 very nearby star-forming galaxies (Murphy et al., 2006a) have shown q24 to vary across the extent of individual sources. However, Murphy et al. (2006a) derive a mean value of q241 when integrating over entire galaxies in their sample, at z0, which is consistent with many of the source in both the SWIRE and HDF-N samples but somewhat higher than the average value derived at higher redshifts.
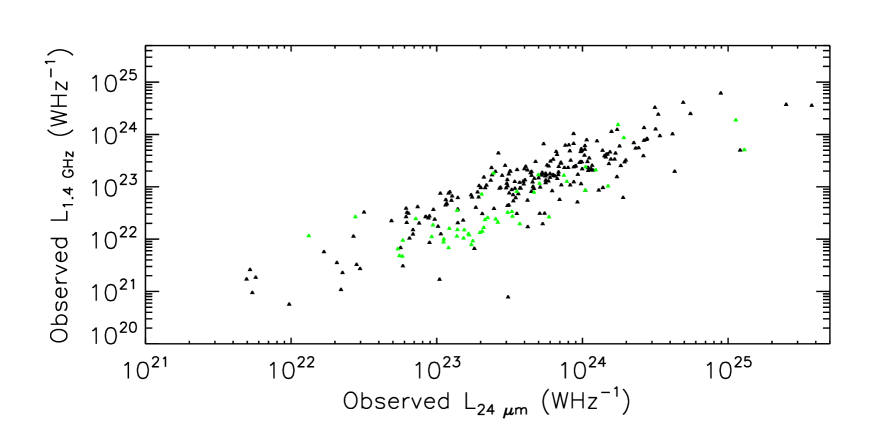
Using the available redshifts the observed luminosity has been calculated and is plotted in Fig. 9, including both the sources in the HDF-N region and the non-AGN sources in the SWIRE field. As can be seen in Fig. 9 the 24 m-to-1.4 GHz correlation, for individual sources, extends down to L W Hz-1 (L W Hz-1).
4 Discussion
4.1 Radio emission from faint 24 m sources:-
Extending the
IR-Radio correlation
The primary results of this work demonstrate that this sample of individual 24 m selected sources follow the MIR-radio correlation down to radio flux densities of a few microJy. These results are consistent with shallower independent radio surveys (such as the ATCA observations of the SWIRE field) and seamlessly extend the IR-radio correlation down to lower flux densities (see Fig. 2).
The majority of the IR selected sources within the HDF-N region have radio flux densities less than 100 Jy, with only a few sources which show a significant excess of 1.4 GHz flux density, when compared to the IR-radio correlation. This implies that the vast majority of these IR-selected microJy radio sources are primarily driven by star-formation with little significant contamination from AGN. This is consistent with the results of Muxlow et al. (2005) who find that below 100 Jy greater than 70 percent of radio sources are starburst systems. However, the data presented here are based on an IR selected sample rather than a radio selected sample. This will inherently result in the sample being dominated by star-forming systems but will not exclude the presence of a population of weak microJy AGN sources.
At the positions of the majority of the lowest 24 m flux densities sources the peak radio emission is not significantly greater than the image rms. As a consequence most of these sources were not formally identified in the previous radio study (Muxlow et al., 2005). In many case, especially at low 24 m flux densities, the extracted total radio flux density of individual sources is close to the radio sensitivity of these data (Fig 1). When directly compared with the control sample (Fig 1, Right), which has been compiled by extracting the radio flux density from blank areas within the same data using identical methods, a significant correlation between the strength of the total radio and 24 m emission is evident. However, the radio sensitivity limit of these data precludes the detailed discussion of individual low flux density sources.
4.1.1 The average radio emission from the faintest IR sources
The radio emission from many of the individual low flux density 24 m sources is too faint to be imaged with high signal-to-noise in these radio data. However, it is possible to characterise their average radio emission by either binning the measured radio excess at their locations or by forming composite radio images from many sources. With the relatively limited sample of IR sources which are co-spatial with these radio observations (377 in total) it is only statistically viable to use either binning or image stacking methods at the lowest IR flux densities where the number of sources that can be combined becomes large.
Overlaid in Figs. 1 and 2 are the median flux densities of IR sources in the HDF-N region imaged here. These bins have been logarithmically sampled as a function of 24 m flux density and include all sources within these bins regardless of their measured radio flux density. Whilst at the lowest emission levels the radio flux densities of individual sources will be subject to moderate or large errors the binned ensemble of these points will robustly represent the flux distribution of sample as a whole. Using the radio flux densities extracted at the positions of the individual 24 m sources, significant radio emission is detected in every averaged 24 m flux density bin.
To further test the viability of measuring the statistical radio flux density from sources in this sample below the formal radio detection limit of these MERLIN+VLA data, the images have been stacked at the positions of multiple IR sources, binned as a function of their 24 m flux density (Fig. 3). These postage-stamp images have been averaged on a pixel-by-pixel basis, where each pixel in the stacked image is either the mean or median value of the pixels within the individual 24 m source image stacks. Each of the 6 lowest bins, for both the mean and median averaged images, show significant levels of radio emission. The 1.4 GHz flux density in these images, extracted via Gaussian fitting, is consistent with the binned level of emission derived from measuring individual sources, demonstrating the validity of either method (Table 2).
The sub-arcsecond angular resolution of these MERLIN+VLA observations, in conjunction with their relatively good u-v coverage, allow the average radio structures of faint IR sources to be investigated. The median and mean images in Fig. 3, especially in the two highest flux density bins show some distinct differences. These differences arise due to inclusion of a few bright radio sources which dominate the average emission included in these bins. In particular in the second highest flux density mean image several ‘bright’ radio sources are offset from the map centre. The positional offset of radio emission from these sources is real and indicates that, at least in these cases, that the origins of the radio and IR emission are different.
The Gaussian fitted sizes of the radio emission in the stacked images (Fig 3) provide an upper limit on the average size of the radio counterparts of these faint IR sources. The largest angular sizes of the radio emission in the median stacked images created from this sample range between 14 and 2″. This is approximately equivalent to a linear size of 10 kpc at redshifts beyond 1. These upper limits on the radio source sizes are consistent with radio emission on galactic and sub-galactic scales and originating within kpc-scale starburst systems. A more detailed analysis of the sizes and structures of the radio emission from both these composite images (Fig. 3) and the individual sources themselves is beyond the scope of this paper and will be presented in a latter publication.
4.1.2 Comparison with other results
Two directly comparable studies of the 1.4 GHz radio and 24 m MIR emission from sources in the Spitzer FLS and the SWIRE fields have been made by Appleton et al. (2004) and Boyle et al. (2007) respectively. Appleton et al. (2004) compared observations of the Spitzer FLS made by Condon et al. (2003) using the VLA in its B-configuration (5″restoring beam) with 24 m and 70 m Spitzer observations. These observations had a detection threshold of 90 Jy and 500 Jy at 1.4 GHz and 24 m respectively. Whereas Boyle et al. (2007) co-added deep (30 Jy/bm) 1.4 GHz ATCA observations of the southern SWIRE field at the positions of many thousands of Spitzer 24 m sources, regardless of their detection at radio wavelengths, in order to statistically detect radio emission at the few Jy level. As a comparison to the HDF-N observations presented here, data points from the SWIRE field (Norris et al., 2006), the Spitzer FLS (Fadda et al., 2006) and the co-added flux densities derived by Boyle et al. (2007) are plotted in Figs. 2, 5, 6 and 7.
Using the Spitzer FLS Appleton et al. (2004) studied MIR to radio correlation for 508 sources with redshift information, confirming results from similar previous surveys. Following this work Fadda et al. (2006) have published a more comprehensive catalogue of 17,000 24 m sources from the Spitzer FLS of which 2415 have radio counterparts within 4″. Just over 2000 sources with radio counterparts within 15 are plotted in Figs. 2, 5 and 7. In general the sources plotted follow the MIR to radio correlation but these data contain many outliers with elevated radio emission, characteristic of galaxies containing AGN.
The study of Appleton et al. (2004) included sources with S0.5 mJy and S90 Jy. The majority of this sample have redshifts of 1. The mean (non-k-corrected) value of q24 derived by Appleton et al. (2004) is 0.840.28, which is shown in Fig 6. The non-AGN sources detected at both 1.4 GHz and 24 m within the SWIRE field catalogued by Norris et al. (2006) are also plotted in Figs. 2, 5 and 7. These sources are limited to 0.1 mJy and 170Jy at 1.4 GHz and 24 m respectively. Using only the sources within the SWIRE field identified as not being AGN by Norris et al. (2006) the mean (non-k-corrected) values of q24 is 0.690.39. The radio flux density threshold of both of these surveys overlaps with the brighter radio sources in this MERLIN+VLA study.
These deep HDF-N MERLIN+VLA observations trace individual sources with considerably fainter flux density than those observed in the SWIRE and Spitzer FLS surveys. These observations (Figs. 2, 5 and 7) are consistent with the extrapolation to lower flux densities of results found previously (e.g. Appleton et al., 2004; Norris et al., 2006; Fadda et al., 2006). However both the SWIRE and Spitzer FLS surveys which sample sources with somewhat higher flux densities sources have mean values of q24 which are consistent but slightly higher than the value of 0.520.37 derived from these HDF-N data.
Averaging together the radio emission from multiple 24 m Spitzer source within the CDFS and ELAIS fields Boyle et al. (2007) have traced the radio emission against MIR sources with flux densities comparable to those detected in these more sensitive HDF-N observations. Boyle et al. (2007) have exploited the large number of MIR sources detected in these fields to average together multiple radio images made at the MIR source positions and statistically detect radio emission significantly below their radio detection threshold. This method is directly comparable to the methods applied to these radio observations of the HDF-N and is identical to the methods used to produce the stacked images presented in Fig. 3 and Table 2. The median stacked radio flux densities of MIR sources derived by Boyle et al. (2007) show a significantly reduced S relative to S (i.e. higher q24 value) compared with the distribution of individual sources detected in the Spitzer FLS (Fadda et al., 2006; Appleton et al., 2004), the catalogued SWIRE sources (Norris et al., 2006) or the HDF-N results presented here. Whilst there are several differences between the studies of Boyle et al. (2007) and those presented here, such as the sensitivity (rms 30 Jy versus 3 Jy) and angular resolution (6″versus 04) of the two surveys, it remains hard to simply reconcile these results.
Boyle et al. (2007) recognised the inconsistency of their calculated values of q24(=1.39) when compared with 0.84 derived by Appleton et al. (2004) and have extensively simulated and tested the correctness of their analysis methods. Since the results of Boyle et al. (2007) are based on an infrared-selected sample with no radio detection limit, this discrepancy could possibly be explained by the presence of a previously unknown population of faint radio sources with a low radio to infrared flux density ratio. However the values derived by Boyle et al. (2007) are not confirmed in the study presented here.
A possible alternative explanation may be that the ATCA observations are underestimating the radio flux density of sources at the lowest flux densities when compared to these other surveys which have used radio data obtained using the VLA and/or MERLIN. It is interesting to note that an earlier deep survey using the ATCA at 1400 MHz (ATESP, Australia Telescope ESO Slice Project) Prandoni et al. (2000) found, upon comparison with NVSS flux densities for the same field, that whilst for bright sources the ATCA and NVSS flux density values were consistent, for faint sources the ATCA results underestimated the radio flux densities by up to a factor of 2 compared with the VLA NVSS. This underestimation of radio flux density was seen by Prandoni et al. (2000) to increase with diminishing radio brightness. Whilst it remains unclear as to the cause, or reality, of this effect, if applicable to the ELAIS and CDFS fields, it could result in the elevated values of q24 seen by Boyle et al. (2007) at very low radio flux densities.
4.2 An evolution in the IR-radio correlation?
It has been suggested, both theoretically (Bell, 2003) and observationally (Boyle et al., 2007), that the IR-radio correlation may evolve at lower flux densities. One of the aims of this study is to investigate this correlation for very low flux density radio sources.
Derived from the HDF-N data alone the average value of q24 shows a small trend to reduce as a function of lower values of S24μm (Fig. 5 & 6). This can be further demonstrated by splitting these data into two approximately equal samples, above and below S24μm=150 Jy. The mean and median values of q24 for the 187 sources below 150 Jy are 0.45 and 0.36 respectively, compared with 0.56 and 0.54 derived from the 190 sources with S150 Jy. These HDF-N results along with results from samples of brighter galaxies (Appleton et al., 2004; Norris et al., 2006) are broadly consistent with average q24 reducing as a function of decreasing S24μm (see Fig. 5 & 6).
There are several contributing factors which will affect these results and those from previous studies. These factors include biases introduced by flux density thresholds of observations, the application or non-application of k-corrections and possible AGN contamination of sample galaxies.
Previous studies, such as Appleton et al. (2004), have used samples of sources detected at both radio and infrared wavelengths. The implications of a radio detection limit on these results will be to exclude sources with high q24 at low S. The line overlaid on Fig. 5 represents the upper limit imposed on the ATCA observations of the SWIRE survey by the radio detection threshold of these data (Norris et al., 2006). In a manner similar to that used by Boyle et al. (2007) no radio detection limit has been applied during analysis of these MERLIN+VLA data with the radio flux density being recorded for all MIR sources regardless of significance of their radio detection. This method will result in errors in the measured radio flux densities for very weak individual radio sources but will not directly bias against larger values of q24. However when many sources are statistically averaged together the mean and median value of detected radio emission and hence the derived value of q24 will be robust even for source considerably fainter than the radio detection threshold of these data.
No direct k-correction has been applied to these HDF-N flux density results because in many cases the spectral shapes and redshifts of objects are not known adequately enough to apply any correction with confidence. Additionally previous studies, such as by Appleton et al. (2004), have shown that the application of k-corrections to individual sources below z=1 only introduces a small change to the average value of q24 as a function of redshift. Of the sources with known redshifts in our sample 78 percent have redshifts less than 1, and thus will be minimally affected. Within Figs. 5 and 7 the values of q24 for individual sources are plotted against their flux densities at each wavelength. These sources sample a wide range of luminosities and redshifts and hence the systematic effects resulting from not applying a k-correction will effect individual sources but will cause only minimal changes in any overall trend of the sample as a function of flux density. However, the effects of the application of a k-correction to these data do warrant further discussion.
Assuming that the 24 m sources identified in this sample are predominately powered by star-formation, at an observed radio frequency of 1.4 GHz the emission will be dominated by non-thermal synchrotron emission from supernovae and supernova remnants (Muxlow et al., 2007). As such the non-thermal radio signal will be boosted by a factor of (1+)0.7, assuming a synchrotron power law (S). This k-correction will become incorrect for the highest redshift sources as the rest-frame radiation will be shifted to higher radio frequencies where the emission from other mechanisms such as thermal free-free emission will become increasingly important. For example a source at redshift of 2.5 the radio emission observed at 1.4 GHz will have been emitted at a rest-frame frequency of 5 GHz at which point an increasing proportion of the radio emission from a star-forming galaxy will arise from thermal processes resulting in a reduction in the radio spectral slope and hence k-correction that should be required.
Accurately k-correcting the Spitzer 24 m flux densities requires detailed knowledge of the mid-IR spectral template of the individual sources. In particular, for sources at redshifts significant spectral features from PAHs and silicates observed in local starburst galaxies (e.g. Brandl et al., 2006) are shifted into the Spitzer 24 m band which can result in large additional k-correction factors. The inclusion of these line features can result in an increase of a factor of 2 or more in S compared with commonly used starburst spectral templates (Fadda et al., 2006; Yan et al., 2007). This is equivalent to a change in q24 of approximately 0.3. The general effect of the MIR k-correction, resulting from a spectral index of a starburst galaxy excluding line emission, will be to boost S as a function of redshift by an amount that will depend upon spectral slope of the galaxy template used. For a luminous starburst this will result in a boosting with a MIR spectral slope (Yan et al., 2007). As such the effect of this k-correction applied to the 24 m data will be larger than that applied to the 1.4 GHz data, hence the overall effect will be to increase the value of q24 as a function of redshift.
Uncorrected q24 is plotted against redshift for the sources with known spectroscopic or photometric redshifts in Fig 8. Applying k-corrections to these data points will result in a small increase in q24 for the highest redshift sources plotted. Within the scatter of the small sample of sources plotted in Fig 8 no significant trend is observed as a function of redshift to z3. This is consistent with previous studies (e.g. Garrett, 2002; Appleton et al., 2004).
4.2.1 Potential contamination from AGN
In addition to instrumental and analysis effects outlined above it is possible that the flux densities of sources recorded in this study may include some proportion of contamination by embedded AGN (Richards et al., 2007). The effect of the inclusion of sources with significant AGN emission is demonstrated by the AGN sources from the SWIRE survey (Norris et al., 2006) which are overlaid as stars in Figs. 2, 5 and 7. In general, sources with a significant AGN contribution show an excess of radio emission compared to their infrared luminosity, hence will deviate from the IR-radio correlation. Consequently the result of any AGN contamination within the HDF-N Spitzer sample analysed here will be to reduce q24. However, the flux densities of the HDF-N sample (see Fig. 2) show only a very small number of sources with excessive radio flux density which deviates significantly from the IR-radio correlation extrapolated from high flux density samples. This is to be expected since it is now generally accepted that below 100 Jy the vast majority of radio sources are predominantly powered by star-formation (Richards, 2000; Gruppioni et al., 2003; Seymour et al., 2004; Muxlow et al., 2005). Additionally this sample of sources is selected at 24 m rather than at radio wavelengths and hence will preferentially select star-forming sources rather than radio AGN. Thus, throughout this paper no direct distinction has been made between possible AGN and non-AGN star-forming galaxies in these faint Spitzer selected HDF-N radio sources. However, a small AGN contamination within the sources sampled cannot be eliminated. The consequences of any AGN contamination may, to some degree, offer an explanation for the lower values of q24 derived here (see for example Daddi et al., 2007).
4.3 Causes and implications of an evolution in the IR-radio correlation
In the previous section a small trend in q24 as a function of 24 m flux density has been tentatively identified. This trend is small and only visible in statistically averaged deep radio observations. The much deeper radio surveys that will be made using the newly enhanced radio instruments such as e-MERLIN and the EVLA will constrain the faint end of the IR-radio correlation, confirming or refuting any possible deviations.
Whilst there are several observational and analysis effects which may contribute to the observed trend in the IR-radio correlation (outlined in the previous sections) there are also physical mechanisms which may cause an effect similar to that tentatively observed. Both the IR and radio emission from star-forming galaxies are indirectly linked with the rate of ongoing star-formation; simplistically the non-thermal radio emission originates in accelerated charged particles in supernovae and supernova remnants and the IR emission results from the reprocessing by dust of light from hot young stars. This inferred connection is generally considered to result in the IR-correlation. However since both the radio and IR emission are linked with star-formation via complex physical processes it is remarkable that the luminosity in these two bands correlates so accurately over such a large range of luminosities. A recent study by Bell (2003) has provided a detailed investigation of the relationship of the radio and total infrared emission of galaxies and their star-formation rates. In this work several competing physical factors which will affect the IR and radio emission from star-forming galaxies are considered which at low luminosities potentially cause a deviation in the IR-radio correlation similar to that which is very tentatively reported here.
If we assume that the non-thermal radio emission from star-forming galaxies is directly proportional to the star-formation rate (i.e. radio SFR), then the systematic reduction in q24 at low 24 m flux density implies that the 24 m emission is no longer efficiently tracing the SFR of the galaxy (Bell, 2003). Observational evidence (e.g. Wang & Heckman, 1996; Adelberger & Steidel, 2000; Hopkins et al., 2001; Buat et al., 2002) has shown that galaxy luminosity and dust opacity to UV and H emission are correlated, demonstrating that lower luminosity galaxies have substantially less dust absorption and reddening than high luminosity sources. These studies have also shown that the ratio of far-UV to IR light is significantly lower in less luminous sources, implying that whilst for luminous galaxies the IR provides a good tracer of star-formation at low luminosities much of the far-UV emission from star-formation is not reprocessed as IR emission (see Wang & Heckman, 1996; Buat et al., 2002; Bell, 2003, for further discussion). The consequences of the reduced dust opacity in lower luminosity, presumable smaller, sources will be a reduction in the efficiency of reprocessing of starlight into IR emission and hence will result in an observable decrease in the ratio of IR-to-radio emission from sources at low luminosities. Of course it should be reiterated that this makes the assumption that the radio emission is a ‘perfect’ tracer of the star-formation which may equally not be true.
It has been suggested that the synchrotron radio emission from low-luminosity galaxies can also be suppressed, implying that it is not a true tracer of the SFR (Klein et al., 1984, 1991; Price & Duric, 1992). Whilst the connection between non-thermal radio emission and star-formation is complex, it has been discussed, both on the basis of models of the physical mechanisms and observational evidence, by many authors (see for example Völk, 1989; Chi & Wolfendale, 1990; Helou & Bicay, 1993). A physical explanation for the suppression of the non-thermal radio emission in low-luminosity galaxies is that the accelerating electrons can escape these sources because they have less efficient cosmic-ray confinement than in larger, more luminous sources (Chi & Wolfendale, 1990).
Radio surveys of IR sources prior to the very deep results presented here have not detected any significant deviations in the linearity of the radio-IR correlation (e.g. Condon et al., 1991; Yun et al., 2001; Appleton et al., 2004). Bell (2003) argue that this observed linearity at relatively low luminosities implies that both the IR and non-thermal radio emission do not adequately trace the star-formation in low luminosity sources. As such the observed linearity of the IR-radio correlation arises because the two independent physical mechanisms by which the emission in these bands originates both result in an underestimate of the SFR at low luminosities by a similar amount, thus preserving the observed linear nature of the correlation in a conspiratorial way (Bell, 2003). However, these two competing physical trends whilst similar in magnitude will diverge for very low luminosity sources resulting in a reduction in the IR-to-radio ratio. This effect can be seen in (figures 3 and 8 from Bell, 2003) and is tentatively hinted at in the observation presented here (Fig. 5).
Not withstanding the factors, discussed in the previous section which may effect this tentative detection of a small deviation in the gradient of the IR-radio correlation, these observational results are broadly consistent with the models of Bell (2003). If this observed evolution of the IR-radio correlation at low flux densities is real it potentially has significant implications on the use of either IR or radio luminosities for the derivation of star formation rates of faint galaxies in future deep surveys.
4.4 Future observational tests
Future observations will be required to confirm this tentative deviation of the IR-to-radio correlation at these extremely low flux densities. These results may be tested further by i) deeper radio and infrared observations which detect many faint individual sources at high significance, ii) significantly larger area deep surveys that allow robust statistical detections of faint sources to be made, or iii) the separation and analysis of the various competing factors which contribute to this effect.
The stacked radio images of extremely faint IR sources presented in Fig. 3 provide a tantalising glimpse of the images which will be routinely available in the near future. The next-generation of radio interferometers, such as e-MERLIN (Garrington et al.,, 2004) and the EVLA (Perley, 2000), will provide images many tens of times more sensitive than can currently be made. Future deep radio observations using e-MERLIN and the EVLA with integration times comparable to those presented here will produce images with sub-microJy noise levels. Surveys using these instruments will easily be able to detect all of the IR sources so far found in the deepest Spitzer observations with very high confidence, and the high sensitivity of these instruments will allow much larger areas of microJy radio sky to be surveyed. Such high-sensitivity and wide-field observations will constrain any low flux density deviations in the radio-IR correlation.
The radio observations presented here primarily trace the non-thermal synchrotron radio emission of galaxies with flux densities of a few tens of Jy. At 1.4 GHz 90 percent of the emission of a typical L spiral galaxy is non-thermal emission with the remainder coming from thermal bremsstrahlung processes (Condon, 1992). Whereas the radio synchrotron, as stated previously is indirectly related to star-formation, the bremsstrahlung emission is a more direct tracer of the ongoing star-formation since it arises from thermal radio emission from gas ionised by hot, young stars. At higher radio frequencies (10 GHz) thermal radio emission will begin to dominate over synchrotron emission (Condon, 1992; Price & Duric, 1992) tending to flatten the radio spectrum of star-forming galaxies. Determining the relative fraction of thermal and non-thermal radio emission in different sources and at different frequencies is non-trivial requiring multi-frequency measurements of the radio flux densities in order to determine the slope of non-thermal emission. Such observations will be more feasible using future extremely deep radio observations planned with the new generation of wide-bandwidth radio interferometers, such as e-MERLIN and the EVLA, which will allow sensitive multi-frequency radio observations of the distant Universe to be made within reasonable observation times. Using observations made with these enhanced centimetre instruments along with measurements made using longer wavelength radio interferometers like the Giant Metrewave Radio Telescope (GMRT) and LOw Frequency ARray (LOFAR) it will be possible to constrain the radio spectral energy distribution of many star-forming galaxies hence allowing the thermal and non-thermal radio emission to be separated. By disentangling the thermal and non-thermal radio luminosities of many distant star-forming galaxies it will be possible to verify the expected suppression of IR emission from low luminosity sources relative to the thermal radio emission which is a more direct, extinction free, tracer of the star-formation.
5 Conclusions
Using one of the deepest high-resolution 1.4 GHz observations made to date, in conjunction with deep 24 m Spitzer source catalogues from GOODS, we have investigated the microJy radio counterparts of faint MIR sources. These observations confirm that the microJy radio source population follow the MIR-radio correlation and extend this correlation by several orders of magnitude to very low flux densities and luminosities, and out to moderate redshifts. This extension of the MIR-radio correlation confirms that the majority of these extremely faint radio and 24 m sources are predominantly powered by star-formation with little AGN contamination.
Statistically stacking the radio emission from many tens of faint 24 m sources has been used to characterise the size and nature of the radio emission from very faint IR galaxies well below the nominal radio sensitivity of these data. Using these methods the MIR-radio correlation has been further extended and a tentative deviation in this correlation at very low 24 m flux densities has been identified.
Acknowledgments
The authors wish to thank Ray Norris, Brian Boyle, Phil Appleton and Nick Seymour for extremely useful discussions. RJB acknowledges financial support by the European Commission’s I3 Programme “RADIONET” under contract No. 505818. This work is based on observations made with MERLIN, a National Facility operated by the University of Manchester at Jodrell Bank Observatory on behalf of STFC, and the VLA of the National Radio Astronomy Observatory is a facility of the National Science Foundation operated under cooperative agreement by Associated Universities, Inc. This work is based in part on archival data obtained with the Spitzer Space Telescope, which is operated by the Jet Propulsion Laboratory, California Institute of Technology under a contract with NASA. Support for this work was provided by an award issued by JPL/Caltech.
References
- Adelberger & Steidel (2000) Adelberger, Kurt L., Steidel, Charles C., 2000, ApJ, 544, 218
- Appleton et al. (2004) Appleton, P. N., Fadda, D. T., Marleau, F. R., Frayer, D. T., Helou, G., Condon, J. J., Choi, P. I., Yan, L., Lacy, M., Wilson, G., Armus, L., Chapman, S. C., Fang, F., Heinrichson, I., Im, M., Jannuzi, B. T., Storrie-Lombardi, L. J., Shupe, D., Soifer, B. T., Squires, G. & Teplitz, H. I., 2004 ApJS, 154, 147
- Bell (2003) Bell, Eric, F. 2003, ApJ, 586, 794
- Bell & Kennicutt (2001) Bell, Eric F., Kennicutt, Robert C., Jr., 2001, ApJ, 548, 681
- Beswick et al. (2006) Beswick, R. J., Muxlow, T. W. B., Thrall, H., Richards, A. M. S., 2006, To appear in the proceedings of ’At the Edge of the Universe’ (9-13 October 2006, Sintra, Portugal) Eds. Alfonso et al (astro-ph/0612077)
- Boyle et al. (2007) Boyle, B. J., Cornwell, T. J., Middelberg, E., Norris, R. P., Appleton, P. N., Smail, Ian, 2007, MNRAS, 376, 1182
- Buat et al. (2002) Buat, V., Boselli, A., Gavazzi, G., Bonfanti, C., 2002, A&A, 383, 801
- Brandl et al. (2006) Brandl, B. R., Bernard-Salas, J., Spoon, H. W. W., Devost, D., Sloan, G. C., Guilles, S., Wu, Y., Houck, J. R., Weedman, D. W., Armus, L., Appleton, P. N., Soifer, B. T., Charmandaris, V., Hao, L., Higdon, J. A. Marshall, S. J., Herter, T. L., 2006, ApJ, 653, 1129
- Chi & Wolfendale (1990) Chi, X., Wolfendale, A. W. 1990, MNRAS, 245, 101
- Cohen et al. (2000) Cohen, Judith G., Hogg, David W., Blandford, Roger, Cowie, Lennox L., Hu, Esther, Songaila, Antoinette, Shopbell, Patrick & Richberg, Kevin, 2000, ApJ, 538, 29
- Condon et al. (1982) Condon, J. J., Condon, M. A., Gisler, G. & Puschell, J., 1982, ApJ, 252, 102
- Condon & Broderick (1986) Condon, J. J. & Broderick, J. J., 1986, AJ, 92, 94
- Condon et al. (1991) Condon, J. J., Anderson, M. L., Helou, G., 1991, ApJ, 376, 95
- Condon (1992) Condon, J. J., 1992, ARA&A, 30, 575
- Condon et al. (2003) Condon, J. J., Cotton, W. D., Yin, Q. F., Shupe, D. L., Storrie-Lombardi, L. J., Helou, G., Soifer, B. T., Werner, M. W. 2003, AJ, 125, 2411
- Cox et al. (1988) Cox, M. J., Eales, S. A. E., Alexander, P., Fitt, A. J., 1988, MNRAS, 235, 1227
- Daddi et al. (2007) Daddi, E., Alexander, D. M., Dickinson, M., Gilli, R., Renzini, A., Elbaz, D., Cimatti, A., Chary, R., Frayer, D., Bauer, F. E., Brandt, W. N., Giavalisco, M., Grogin, N. A., Huynh, M., Kurk, J., Mignoli, M., Morrison, G., Pope, A., Ravindranath, S., 2007, ApJ, 670, 173
- de Jong et al. (1985) de Jong, T., Klein, U., Wielebinski, R. & Wunderlich, E., 1985, A&A, 147, L6
- Elbaz et al. (2002) Elbaz, D., Cesarsky, C. J., Chanial, P., Aussel, H., Franceschini, A., Fadda, D. & Chary, R. R., 2002, A&A, 384, 848
- Fadda et al. (2006) Fadda, Dario, Marleau, Francine R., Storrie-Lombardi, Lisa J., Makovoz, David, Frayer, David T., Appleton, P. N., Armus, L., Chapman, S. C., Choi, P. I., Fang, F., Heinrichsen, I., Helou, G., Im, M., Lacy, M., Shupe, D. L., Soifer, B. T., Squires, G. K., Surace, J., Teplitz, H. I., Wilson, G., Yan, L., 2006, AJ, 131, 2859
- Garrett (2002) Garrett, M. A., 2002, A&A, 384, 19L
- Garrington et al., (2004) Garrington, Simon T., Anderson, B., Baines, C., Battilana, J. A., Bentley, Mike N., Brown, D., Burgess, P., Diamond, Philip J., Kitching, G. J., McCool, Roshene, Muxlow, T. W., Noble, R. G., Roddis, Neil, Spencer, R. E., Thomasson, P., 2004, Ground-based Telescopes. Edited by Oschmann, Jacobus M., Jr. Proceedings of the SPIE, Volume 5489, pp. 332-343
- Gruppioni et al. (2003) Gruppioni, C., Pozzi, F., Zamorani, G., Ciliegi, P., Lari, C., Calabrese, E., La Franca, F., Matute, I., 2003, MNRAS 241, L1
- Helou et al. (1985) Helou, G., Soifer, B. T. & Rowan-Robinson, M., 1985, ApJ, 298, 7
- Helou & Bicay (1993) Helou, G., Bicay, M. D., 1993, ApJ, 415, 93
- Hopkins et al. (2001) Hopkins, A. M., Connolly, A. J., Haarsma, D. B., Cram, L. E., 2001, AJ, 122, 288
- Klein et al. (1984) Klein, U., Wielebinski, R., Thuan, T. X., 1984, A&A, 141, 241
- Klein et al. (1991) Klein, U., Weiland, H., Brinks, E., 1991, A&A, 246, 323
- Murphy et al. (2006a) Murphy, E. J., Braun, R., Helou, G., Armus, L., Kenney, J. D. P., Gordon, K. D., Bendo, G. J., Dale, D. A., Walter, F., Oosterloo, T. A., Kennicutt, R. C., Jr., Calzetti, D., Cannon, J. M., Draine, B. T., Engelbracht, C. W., Hollenbach, D. J., Jarrett, T. H., Kewley, L. J., Leitherer, C., Li, A., Meyer, M. J., Regan, M. W., Rieke, G. H., Rieke, M. J., Roussel, H., Sheth, K., Smith, J. D. T., Thornley, M. D., 2006, ApJ, 638, 157
- Murphy et al. (2006b) Murphy, E. J., Helou, G., Braun, R., Kenney, J. D. P., Armus, L., Calzetti, D., Draine, B. T., Kennicutt, R. C., Jr., Roussel, H., Walter, F., Bendo, G. J., Buckalew, B., Dale, D. A., Engelbracht, C. W., Smith, J. D. T., Thornley, M. D., 2006, ApJ, 651, L111
- Muxlow et al. (2005) Muxlow, T. W. B., Richards, A. M. S., Garrington, S. T., Wilkinson, P. N., Anderson, B., Richards, E. A., Axon, D. J., Fomalont, E. B., Kellermann, K. I., Partridge, R. B., Windhorst, R. A. 2005 MNRAS, 358, 1159
- Muxlow et al. (2007) Muxlow, T. W. B., Beswick, R. J., Richards, A. M. S., Thrall, H. J., 2007, in Proc. Conf. The 8th European VLBI Network Symposium on New Developments in VLBI Science and Technology, Edd. A. Marecki et al. (astro-ph/0611951)
- Neugebauer et al. (1984) Neugebauer, G., Habing, H. J., van Duinen, R., Aumann, H. H., Baud, B., Beichman, C. A., Beintema, D. A., Boggess, N., Clegg, P. E., de Jong, T., Emerson, J. P., Gautier, T. N. Gillett, F. C., Harris, S., Hauser, M. G., Houck, J. R., Jennings, R. E., Low, F. J., Marsden, P. L., Miley, G., Olnon, F. M., Pottasch, S. R., Raimond, E., Rowan-Robinson, M., Soifer, B. T., Walker, R. G., Wesselius, P. R. & Young, E., 1984, ApJ, 278, L1
- Norris et al. (2006) Norris, Ray P., Afonso, José, Appleton, Phil N., Boyle, Brian J., Ciliegi, Paolo, Croom, Scott M., Huynh, Minh T., Jackson, Carole A., Koekemoer, Anton M., Lonsdale, Carol J., Middelberg, Enno, Mobasher, Bahram, Oliver, Seb J., Polletta, Mari, Siana, Brian D., Smail, Ian, Voronkov, Maxim A., 2006, AJ, 132, 2409
- Perley (2000) Perley, Richard, A., 2000, Proc. SPIE Vol. 4015, p. 2-7, Radio Telescopes, Ed. Harvey R. Butcher, vol 4015, page 2
- Prandoni et al. (2000) Prandoni, I., Gregorini, L., Parma, P., de Ruiter, H. R., Vettolani, G., Wieringa, M. H., Ekers, R. D., 2000, A&A Supp. Ser. 146, 41
- Price & Duric (1992) Price, Rob., Duric, Nebojsa., 1992, ApJ, 401, 81
- Richards et al. (1998) Richards, E. A., Kellermann, K. I., Fomalont, E. B., Windhorst, R. A., Partridge, R. B., 1998, AJ, 116, 1039
- Richards (2000) Richards, E. A., 2000, ApJ, 533, 611
- Richards et al. (2007) Richards, A. M. S., Muxlow, T. W. B., Beswick, R. J., Allen, M. G., Benson, K., Garrett, M. A., Garrington, S. T, Gonzalez-Solarez, E., Harrison, P. A., Kettenis, M., Laing, R. A., Richards, E. A., Thrall, H., van Langevelde, H. J., Walton, N. A., Wilkinson, P. N., Winstanley, N., 2007 A&A 472, 805 (astro-ph/0706.3777)
- Seymour et al. (2004) Seymour, N., McHardy, I. M., Gunn, K. F., 2004, MNRAS, 352, 131
- Soifer et al. (1987) Soifer, B. T., Sanders, D. B., Madore, B. F., Neugebauer, G., Danielson, G. E., Elias, J. H., Lonsdale, Carol J. & Rice, W. L., 1987, ApJ, 320, 238
- Völk (1989) Völk, H. J., 1989, A&A, 218, 67
- van der Kruit (1973) van der Kruit, P. C., 1973, A&A, 29, 263
- Wang & Heckman (1996) Wang, Boqi., Heckman, Timothy M. 1996, ApJ, 457, 645
- Yan et al. (2007) Yan, Lin., Sajina, Anna., Fadda, Dario., Choi, Phil., Armus, Lee., Helou, George., Teplitz, Harry., Frayer, David., Surace, Jason. 2007, ApJ, 658, 778
- Yun et al. (2001) Yun, Min S., Reddy, Naveen A., Condon, J. J., 2001, ApJ, 554, 803