Photophoretic Structuring of Circumstellar Dust Disks
Abstract
We study dust accumulation by photophoresis in optically thin gas disks. Using formulae of the photophoretic force that are applicable for the free molecular regime and for the slip-flow regime, we calculate dust accumulation distances as a function of the particle size. It is found that photophoresis pushes particles (smaller than 10 cm) outward. For a Sun-like star, these particles are transported to AU, depending on the particle size, and forms an inner disk. Radiation pressure pushes out small particles ( mm) further and forms an extended outer disk. Consequently, an inner hole opens inside AU. The radius of the inner hole is determined by the condition that the mean free path of the gas molecules equals the maximum size of the particles that photophoresis effectively works on ( cm, depending on the dust property). The dust disk structure formed by photophoresis can be distinguished from the structure of gas-free dust disk models, because the particle sizes of the outer disks are larger, and the inner hole radius depends on the gas density.
Subject headings:
circumstellar matter — planetary systems: formation — solar system: formation1. Introduction
Protoplanetary disks are composed of gas and dust. At initial stages of their evolution, the gas of protoplanetary disks is as massive as (Greaves 2004), and small dust particles are mixed with the gas, making the disks optically thick at optical wavelengths. As the dust particles grow, the number of small particles reduces, and at a certain stage, the disks become optically thin (Tanaka et al. 2005; Dullemond & Dominik 2005). The amount of gas also decreases, as the gas dissipates (e.g., Hartmann et al. 1998; Clarke et al. 2001; Takeuchi et al. 2005; Alexander et al. 2006a,b). At late stages of the disk evolution, the disks become gas-free dust disks, which are observed as Vega-type disks. During the transition from protoplanetary disks to Vega-type disks, there may be a stage where the disks are optically thin, but their gas component still remains. An example is HD 141569A, which is a 5 Myr Herbig Be star (Weinberger et al. 2000) and has an optically thin dust disk (Augereau et al. 1999; Weinberger et al. 1999; Fisher et al. 2000; Mouillet et al. 2001; Marsh et al. 2002; Clampin et al. 2003). The gas component of this system has been observed (Zuckerman 1995; Dent et al. 2005; Goto et al. 2006) and its amount is estimated to be (Ardila et al. 2005).
Dynamics of dust particles in optically thin gas disks is of interest in order to investigate the structure of transitional disks. Krauss & Wurm (2005) considered the motion of dust particles in a gas disk that is optically thin at optical wavelengths. A dust particle receives stellar radiation directly, and the radiation pressure pushes the particle outward. In addition to radiation pressure, interaction between the particle and the surrounding gas molecules induces photophoresis, which also pushes the particle outward (see also Wurm & Krauss 2006; Krauss et al. 2007). When these outward accelerations act with the gas drag on the particle, the particle drifts outward (Takeuchi & Artymowicz 2001). In the outer part of the disk ( AU), where the mean free path of the gas molecules is larger than the particle size (of m), the photophoretic force is proportional to the gas density. When a particle moves outward to the point where the gas density is no longer high enough to induce a strong photophoretic force, the particle’s outward motion stops. Consequently, the dust particles pile-up at a certain distance from the star that is determined by the density profile of the gas disk. In a gas disk with mass , particles of to 10 cm pile-up at several tens of AU. This spontaneous ring formation is a characteristic feature that is caused by photophoresis in a gaseous dust disk.
Krauss et al. (2007) have demonstrated that photophoretic dust motion may be the key process for the transition from optically thick protoplanetary disks to optically thin circumstellar disks with ring-like dust distributions via the stage of transitional disks with an inner hole and a more or less sharp transition to the outer disk that is continuously pushed outward. This outward dust migration can also explain the presence of material formed close to the sun like chondrules and CAIs in asteroids of the main asteroid belt (Wurm & Krauss 2006) or high temperature crystalline silicates in comets from the Kuiper belt (Petit et al. 2006; Brownlee et al. 2006; Mousis et al. 2007).
In this paper, we seek to investigate other characteristic structures formed by photophoresis, especially in the inner part of the disk, but at a stage when most of the dust has already been built into larger bodies. Krauss & Wurm (2005) focus on the dust dynamics in the outer part of the disk ( AU) and use a formula for the photophoretic force that is relevant for low gas densities. In order to investigate the structure of the whole disk, we use a photophoresis formula that can be applied to the whole range of gas densities. Details of the formula for the photophoretic force adopted here are described in §2. Using this formula, we find that photophoresis does not induce dust pile-up at the innermost region of the disk ( AU), leading to the formation of an inner hole (see §3). At the inner part of the gas disk, the gas density may be too high that the gas disk itself is no longer optically thin to the stellar radiation, and thus any radiation effects on the dust such as radiation pressure and photophoresis do not work at all. In order to investigate whether photophoresis still works at the inner disk, in §4, we calculate the optical depth of the disk due to Rayleigh scattering of the hydrogen molecules. In §5.1, the thermal relaxation time of dust particles is estimated and is compared to the rotation periods induced by gas turbulence and by photophoresis. In §5.2, we discuss what are the characteristic features that photophoresis forms in dust disks, and what are the observable differences from the gas-free dust disk structures. In Appendix A, a simple calculation deriving the photophoretic force is described.
2. Radial Drift of Dust Particles
2.1. Forces Acting on Dust Particles
We consider the motion of a dust particle that resides in a gas disk around a star. The gas disk is assumed to be optically thin in the radial direction. This means that the dust particle directly receives the radiation of the central star. The stellar radiation that is absorbed or scattered by the particle pushes it outward. This outward force, which is called radiation pressure (Burns et al. 1979), is given by
| (1) |
where we assume that the particle is spherical and its radius is , is the efficiency factor of the radiation pressure and assumed to be unity in this paper, and is the speed of light. We assume that the particle is on the midplane of the gas disk and the distance from the central star is . The flux of the stellar radiation at the particle position is
| (2) |
where is the luminosity of the central star. Poynting-Robertson (PR) drag can be neglected comparing to gas drag. Even in a gas disk whose mass is as small as several earth mass, gas drag is much stronger than PR drag as discussed below in §3.4 (see also Takeuchi & Artymowicz 2001).
If the particle’s hemisphere facing the central star becomes hotter than the opposite hemisphere, the particle receives the photophoretic force in addition to the radiation pressure. Because, in general, the particle rotates with a certain speed, a considerable temperature gradient appears only if the thermal relaxation time of the particle is much smaller than the rotation period (see discussion in §5.1 below), or if the rotation axis is aligned in the direction of the light source (Krauss et al. 2007). In this paper, we assume that the effect of the particle rotation can be neglected. In this case, the photophoretic force is directed in the radial direction and its value can be analytically calculated. In Appendix A, we describe estimate of the photophoretic force derived by a simple model of cylindrical dust particles, but we use the rigorous formulae that have been derived in the literature in the following discussion.
We consider a spherical dust particle of radius . The mean temperature of the particle is in general different from the surrounding gas temperature . In this paper, we simply assume that . The temperature gradient inside the particle is assumed to be small, and then the photophoretic force is calculated by solving linearized perturbation equation of the temperature. In Appendix A, we discuss the cases where the above assumptions are not valid.
If the particle radius, , is much smaller than the mean free path of the surrounding gas molecules, , i.e., the Knudsen number , then the photophoretic force is calculated with the free molecular approximation (Hidy & Brock 1967; Mackowski 1989; Beresnev et al. 1993) and is given by
| (3) |
where is the gas pressure, is the thermal conductivity inside the particle, is the particle’s emissivity of thermal radiation and assumed to be unity, is the Stefan-Boltzmann constant, and is the mean thermal velocity of the gas molecules. The asymmetry parameter represents how effectively the incident starlight induces a temperature gradient inside the particle. If the incident light is perfectly absorbed at the particle surface, the asymmetry parameter has the maximum value , and it becomes smaller as the temperature gradient becomes smaller. The gas molecules that hit the particle are assumed to leave the particle with the Maxwell velocity distribution of the local surface temperature of the particle (i.e., the accommodation factor ). In many cases, the denominator of equation (3) is dominated by the first or second terms, i.e., the temperature gradient in the particle is determined by the internal thermal conduction or by the radiative cooling, rather than by the thermal conduction to the gas. In this case, the photophoretic force is approximated by
| (4) |
where we used and , and is the number density of the gas molecules, is the Boltzmann constant, and is the collisional cross section of the gas molecules. In the free molecular regime, the photophoretic force is inversely proportional to the gas mean free path and proportional then to the gas density.
If the particle size, , is much larger than the mean free path of the gas molecules, , i.e., the Knudsen number , then the photophoretic force is calculated with the slip-flow approximation (Mackowski 1989). Mackowski (1989) calculated the photophoretic force assuming that the thermal radiation from the particle surface can be neglected. When the thermal radiation is taken into account, his formula is modified to (see Appendix B for the derivation)
| (5) |
where
| (6) |
and , , and are the coefficients for the jump conditions at the surface and are of order of unity. We adopt the values of , , and (Mackowski 1989). The thermal conductivity of the gas is
| (7) |
where we set the Prandtl number to be . When is approximated by unity, i.e., , , and , the photophoretic force is proportional to the gas mean free path.
To connect the above two regimes, we introduce the following formula
| (8) |
In the limit of , approaches , and in the other limit (), it approaches .
If the particle rotation cannot be neglected, there are two effects we must consider. First, the temperature gradient in the particle becomes smaller as the particle rotates faster. This effectively reduces the asymmetry factor . In the limit of rapid rotation, the asymmetry factor approaches zero. Second, the temperature gradient generally does not coincide with the direction of the light source, i.e., the radial direction. The photophoretic force has a component in the azimuthal direction, and can give or take away angular momentum of the particle, depending on the orientation of the rotation. The particle drifts outward or inward, and the direction of the drift reverses when the orientation of the rotation changes. This is similar to the Yarkovsky effect acting on asteroids (Bottke et al. 2002), although, in the case of photophoresis, the agents of momentum transfer are the gas molecules and not emitted photons. The particle radial drift due to this effect is stochastic, if the variation in the rotational orientation occurs frequently before the particle travels a large distance in the radial direction. Though the study of photophoretic Yarkovsky effect is important, we leave this for future investigations, and in this paper we assume that the photophoretic force is always directed to the radial direction.
For further discussion, it is convenient to normalize the radiative forces given above by the gravitational force
| (9) |
where is the gravitational constant, is the mass of the central star, and is the mass of the particle. We introduce a normalization factor
| (10) |
where
| (11) |
and
| (12) |
In the free molecular regime (),
| (13) |
At large distances from the star, the dust temperature is so low that , and that is independent of the particle radius .
Next we consider the forces acting on the gas. The gravity acting on a unit volume of the gas is
| (14) |
where is the mass density of the gas. The pressure gradient force on a unit volume is
| (15) |
We introduce a normalization factor in a similar way to the dust particle,
| (16) |
2.2. Gas Disk Models and Dust Parameters
For simplicity, we assume that the gas disk has a power-law profile of the temperature, , in the radial direction , and is isothermal in the vertical direction , i.e., it is written as
| (17) |
where the subscript “0” denotes quantities at 1 AU, and the non-dimensional quantity is the radius in AU. The gas density, , is also assumed to have a power-law profile in and be in a hydrostatic equilibrium in , i.e.,
| (18) |
where the disk scale height is . The isothermal sound speed of the disk is , and is written by
| (19) |
where is the Keplerian angular frequency at the disk midplane. The gas surface density is
| (20) |
where . We adopt the following fiducial parameters for the central star and the gas temperature profile: , , , AU, and . The mean mass of the gas molecules is , where is the mass of a hydrogen atom (Nakagawa et al. 1986). The collisional cross section of the gas molecules is (p. 228 in Chapman & Cowling 1970).
We consider disks in which most of small dust grains have been removed and consequently the disks have become optically thin even in the radial direction. The dust opacity in optical wavelength arises mainly from particles smaller than (see Fig. 4 of Miyake & Nakagawa 1993). In order for the disk to be optically thin, the column density of small grains () from the star must be smaller than . Removal of dust grains probably occurs through coagulation of the grains into planetesimals (Weidenschilling & Cuzzi 1993; Tanaka et al. 2005; Dullemond & Dominik 2005; Nomura & Nakagawa 2006). In such disks, the amount of the gas component has likely also reduced. Actually most Vega-type stars do not have detectable gas components (Liseau & Artymowicz 1998; Greaves et al 2000; Coulson et al. 2004; Chen & Kamp 2004), and only a few objects have gas as massive as several tens earth masses. For example, HD 141569A has a gas mass of (Zuckerman et al. 1995; Ardila et al. 2005). Therefore, in model A, we consider a disk in which the amount of the gas inside 100 AU is . (The model disk extends over 100 AU. We specify the disk mass as the mass inside 100 AU.) We take a surface density profile proposed by Hayashi et al. (1985) in which the power-law index is . The gas surface density is . In addition to model A, we also consider a more massive disk to investigate a case in which the disk opacity due to the dust has been significantly reduced before considerable gas dissipation occurs. In model B, the gas amount inside 100 AU is . Further, we assume the density profile is more gradual than model A and . This gentle slope of the density profile assures that the gas density in the innermost part of the disk (say AU) does not become so high that the Rayleigh scattering by molecular hydrogen makes the gas disk itself become optically thick to the starlight (see §4.1 below). The gas surface density in model B is .
For dust particles, we use the following fiducial parameters: The thermal conductivity , the particle bulk density , and the asymmetry factor , the emissivity , and perfect accommodation of gas molecules . The adopted value of the thermal conductivity is typical for porous aggregates (Presley & Christensen 1997). If the dust particles are more compact, the thermal conductivity can be much higher.
2.3. Radial Motion of Dust Particles
Both the radiation pressure and the photophoretic force direct outward. If the sum of these forces is stronger than the gravity of the central star, i.e., , then the particle is not bound to the central star and is ejected from the system. If , the particle is bound to the central star, but it feels a net force weaker than the gravity of the central star, and its orbital motion is slower than Keplerian. Assuming the particle’s orbit is circular and neglecting any contribution of the gas drag force, the azimuthal velocity of the particle is
| (21) |
where is the Keplerian velocity. The azimuthal velocity of the gas is also sub-Keplerian because the pressure gradient force usually directs outward, and is given by
| (22) |
Now we consider the effect of the gas drag force acting on a particle that is bound to the central star (i.e., ). If the particle orbits faster than the surrounding gas (), then the gas drag transfers the angular momentum of the particle to the surrounding gas. Consequently, the particle loses angular momentum and drifts radially to the central star. From equations (21) and (22), it is seen that this inward drift occurs if . On the other hand, if the particle orbits slower than the surrounding gas (, i.e., ), then the particle gets angular momentum from the surrounding gas, and drifts radially away from the central star. When the particle happens to be on the orbit in which its azimuthal velocity equals the gas azimuthal velocity, there is no angular momentum transfer by gas drag, and the particle stays on the equilibrium orbit. More detailed discussions including the derivation of the drift velocity were written in Takeuchi & Artymowicz (2001). From their equation (26) for the drift velocity, neglecting the term of the Poynting-Robertson drag, , gives
| (23) |
where the non-dimensional stopping time is
| (24) |
[the factor difference between eq. (10) of Takeuchi & Artymowicz (2001) and eq. (24) comes from the different definition of , see their eq. (6)]


We can know the direction of the particle’s radial drift by seeing if is larger than or not. Figure 1 shows the ratio against the distance from the central star for model A. If a particle has larger than of the surrounding gas, it drifts away from the star, and vice versa. The ratio of radiation pressure to gravity, , which is inversely proportional to the particle radius , is constant with the distance from the star (see eq. [11]). On the other hand, as long as the gas mean free path is larger than the particle radius (free molecular regime), the photophoretic force is inversely proportional to the Knudsen number (see eq. [4]), and hence decreases with . Thus, at large distances from the central star, the radiation pressure dominates the photophoretic force, i.e., , while at small distances, the photophoretic force dominates and . The transition occurs at 1 AU for particles, 3 AU for particles, and 7 AU for particles. The curves in Figure 1 bend at these distances and the slopes become gentler at larger distances. The slopes of the curves, , are determined only by at large distances, because is constant with , and have the same value for differently sized particles. Inside the transition distances, where the photophoretic force dominates, increases with decreasing the Knudsen number , or decreasing the distance from the central star. This increase in continues until the mean free path of the gas molecules becomes smaller than the particle radius , i.e., until becomes less than unity. At the innermost part of the disk in which (slip-flow regime photophoresis), is proportional to (see eq. [5]) and decreases with decreasing . The transition from the free molecular regime photophoresis to the slip-flow regime photophoresis occurs at the distance where , and at this transition distance, has the maximum value. For particles, has a peak at AU, and for larger particles the peak position shifts outward. It is AU for cm particles.
It is seen from Figure 1 that particles smaller than cm have a region where is greater than . In such a region the particles drift outward. The outward drift of the particles stops at the locations where . At these locations, the particles that drift inward from the outer region also stop. Hence, the particles accumulate at the location where and , leading to the formation of a dust ring as proposed by Krauss & Wurm (2005). Particle accumulation does not occur at the location where but , because the particles drift away from such locations. Note that, at the locations where particles accumulate, the Knudsen number is always larger than unity, and thus the photophoretic force is expressed in its form for the free molecular regime. The location of particle accumulation is at 5 AU for particles, and moves closer to the central star as the particle radius increases. Particles of 10 cm accumulate at AU. If the particles are larger than 10 cm, they always drift toward the central star and cannot accumulate anywhere. In summary, particle accumulation occurs if somewhere in the disk. The accumulation location is specified by the conditions , , and .
For 10 cm and 1 m particles, the curves in Figure 1 again bend at AU. Inside these distances, the radiation pressure becomes stronger than the photophoretic force because the Knudsen number is too low. Thus, keeps constant with in this region, while increases, resulting in a decrease in .
A similar result is obtained for model B (Fig. 1). In this model, particles of all sizes are driven farther outward compared to model A. This is because the gas density is higher in the model B disk, resulting in an increase in . In model B, it is also apparent that 1 cm particles accumulate in a narrow region of AU. This pile-up of particles in a narrow ring has been pointed out by Krauss & Wurm (2005). It is the consequence of being independent of the particle radius at large distances (eq. [13]).
Note that accumulation of outward migrating particles to the ring radius do not increase the optical depth to the star. Formation of the dust ring through clearing the inner dust disk does not suppress further evolution by photophoresis. However, after clearing the inner dust, the optical depth of the ring increases as particles from the outer disk accumulate. When the dust ring becomes optically thick, photophoresis is weakened and then the ring shrinks. In this paper, we consider the stage where the dust ring is optically thin.


3. Particle Accumulation Radius
As discussed in the above section, particles accumulate at the equilibrium locations where and . In Figure 2 and 2 the equilibrium distances for model A and model B, respectively, are plotted as functions of the particle radius. The line labeled “fiducial” represents the equilibrium distances calculated with the parameters written in §2.2. The equilibrium distances for other parameters are also plotted. We vary the value of one parameter with keeping the other parameters being the same as the fiducial model. Higher thermal conductivities and , a lower bulk density , a lower efficiency of photophoresis , and a higher luminosity of the central star are investigated. We also calculate the case in which photophoresis does not work at all ().
3.1. Dust Concentration and Size Segregation
At the accumulation locations, photophoresis is under the free molecular regime (), and as seen from equation (13), converges to a certain value in the limit of small . On the other hand, is inversely proportional to (neglecting the size dependence of ), and thus radiation pressure is more efficient than photophoresis for smaller particles. In the condition that determines the accumulation location, is controlled by radiation pressure for small particles, and by photophoresis for large particles. The particle size where the transition from one behavior to the other occurs depends on the parameters that are relevant for the strength of the photophoretic force, i.e., and . This can be seen in Figure 2 where the curves for different parameters depart from the straight line for at different particle sizes. For the fiducial dust parameters in model A (the solid line in Fig. 2), the accumulation locations of particles larger than are controlled by photophoresis, while those of smaller particles are controlled by radiation pressure.
Particles that are subject to photophoresis have the tendency to accumulate in a narrow ring region, provided that all particles have the same physical properties, i.e., they have the same values of , , and . For example, in the fiducial model (the solid line in Fig. 2), particles of mm accumulate in a region of AU, and cm particles of the higher conductivity accumulate at AU. Hence, a significant influence of photophoresis is to condense the particles of a certain size interval. For small particles, this size interval is limited by the increasing influence of radiation pressure. For large particles, the limit is determined by the increasing importance of thermal emission and conduction to the gas for the thermal relaxation and the approach to . The location of accumulation decreases with increasing thermal conductivity. Thus, particles with different thermal properties can be separated in the disk by this process. While corresponds to very porous dust aggregates, values around are appropriate for compact rocky or glassy grains and for purely metallic particles. As discussed by Wurm & Krauss (2006), compact particles like chondrules or CAIs might have been accumulated in the region of the asteroid belt whereas porous dust aggregates were driven farther outwards by photophoresis in the forming solar system (see Fig. 2 for the disk model as massive as the solar nebula).
In actual disks, the properties of particles are probably not homogeneous, but the dust disks are composed of a wide variety of particles. Even particles of the same size therefore spread over a certain range of distances, and the dust ring formed by photophoresis has some extent in the radial direction. We still expect, however, particle concentration in the disk happens to some degree. Even if the parameter range of the particle properties is as wide as that considered in Figure 2, we clearly see two populations of dust particles. All the particles at distances larger than 10 AU are smaller than 1 mm and do not show any sign of concentration. The dust population inside 10 AU is composed of particles larger than , and is confined in a region between AU. We call this region as an inner disk. These two populations are divided by the condition which of the radiation pressure or the photophoretic force is larger than the other. The population of small particles is subject to radiation pressure, and the other is subject to photophoresis. Hence, the effect of photophoresis is to discriminate large particles from small particles and to confine them to the inner region of the disk.
3.2. Inner Holes
Another significant feature of Figure 2 is that in the region below the dotted line, which represents the area where , there is no equilibrium location where particle accumulation through photophoresis occurs. As discussed in §2.3, particle accumulation by photophoresis always occurs at locations where . If photophoresis does not work (=0), it is seen in Figure 2 that particles can accumulate even in the region where . This feature will be a possible observational evidence for showing that photophoresis actually occurs in gas disks, though it requires observations of the innermost part of the disk ( AU) with a very high spatial resolution. If photophoresis actually works, we would find that an inner hole opens in the dust disk, and that its radius is determined by the condition . If photophoresis does not work, on the other hand, the dust particles would exist even in a region where . An actual dust disk is a mixture of particles of various physical properties. If the dust particles have the range of properties that are considered in Figure 2, the inner radius (that is determined by the particles of or ) is AU. This inner radius may be as small as AU, if there are considerable numbers of particles on that photophoresis works very weakly (i.e., particles of very small , but in that case the inner disk clearing is probably suppressed as shown by the line.)
We stress that the Knudsen number is only a function of the dust particle size and the mean free path of the gas molecules . Thus, the inner radii of dust disks do not directly reflect the dust particles’ physical properties such as the thermal conductivity , the bulk density , and the efficiency of photophoresis . (The particle size at the inner edge does depend on the particle properties.) The fact that the inner radius of the dust disk is determined only by the particle size considerably helps us when we observationally test the idea of inner hole opening by photophoresis. On the other hand, it is of great importance to have an independent measurement of the local gas density to decide whether the condition is fulfilled, which might still be a challenging task for modern observational techniques.
3.3. Massive Disks
Figure 2 shows the equilibrium distances with the same parameter combinations as in Figure 2 but for the disk model B. In model B, where the disk mass (inside 100 AU) is times larger than that of model A, 1 mm to 10 cm particles may extend farther from the central star than in model A due to photophoresis (up to AU). The inner radius of the dust disk locates at AU (for the particles of or ), and is similar to that in model A. This is just because we take such a density distribution for model B that the distances where equals unity for the particle size do not considerably differ from those in model A. This choice of the density distribution in model B comes from the requirement that the gas disk must be optically thin and we take a marginally optically thin disk (see §4.1 below).
3.4. Timescale of Structure Formation

The timescale for the dust particles to migrate to the accumulation locations is , where is the equilibrium distance shown in Figure 2 and is the radial drift velocity. In equation (23), near the equilibrium distance , and thus the drift velocity is estimated as . The migration timescale is then , where the value is calculated at . Figure 3 shows the migration timescales for the fiducial dust parameters of model A and B. For both models, the timescales are shorter than yr, which is the expected age of the transitional disks, except for small particles () in model B. Hence, the disk structure and the inner hole are expected to form quickly when the disks have become transparent to the starlight. (In disks more tenuous than model A, photophoresis effectively works only at the dense innermost part of the disk, and thus the dust accumulation location approaches the star. For example, in a disk times more tenuous than model A, i.e., in a disk of , particle accumulation occurs only inside AU. The migration timescale for cm particles at AU is still less than yr.)
The migration timescale in Figure 3 is much shorter than the orbital decay time due to Pointing-Robertson (PR) drag. For example, 100 particles in model A accumulate at 4 AU in yr. The particles have and the timescale due to PR drag is yr (Burns et al. 1979), and much longer than . Both in model A and B, it is shown that for any particle size. This means that PR drag is much weaker than gas drag and can be neglected.
4. Opacity of the Disk Gas
In the previous sections, we assumed that the disk is optically thin even in the radial direction and dust particles directly receive the light from the central star. This assumption requires that both the dust and gas opacities of the disk must be small enough. We consider a stage in which most of the dust grains are packed together into planetesimals or larger objects and the disk opacity due to the dust has become negligible. Such a situation has probably been realized in some Vega-type stars. The gas disk also must be transparent, though photophoresis requires a sufficient amount of gas. In this subsection, we discuss whether the gas disk that is dense enough for photophoresis to work is transparent to the starlight.
We assume that the gas disk is mostly composed of hydrogen molecules. Thus, Rayleigh scattering by is a possible and probably dominant mechanism of light extinction in the disk. In this subsection, we consider the gas opacity due to Rayleigh scattering by and estimate the maximum gas density at which the gas disk is marginally opaque to the light of the central star. Our estimate gives the lower limit of the gas opacity, because only Rayleigh scattering by is taken into account, and thus the derived maximum gas density should be considered as an upper limit. A transparent gas disk in which photophoresis works must be less dense than our estimate. If other extinction mechanisms work more effectively than the Rayleigh scattering by , this upper limit of the density becomes smaller. In §4.2 below, we briefly discuss other extinction mechanisms.
4.1. Rayleigh Scattering by Hydrogen Molecules
The cross section of Rayleigh scattering by per molecule is
| (25) |
where is the wavelength of the light (Tsuji 1966). In this subsection, we make an order of magnitude argument, and simply estimate the opacity around the central wavelength of the central star’s spectrum, . The stellar light source is assumed to be point sources, which are located slightly above and beneath the origin, , where is the radius of the central star (Hollenbach et al. 1994) and we assume . The optical depth from the star, , to a dust particle on the midplane, , is
| (26) |
where is the number density of the gas molecules (we assume all the gas is composed of for simplicity).

Figure 4 shows the optical depths from the central star as functions of the distance . In both models A and B, the disks are optically thin (except for AU in model A). Note that the disk mass (inside 100 AU) of model B is times larger than that of model A, but the optical depths from the star are not much different. This is because the opacities of the disks are mainly determined by the density at AU and the densities at AU in model A and B do not differ much (Fig. 5). The starlight that illuminates a particle located at a distance AU gets into the disk at a distance AU, because the disk scale height at AU is . Model B has the density profile and most of the gas mass is distributed in the outermost part of the disk, while the density profile of model A is more steep () and the disk mass is more concentrated in the innermost region. Thus, even though the disk mass of model B is times larger than that of model A, the densities at AU in model A and B are similar. For particles located much farther than AU, the optical depth from the central star does not change with the distance .

For particles inside AU, the location where the starlight enters the disk moves toward the central star as the particle position gets closer to the star. In model A, the optical depth is determined by the gas density at where the starlight enters the disk, which rapidly increases with decreasing the distance . Consequently, the optical depth increases with decreasing the particle distance. In model B, the concentration of the gas at the innermost part of the disk is moderate. Thus, the decrease in the path length of the starlight (which is approximately proportional to ) dominates the increase in the gas density at where the starlight enters the disk. The optical depth from the star decreases with decreasing the particle distance in model B.
We estimate the maximum gas density of a disk for it to be optically thin. The optical depth to the star from at the disk midplane is estimated as , where the number density of hydrogen molecules is estimated at , and is the path length of the starlight. The path length is the distance between and the point where the starlight enters the disk. The location of the latter point is approximately calculated as the point where the line connecting and crosses the line connecting and . The condition reduces to the condition for the gas surface density , where is the mass of a hydrogen molecule. The solid line in Figure 5 shows the upper limit of the gas surface density for the optical depth to the star to be less than unity. We see that for AU both the surface densities of model A and B (dashed lines) are less than the critical density for (solid line). For comparison, the surface densities of the disks that have the same amount of mass as model B (inside 100 AU) but have different slopes of the density distribution ( and , dotted lines). It is seen that, if the disk is centrally concentrated, the disk is optically thick at the inner region of the disk.
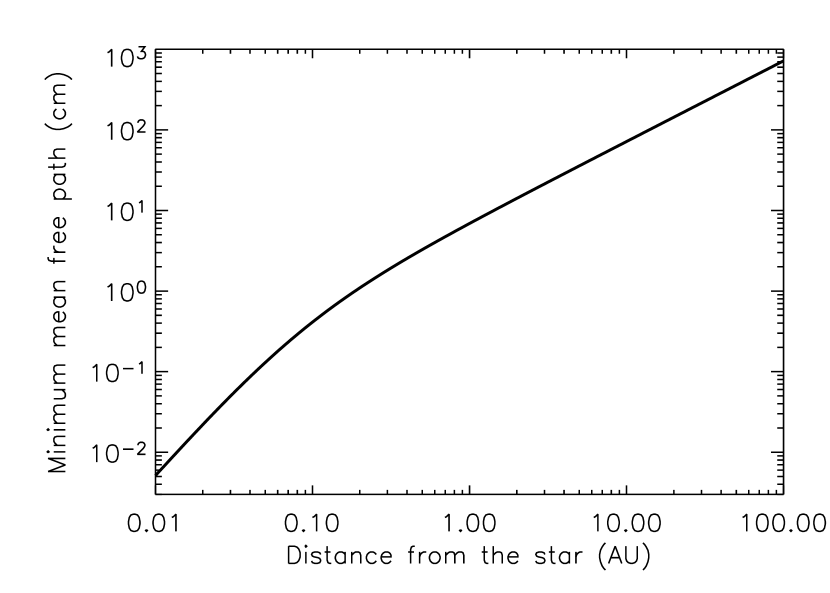
The condition reduces also to the condition for the mean free path of the gas molecules. The mean free path of the gas must be larger than the value shown as the solid line in Figure 6 for the disk to be optically thin. This minimum value is also interpreted as the minimum size of dust particles that compose the inner edge of the dust disk, because the location of the inner edge is determined by the condition . Thus, in order to observationally test whether the inner hole is produced by photophoresis, we have to detect particle accumulation of sizes larger than the value indicated in Figure 6. Suppose that, for example, a dust disk has an inner hole of radius AU. If this inner hole is formed by photophoresis, the gas disk at AU must be optically thin, and from Figure 6, the mean free path at AU must be larger than 1 mm. Because only particles larger than the mean free path can accumulate through photophoresis, the particles at the inner edge must be larger than 1 mm. This minimum particle size becomes larger as the inner radius of the dust disk becomes larger. If the inner radius is 1 AU, the particle size must be larger than 10 cm.
4.2. Other Opacity Sources
1. Bound-free and free-free absorption of negative hydrogen ions — The cross section of bound-free and free-free absorption is proportional to the electron pressure. Thus, this absorption works in environments where the ionization degree is high, and is efficient only at the innermost region of the disk, provided that the disk gas is thermally ionized. In both models A and B, the temperature at AU is K, and the gas pressure is (the molecular hydrogens dominate the gas pressure). The partial pressures of electrons and of hydrogen atoms are and , respectively (Fig. 1 of Tsuji 1966; the solar abundance is assumed). At the optical wavelength , the bound-free absorption dominates the free-free absorption, and the absorption cross section per hydrogen molecule is , where we used the value of Table 2 of Tsuji (1966). Since the cross section of the bound-free absorption sensitively depends on and , we took the highest value around and K in the Tsuji’s Table as a representative value (we take the value for and K). From equation (25), the cross section of Rayleigh scattering for is . The cross section of bound-free and free-free absorption is much smaller than that of Rayleigh scattering even at the innermost part ( AU) of disk model A and B, and thus can be ignored. (Recall that stellar photons penetrate the disk at AU for calculating the optical depth to AU.)
2. Free-free absorption of negative hydrogen molecules — This absorption works only at the innermost part of the disks. Thus, we estimate the cross section at AU of the model disks, which is , where we used equation (8) of Tsuji (1966). This value is much smaller than that of Rayleigh scattering, and free-free absorption of negative hydrogen molecules can be ignored.
3. Collision-induced absorption of hydrogen molecules — This absorption works efficiently if the gas pressure is high. The cross section is expressed as where is the opacity in the unit and is Loschmidt’s number. We consider the innermost part of the disk. The gas number density at AU of model A and B is . At the optical wavelength , the opacity due to and collisions is less than as long as K (Fig. 1 and 2 of Borysow et al. 1997). Thus, is smaller than , and can be ignored in comparison to Rayleigh scattering.
4. Thomson scattering — The cross section of Thomson scattering per hydrogen molecule is . This can be ignored in comparison to Rayleigh scattering, as long as .
5. Molecular absorption bands — At the innermost part of the disk, where the temperature is high enough to vaporize refractory elements from the dust, gas molecules such as TiO and VO contribute to the gas opacity at the optical wavelengths (Tsuji 1971; Alexander & Ferguson 1994; Ferguson et al. 2005). The rotation-vibration lines of such molecules overlap and make a band structure veiling the optical wavelengths. We calculated the gas opacity of model disks A and B due to the molecular absorption bands. In the calculation, we used the code developed by Tsuji (2002) for calculating the opacity of cool stellar atmospheres, and assumed the solar abundance of the gas and dust mixture. At the optical wavelengths (), absorption by VO becomes stronger than Rayleigh scattering of for K, and absorption by TiO becomes stronger for K. Thus, in the disk inside AU of models A and B, where the temperature is higher than 1300 K, the gas opacity is dominated by the molecular absorption bands. Our estimate of the gas opacity in §4.1 is not appropriate for the gas inside AU. For dust particles at AU, the rays from the central star enter the disk at AU, where the gas opacity is dominated by Rayleigh scattering, and contribution of the molecular absorption bands can be neglected. Most of refractory elements may be confined in large bodies such as planetesimals and are removed from the gas phase. In such cases, contribution of the molecular absorption bands is reduced.
5. Discussion and Summary
5.1. Thermal Relaxation and Rotation Times of Dust Particles
As mentioned in §2.1, if particles rotate rapidly, photophoresis does not work. Even if particle rotation is not considerably rapid compared to the thermal relaxation time of the particle, photophoretic Yarkovsky effect may prevent the particle accumulation. Such cases where photophoresis does not work are represented by the model of , where the incident starlight does not cause any temperature gradient in the particles. If photophoresis is suppressed by any reason, particles can reside in the region where (Fig. 2), and such cases can be observationally distinguished from the disks in which photophoresis clears the dust in the innermost region. Hence, whether particles in gas disks rotate rapidly or not can be observationally investigated by checking whether the dust in the region of is cleared or not.
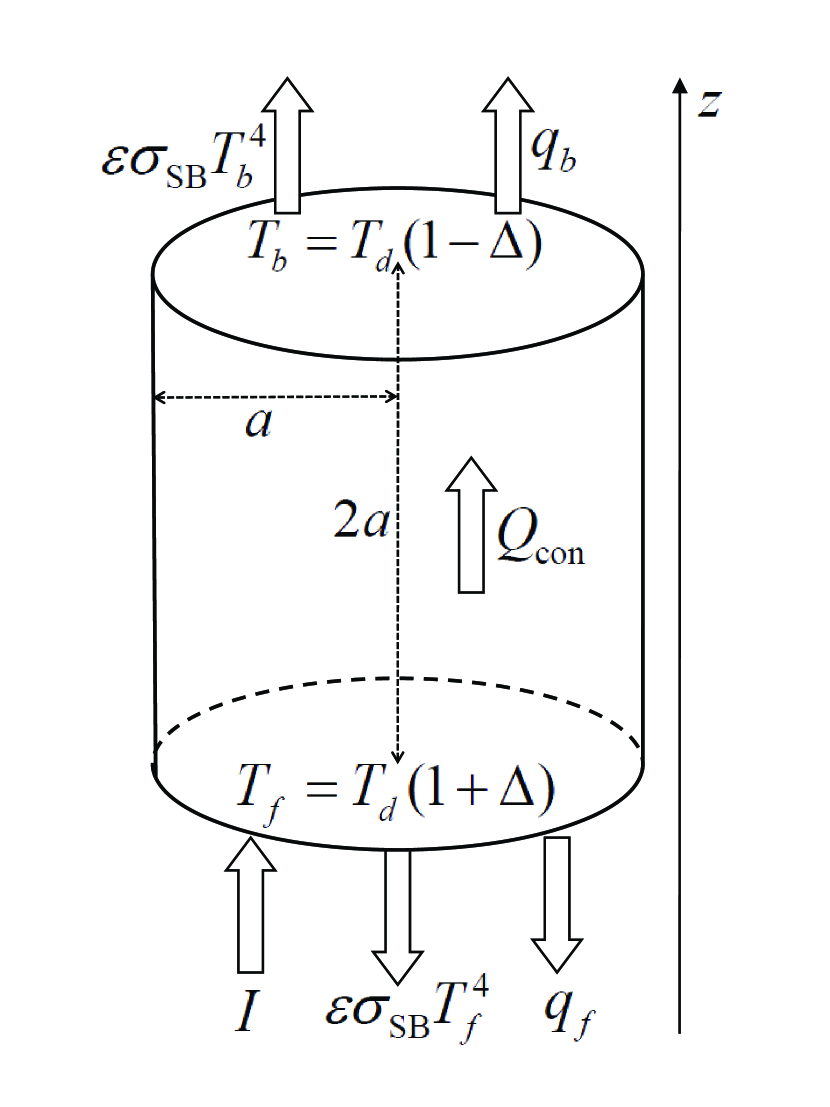
In this subsection, we estimate the thermal relaxation time of a dust particle and then compare it to the rotation period induced by gas turbulence or by photophoresis itself. We use a simple model of a cylindrical dust particle described in Appendix A. Consider a cylindrical dust particle with radius and height (see Figure 9). The stellar radiation flux irradiates the front surface. We suppose that, at the beginning, the temperature inside the particle is homogeneous. This initial (or average) temperature is given by equation (A16), assuming that the incident flux balances with thermal radiation from the front and back surfaces. (Radiation from the side surface is ignored for simplicity.) The temperature of the front surface increases to the equilibrium value in a thermal relaxation time . During , the incident energy at the front surface conducts for a length and forms a skin layer of temperature gradient. During , the temperature at the front surface is approximated as the initial value , and the energy flux inside the skin layer is estimated as . (We set .) When the skin layer depth has grown to and the temperature of the front surface converges to , the energy flux is . Equating the above two expressions for , the thickness of the temperature gradient layer is
| (27) |
where . Note that the maximum value of is . The thermal relaxation time is
| (28) |
where is the specific heat capacity of the particle.

Figure 7 shows the thermal relaxation time for cm particles in the disk of model A. We set the particle bulk density , the specific heat capacity , and the thermal conductivity . The temperature difference is calculated by equation (A17). At small distances from the star, radiative cooling dominates in determining in equation (A17), and . Thus, is independent of the particle size , and is proportional to . In our model , and thus . At large distances, on the other hand, internal thermal conduction determines . In this case, the skin depth is . Hence, is proportional to and independent of .
If the rotation period of the particle is smaller than , photophoresis is considerably suppressed. Particle rotation can be excited by several mechanisms such as Brownian motion, gas turbulent motion, collisions with other dust particles, and the photophoretic force itself can induce rotation if it has a offset from the mass center. Detailed calculation of the rotation period for each mechanism is beyond the scope of this paper. Here, we make a rough estimate of the rotation speed induced by turbulence and by the photophoretic force.
Suppose that the gas disk has isotropic turbulence with the Kolmogorov energy spectrum. We assume that the largest eddies have size and velocity , where is the “-viscosity” parameter (Cuzzi et al. 2001). The energy of turbulent motion cascades down to smaller eddies, and finally dissipates by the molecular viscosity. From dimensional analysis, the energy dissipation rate per unit mass is . The eddy turnover time is faster for smaller eddies and that for the smallest eddies is
| (29) |
where is the molecular viscosity (Weidenschilling 1984). The smallest eddies can induce a particle rotation period as short as , if the particle is well coupled to the turbulent motion of the smallest eddies. However, if the particle does not strongly couple to the gas, the rotation period is longer than . In Figure 7, the turnover time, , of the smallest eddies is plotted by the dashed line for . The particle rotation period induced by gas turbulence is expected to be larger than the dashed line, and therefore is much longer than the thermal relaxation time.


We next consider rotation induced by the torque exerted by photophoresis. Consider again a cylindrical dust particle and suppose that the photophoretic force is exerted on a point at a distance from the cylinder axis. The torque is . The value of is unknown, and we treat as a free parameter. The principal moment of inertia of the cylinder (for the axis perpendicular to the cylinder axis) is . The time needed for a initially stationary particle to rotate 180 degree is
| (30) |
In Figure 8, the rotation time is plotted for assumed off-centers and . If the photophoretic force has a large off-center (), the rotation time can be shorter than the thermal relaxation time at AU for particles and at AU for 1 cm particles. In such regions, photophoresis is probably significantly suppressed. In order for photophoresis to work effectively in the whole disk, the off-center of the photophoretic force has to be as small as .
5.2. Characteristic Structure Due to Photophoresis
The dust disk structure that photophoresis makes has three zones: the outer disk, the inner disk, and the inner hole. The outer disk is composed of small ( mm or ) particles, and their dynamics is controlled mainly by radiation pressure. The inner disk is composed of large ( or ) particles accumulating there due to photophoresis. The boundary between the outer and inner regions is at AU, depending on the gas density profile. The inner hole opens inside AU, where the Knudsen number is smaller than unity for particles that photophoresis effectively works on ( cm).
The structure formed by photophoresis should be compared to the structure of gas-free disks. Modeling of gas-free dust disks also shows zonal structure that consists of the outer extended disk, the inner disk, and the inner hole (Thébault & Augereau 2005; Wyatt 2006; Strubbe & Chiang 2006; Krivov et al. 2006). In their models, a planetesimal belt is assumed and dust particles are continuously produced by planetesimal collisions. The inner disk is composed of large particles whose orbits are hardly affected by radiation pressure and are nearly circular. Thus, the location and width of the inner disk are basically similar to those of the planetesimal belt. Outside the planetesimal belt, the outer disk extends and it is composed of small particles whose -value is large. Their orbits are strongly influenced by radiation pressure and are excited to highly eccentric orbits. In the model of Thébault & Augereau (2005), the particles of the outer disk have , which is relatively larger than of our models. In our models, particles’ of the outer disk can be as small as . Therefore, infrared to millimeter radio observations of outer disks and determination of the particle size will provide key information for determining which model is plausible.
Our models of photophoresis also predict that an inner hole opens in the dust disk, but the gas still fills the hole. This is a significant feature, but it is difficult to test this with the present observational techniques. We have to observe the gas, but the amount of the gas of optically thin disks is probably quite small, and most of Vega-type stars do not have gas in an amount exceeding the current detection limit. Further, the radius of the inner hole is of the order of AU, and the temperature there is close to the sublimation temperature of the dust. (The temperature exceeds 1500 K inside AU of our model disks.) Therefore, we need a careful observation that can distinguish between the inner holes made by photophoresis and by dust sublimation.
5.3. Summary
Dust accumulation by photophoresis is studied. We use formulae of the photophoretic force that are applicable for the free molecular regime and for the slip-flow regime. The main results are as follows.
1. Particle accumulation occurs at a point where the outward acceleration on the gas by the pressure gradient equals to the outward acceleration on the particle by radiation pressure and photophoresis.
2. Photophoresis makes an inner disk composed of relatively large particles ( cm). The inner disk extends between AU and AU, surrounded by the outer disk composed of small particles ( mm).
3. An inner hole opens inside AU. The inner hole radius is determined by the condition for the maximum size particles that photophoresis effectively works on ( cm).
Photophoresis works effectively only when the disk is optically thin. Most of small () dust grains must be removed from the disk such that their column density to the star becomes smaller than . For example, at 1 AU, the dust density must be smaller than , i.e., times smaller than the value of the minimum mass solar nebula model (Hayashi et al. 1985). The gas disk also must be optically thin. Figure 5 shows that the gas surface density must be smaller than . At AU, where the typical ray from the star enters the disk (for the dust particles at AU), this value is times smaller than the value of the minimum mass solar nebula model (Hayashi et al. 1985). Even in such a tenuous gas disk, the photophoretic force is strong enough to change the dust disk structure inside a few AU, as shown by model A (Figure 2). If the gas density is more tenuous than model A, the region where photophoresis has a substantial effect shrinks toward the central star. In a gas disk with times smaller gas density than model A, photophoresis on millimeter sized particles works effectively only inside 1 AU, and in a disk with times smaller gas density, the effective region shrinks to AU.
Appendix A A Simple Estimate of the Photophoretic Force
In this Appendix, we estimate the magnitude of the photophoretic force using a simple calculation.
We consider a cylindrical dust particle with radius and height (see Figure 9). The particle is surrounded by the gas of temperature . In general, differs from the average temperature of the particle . In deriving the photophoretic force below, we assume , and consider cases later. The incident radiation flux, , is parallel to the cylinder axis (-axis) and irradiates the front surface. The temperature at the front surface increases to and it radiates energy flux , where is the emissivity. Some of the incident energy is conducted to the gas with a rate per unit area, and the residual energy flows to the back surface with a rate per unit area. For simplicity, we ignore the energy transfer through the side surface. The temperature of the back surface is . The back surface radiates energy flux , and conducts heat to the gas with a rate . In an equilibrium state, the temperature inside the particle varies linearly along the cylinder axis, and thus its values at the front and back surfaces are written as
| (A1) | |||||
| (A2) |
respectively. The energy balance reads
| (A3) |
We calculate each term of equation (A3). First we consider free molecular photophoresis (). The radiative fluxes from the front and back surfaces are, assuming ,
| (A4) | |||||
| (A5) |
respectively. The thermal conduction to the gas at the front surface is divided as
| (A6) |
where is the energy loss from the particle that is taken by the gas molecules ejected from the front surface, and is the energy gain that is given by the adsorbed molecules. In the free molecular approximation (), the velocity distribution of the adsorbed molecules is written as , where is the accommodation coefficient, is the Maxwellian velocity distribution of the temperature and number density ,
| (A7) |
and is the mass of a molecule. We define to have non-zero values even for particles going away from the surface (). The energy gain is
| (A8) |
where is the velocity component normal to the front surface, is the gas pressure, and is the mean thermal speed of gas molecules. The molecules ejected from the front surface are assumed to have a Maxwellian velocity distribution, , of the temperature . The energy loss is
| (A9) |
where and the “density” of ejected molecules (for ) is
| (A10) |
From mass conservation between the adsorbed and ejected molecules (),
| (A11) |
Then, we obtain
| (A12) |
If the gas temperature and the average dust temperature are same (), the thermal conduction to the gas is
| (A13) |
Similarly, the thermal conduction to the gas from the back surface is
| (A14) |
The thermal conduction inside the particle is
| (A15) |
Collecting all the above expressions of the terms in equation (A3), the particle temperature is solved as
| (A16) |
and
| (A17) |
The force exerted on the front surface by the ejected molecules is
| (A18) |
and on the back surface,
| (A19) |
Assuming and , the photophoretic force is
| (A20) |
which can be compared to equation (3) for the spherical particle case.
We consider how the photophoretic force changes from equation (A20) when the dust temperature differs from the gas temperature . For simplicity, we consider the cases where the thermal conduction to the gas can be neglected. With in equation (A3), the photophoretic force becomes
| (A21) |
which differs from the case by a factor . We consider further the cases where the temperature variation inside the dust particle is large (). Such a situation arises if , . In this case, and =0, and thus the photophoretic force is . The photophoretic force calculated by equation (A21), which assumes , reduces to , when the term is neglected. Thus, in the extreme case where , equation (A21) underestimates the photophoretic force by a factor .
In the slip-flow regime (), thermal conduction to the gas is estimated as , where is the thermal conductivity of the gas. The temperature difference is
| (A22) |
Because of the temperature variation along the dust surface, a slip flow of the gas arises. The velocity of the thermal slip is
| (A23) |
where is the thermal slip coefficient (Lifshitz & Pitaevskii 1981). The particle, which moves in the gas with a velocity , experiences Stokes gas drag,
| (A24) |
where is the molecular viscosity. ( if the particle is spherical.) In the equilibrium state, the photophoretic force balances with the Stokes drag force, and is estimated as
| (A25) |
which can be compared to equation (5). In the above derivation, we neglect the temperature jump at the surface and the velocity slip due to imperfect sticking of the gas to the surface ().
Appendix B Slip-Flow Regime Photophoresis
In this Appendix, we derive the expression for the photophoretic force in the slip-flow regime, equation (5), taking into account the radiative cooling of the particle. We follow the derivation described in Mackowski (1989). (The assumption is as follows. The mean temperatures of the gas and the dust, and , are the same. The temperature variation from the mean value is small. The Reynolds number is much less than unity and thus gas drag obeys the Stokes law. The gas temperature is determined only by the heat conduction from the dust and inside the gas.) Here, we do not rewrite Mackowski’s derivation again, but we describe what is modified when radiative cooling is taken into account. In this Appendix, the numbering of equations with “M” means that they refer to equations of Mackowski (1989). For the meaning of the symbols see Mackowski (1989). However, for some variables, we have used different symbols in the main text, and we keep the same notation in the Appendix. When we use a different symbol from Mackowski (1989), the corresponding symbol in Mackowski (1989) is given in brackets.
The basic equations (M11)-(M14) and the boundary conditions (M15)-(M20) are not changed except that equation (M16) is modified as
| (B1) |
where is the temperature inside the dust particle, is the gas temperature, and ) is the thermal conductivity of the dust. Then, equation (M22) becomes
| (B2) |
where is the mean temperature of the dust, is the coefficient of the jump condition, and we correct the typo in the sign of the original equation. Equation (M28) is not modified when it is expressed using as
| (B3) |
where is the molecular viscosity, and and are the coefficients of the jump conditions. Finally equation (M29) becomes
| (B4) |
where is the incident flux of the starlight. Substitution of the expression for and taking the absolute value give equation (5).
References
- (1) Alexander, R. D., Clarke, C. J., & Pringle, J. E. 2006, MNRAS, 369, 216
- (2) Alexander, R. D., Clarke, C. J., & Pringle, J. E. 2006, MNRAS, 369, 229
- Alexander & Ferguson (1994) Alexander, D. R., & Ferguson, J. W. 1994, ApJ, 437, 879
- Ardila et al. (2005) Ardila, D. R., et al. 2005, ApJ, 627, 986
- (5) Augereau, J. C., Lagrange, A. M., Mouillet, D., & Ménard, P. A. 1999a, A&A, 350, L51
- Beresnev et al. (1993) Beresnev, S., Chernyak, V., & Fomyagin, G. 1993, Phys. Fluids A, 5, 2043
- Borysow et al. (1997) Borysow, A., Jorgensen, U. G., & Zheng, C. 1997, A&A, 324, 185
- Bottke et al. (2002) Bottke, W. F., Jr., Vokrouhlický, D., Rubincam, D. P., & Broz, M., in Asteroids III, ed. W. F. Bottke Jr., A. Cellino, P. Paolicchi, & R. P. Binzel, (Tucson: University of Arizona Press), 395
- Brownlee et al. (2006) Brownlee, D., et al. 2006, Science, 314, 1711
- Burns, Lamy & Soter (1979) Burns, J. A., Lamy, P. L. & Soter, S. 1979, Icarus, 40, 1
- Chapman & Cowling (1970) Chapman, S., & Cowling T. G. 1970, The Mathematical Theory of Non-Uniform Gases (Cambridge: Cambridge University Press)
- Chen & Kamp (2004) Chen, C. H., & Kamp, I. 2004, ApJ, 602, 985
- Clampin et al. (2003) Clampin, M., et al. 2003, AJ, 126, 385
- Clarke et al. (2001) Clarke, C. J., Gendrin, A., & Sotomayor, M. 2001, MNRAS, 328,485
- Coulson et al. (2004) Coulson, I. M., Dent, W. R. F., & Greaves, J. S. 2004, MNRAS, 348, L39
- Cuzzi et al. (2001) Cuzzi, J. N., Hogan, R. C., Paque, J. M., & Dobrovolskis, A. R. 2001, ApJ, 546, 496
- Dent et al. (2005) Dent, W. R. F., Greaves, J. S., & Coulson, I. M. 2005, MNRAS, 359, 663
- Dullemond & Dominik (2005) Dullemond, C. P., & Dominik, C. 2005, A&A, 434, 971
- Ferguson et al. (2005) Ferguson, J. W., Alexander, D. R., Allard, F., Barman, T., Bodnarik, J. G., Hauschildt, P. H., Heffner-Wong, A., & Tamanai, A. 2005, ApJ, 623, 585
- Fisher et al. (2000) Fisher, R. S., Telesco, C. M., Piña, R. K., Knacke, R. F., & Wyatt, M. C. 2000, ApJ, 532, L141
- Goto et al. (2006) Goto, M., Usuda, T., Dullemond, C. P., Henning, Th., Linz, H., Stecklum, B., & Suto, H. 2006, ApJ, 652, 758
- Greaves (2004) Greaves, J. S. 2004, MNRAS, 351, L99
- Greaves et al. (2000) Greaves, J. S., Mannings, V., & Holland, W. S. 2000, Icarus, 143, 155
- Hartmann et al. (1998) Hartmann, L., Calvet, N., Gullbring, E., & D’Alessio, P. 1998, ApJ, 495, 385
- Hayashi, Nakazawa, & Nakagawa (1985) Hayashi, C., Nakazawa, K., & Nakagawa, Y. 1985, in Protostars and Planets II, ed. D. C. Black & M. S. Matthews (Tucson:Univ. of Arizona Press), 1100
- Hidy & Brock (1967) Hidy, G. M., & Brock, J. R. 1967, J. Geophys. Res., 72, 455
- Hollenbach et al. (1994) Hollenbach, D., Johnstone, D., Lizano, S., & Shu, F. H. 1994, ApJ, 428, 654
- Krauss & Wurm (2005) Krauss, O., & Wurm, G. 2005, ApJ, 630, 1088
- Krauss et al. (2007) Krauss, O., Wurm, G., Mousis, O., Petit, J. -M., Horner, J., & Alibert, Y. 2007, A&A, 462, 977
- Krivov et al. (2006) Krivov, A. V., Löhne, T., & Sremcevic, M. 2006, A&A, 455, 509
- Lifshitz & Pitaevskii (1981) Lifshitz, E. M., & Pitaevskii, L. P. 1981, Physical Kinetics (Oxford: Butterworth-Heinemann)
- Liseau & Artymowicz (1998) Liseau, R., & Artymowicz, P. 1998, A&A, 334, 935
- Mackowski (1989) Mackowski, D. W. 1989, Int. J. Heat Mass Transfer, 32, 843
- Marsh et al. (2002) Marsh, K. A., Silverstone, M. D., Becklin, E. E., Koerner, D. W., Werner, M. W., Weinberger, A. J., & Ressler, M. E. 2002, ApJ, 573, 425
- Miyake & Nakagawa (1993) Miyake, K., & Nakagawa, Y. 1993, Icarus, 106, 20
- Mouillet et al. (2001) Mouillet, D., Lagrange, A. M., Augereau, J. C., & Menard, F. 2001, A&A, 372, L61
- Mousis et al. (2007) Mousis, O., Petit, J.-M., Wurm, G., Krauss, O., Alibert, Y., & Horner, J. 2007, A&A, 466, L9
- (38) Nakagawa, Y., Sekiya, M., & Hayashi, C. 1986, Icarus, 67, 375
- Nomura & Nakagawa (2006) Nomura, H., & Nakagawa, Y. 2006, ApJ, 640, 1099
- Petit et al. (2006) Petit, J.-M., Mousis, O., Alibert, Y., & Horner, J. 2006, Lunar Planet. Sci., 37, 1558
- Presley & Christensen (1997) Presley, M. A., & Christensen, P. R. 1997, J. Geophys. Res. E, 102, 6535
- Strubbe & Chiang (2006) Strubbe, L. E., & Chiang, E. I. 2006, ApJ, 648, 652
- Takeuchi & Artymowicz (2001) Takeuchi, T., & Artymowicz, P. 2001, ApJ, 557, 990
- Takeuchi et al. (2005) Takeuchi, T., Clarke, C. J., & Lin, D. N. C. 2005, ApJ, 627, 286
- Tanaka et al. (2005) Tanaka, H., Himeno, Y., & Ida, S. 2005, ApJ, 625, 414
- Thébault & Augereau (2005) Thébault, P., & Augereau, J.-C. 2005, A&A, 437, 141
- Tsuji (1966) Tsuji, T. 1966, PASJ, 18, 127
- Tsuji (1971) Tsuji, T. 1971, PASJ, 23, 553
- Tsuji (2002) Tsuji, T. 2002, ApJ, 575, 264
- (50) Weidenschilling, S. J. 1984, Icarus, 60, 553
- Weidenschilling & Cuzzi (1993) Weidenschilling, S. J., & Cuzzi, J. N. 1993, in Protostars and Planets III, ed. E. H. Levy & J. I. Lunine (Tucson:Univ. of Arizona Press), 1031
- Weinberger et al. (1999) Weinberger, A. J., Becklin, E. E., Schneider, G., Smith, B. A., Lowrance, P. J., Silverstone, M. D., Zuckerman, B., & Terrile, R. J. 1999, ApJ, 525, L53
- Weinberger et al. (2000) Weinberger, A. J., Rich, R. M., Becklin, E. E., Zuckerman, B., & Matthews, K. 2000, ApJ, 544, 937
- Wurm & Krauss (2006) Wurm, G., & Krauss, O. 2006, Icarus, 180, 487
- Wyatt (2006) Wyatt, M. C. 2006, ApJ, 639, 1153
- Zuckerman et al. (1995) Zuckerman, B., Forveille, T., & Kastner, J. H. 1995, Nature, 373, 494