Carrier-envelope phase measurement from half-cycle high harmonics
Pengfei Lan, Peixiang Lu†, Fang Li, Yuhua Li, Zhenyu Yang
Wuhan National Laboratory for Optoelectronics, Huazhong University of Science and Technology, Wuhan 430074, P. R. China
lupeixiang@mail.hust.edu.cn
Abstract
We present a method to distinguish the high harmonics generated in individual half-cycle of the driving laser pulse by mixing a weak ultraviolet pulse, enabling one to observe the cutoff of each half-cycle harmonic. We show that the detail information of the driving laser pulse, including the laser intensity, pulse duration and carrier-envelope phase, can be in situ retrieved from the harmonic spectrogram. In addition, our results show that this method also distinguishes the half-cycle high harmonics for a pulse longer than 10 fs, suggesting a potential to extend the CEP measurement to the multi-cycle regime.
OCIS codes: (190.4160) Multiharmonic generation; (020.4180) Multiphoton processes; (120.5050) Phase measurement; (320.7100) Ultrafast measurements.
References and links
- [1] T. Brabec and F. Krausz, “Intense few-cycle laser fields: Frontiers of nonlinear optics,” Rev. Mod. Phys. 72, 545 (2000).
- [2] A. Baltuska, Th. Udem, M. Uiberacker, M. Hentschel, E. Goulielmakis, Ch. Gohle, R. Holzwarth, V. S. Yakovlev, A. Scrinzi, T. W. Hansch, F. Krausz, “Attosecond control of electronic processes by intense light fields,” Nature (London) 421, 611 (2003).
- [3] D. B. Milošević, G. G. Paulus, W. Becker, “High-order above-threshold ionization with few-cycle pulse: a meter of the absolute phase,” Opt. Express 11, 1418 (2003).
- [4] G. G. Paulus, F. Lindner, H.Walther, A. Baltuska, E. Goulielmakis, M. Lezius, and F. Krausz, “Measurement of the Phase of Few-Cycle Laser Pulses,” Phys. Rev. Lett. 91, 253004 (2003).
- [5] A. D. Bandrauk, S. Chelkowski, N. H. Shon, “Measuring the electric field of few-cycle laser pulses by attosecond cross correlation,” Phys. Rev. Lett. 89, 283903 (2002).
- [6] A. Apolonski, P. Dombi, G. G. Paulus, M. Kakehata, R. Holzwarth, Th. Udem, Ch. Lemell, K. Torizuka, J. Burgdörfer, T. W. Hänsch, F. Krausz, “Observation of Light-Phase-Sensitive Photoemission from a Metal,” Phys. Rev. Lett. 92, 073902 (2004).
- [7] C. Lemell, X. M. Tong, F. Krausz, J. Burgdorfer, “Electron emission from metal surfaces by ultrashort pulses: Determination of the carrier-envelope phase,” Phys. Rev. Lett. 90, 076403 (2003).
- [8] C. A. Haworth, L. E. Chipperfield, J. S. Robinson, P. L. Kninght, J. P. Marangos, J. W. G. Tisch, “Half-cycle cutoffs in harmonic spectra and robust carrier-envelope phase retrieval,” Nature Phys. 3, 52 (2007).
- [9] M. Kress, T. Löffler, M. D. Thomson, R. Dörner, H. Gimpel, K. Zrost, T. Ergler, R. Moshammer, U. Morgner, J. Ullrich, H. G. Roskos, “Determination of the carrier-envelope phase of few-cycle laser pulses with terahertz-emission spectroscopy,” Nature Phys. 2, 327 (2006).
- [10] S. T. Cundiff, “Better by half,” Nature Phys. 3, 16 (2007).
- [11] P. B. Corkum, “Plasma perspective on stong-field multphoton ionization,” Phys. Rev. Lett. 71, 1994 (1993).
- [12] K. Ishikawa, “Photonemission and ionization of He+ under simultaneous irradiation of fundamental laser and high-order harmonic pulses,” Phys. Rev. Lett. 91, 043002 (2003).
- [13] K. J. Schafer, M. B. Gaarde, A. Heinrich, J. Biegert, U. Keller, “Strong field quantum path control using attosecond pulse trains,” Phys. Rev. Lett. 92, 023003 (2004).
- [14] P. Lan, P. Lu, W. Cao, X. Wang, “Efficient generation of an isolated single-cycle attosecond pulse,” Phys. Rev. A 76, 043808 (2007).
- [15] M. Feit, J. A. Fleck, Jr., and A. Steiger, “Solution of the Schrödinger equation by a spectral method,” J. Comp. Phys. 47, 412 (1982).
Nowadays, rapid advances in laser technology have made it possible to shape and control intense laser pulses consisting only of a few optical cycles (typically, 5 fs for the Ti:sapphira laser), opening up new frontiers for ultrafast physics [1]. To fully characterize such few-cycle pulses, the relative phase of the carrier wave with respect to the pulse envelope, i.e., the carrier-envelope phase (CEP) is required besides the pulse intensity, envelope and wavelength. In the few-cycle regime, the temporal evolution of the electric field depends sensitively on the CEP. Consequently, many strong-field interactions which are relevant to the electric field of the pulse rather than the intensity profile, become sensitive on the CEP [2, 3]. Then the phase-stabilized few-cycle laser pulses provide us a precise tool to coherent control the electronic processes [2], and the ability to measure and stabilize the CEP therefore becomes a crucial point for all applications.
Many methods have been proposed for CEP measurement based on the photonionization [3, 4, 5, 6, 7], ultraviolet (uv) and terahertz emission [8, 9]. It was shown that the few-cycle laser pulse leads to a strong left-right asymmetry of photoelectrons [3], which has been observed and utilized as a meter of the CEP [4]. The photonelectron emission from metal surfaces also shows a phase-sensitive property [6], suggesting a potential to measure the CEP [7]. But for photonelectron signals, thousands of consecutive pulses measurement is usually required to achieve the required degree of accuracy. In recent work, Haworth et al. proposed a method of spatio-filtering, which separated the high harmonic generation (HHG) in each half-cycle of the laser pulse in the spatio domain and the CEP was retrieved form the harmonic spectrogram. Moreover, the high harmonic signal is easily detect and single short measurement becomes possible. In addition, the spatio-filtering indicates a potential to CEP measurement for a multi-cycle pulse (10 fs), i.e., better by half [10].
In this work, we propose an alternative method to separate the half-cycle harmonic (HCH) in the time domain, from which we retrieve the information of driving laser pulse, including the laser intensity, pulse duration and CEP. Our method is based on the HHG in a two-color field, which is illustrated in Fig. 1(a). The red line shows the 5-fs laser field . As the three-step model [11], the electron is first set free via photonionization at the laser peak and then is accelerated in the following half-cycle of the laser field, accumulating a kinetic energy of with a maximum of about , where , are the ionization and recombination times, is the ponderomotive energy and is the laser amplitude. Finally, the electron recombines with the parent ion near the zero transition of the laser field by releasing its energy to high harmonics with the cutoff energy of , where is the atomic ionization energy. Such a process occurs periodically in each half-cycle of the driving field as shown by the dotted line in Fig. 1(a). However, how to observe the HCH still is a challenge in experiments.
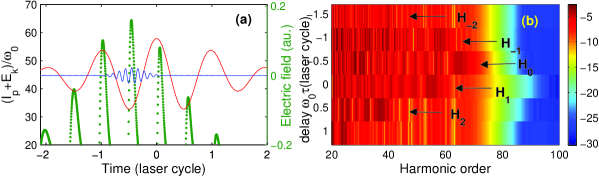
As shown in Fig. 1(a), ionization is the starter of HHG and each HCH corresponds to a specific ionization time near the laser peak. Therefore, we mix a uv pulse to the laser pulse (see the blue line). Due to the high photon energy and ultrashort duration, the uv pulse significantly enhances the photonionization [12] and also confines the ionization time in an interval of several hundred attoseconds [13, 14], which has been demonstrated to control and enhance the HHG. Here, we focus on how to distinguish the individual HCH and to extract the driving pulse information from the harmonic spectrogram. In the two-color field as shown in Fig. 1(a), the uv pulse firstly launches a free electron, initialing the HHG. The electron is then accelerated in the following half-cycle of the driving laser field, and finally recombines with the parent ion by releasing high harmonics. Since the ionization is enhanced and confined in a short interval by the uv pulse, high harmonics generated in a half-cycle can be selected. Scanning the uv pulse, each HCH will be separated in the time domain, which also inherits the information of the driving field. From the harmonic spectrogram, the laser intensity, pulse duration and CEP are therefore can be in situ retrieved during HHG.
For simulation, we solve the time-dependent Schödinger equation (TDSE) with the split-operator method [14, 15]. We choose a Ti:sapphire 5-fs laser pulse with a wavelength of 800 nm and an intensity of , the electric field reads where is the laser amplitude, and are the laser frequency and CEP, respectively, is the pulse envelope and the pulse duration is full width at half maximum (FWHM). For the uv pulse, where is the delay between the laser and uv pulses. The intensity of the uv pulse is , wavelength is 100 nm. We intend to select the HCH, and hence set the uv pulse duration as 1 fs where is the optical cycle of the driving field. The harmonic spectrogram is shown in Fig. 1(b).
One can see that the high harmonics produced in each half-cycle are clearly separated at different ionization times and the half-cycle cutoffs (HCOs) are also distinguished. For instance, at , the harmonic spectrum (marked by ) clearly shows a cutoff at , corresponding to the HCH with the ionization time of shown in Fig. 1(a). Scanning the uv pulse, we observe the other HCHs, see harmonics for the HCH with the ionization time of and 0, respectively. In contrast to the spatio-filtering, our method separates each HCH in the time domain, which is therefore named as temporal-filtering. Moreover, our method also
clearly separates the HCHs with close cutoffs, e.g., and , improving the resolution.
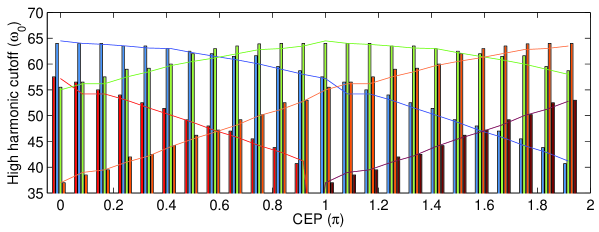
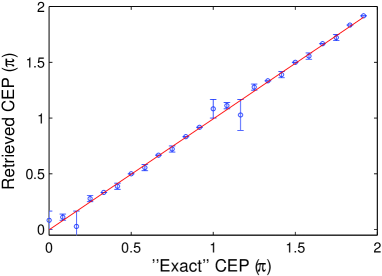
For the few-cycle pulse, the laser envelope and hence the amplitude vary significantly in a half-cycle of the laser pulse, leading to a different electron energy accumulated in each half-cycle, which is inherited by the HCH. Conversely, we can retrieve the detail information of the laser pulse from the spectrogram. In Fig. 2, we show the half-cycle cutoff (HCO) as a function of CEPs. For comparison, we also calculated the HCOs with the classical three-step model [11], modified by taking account the initial energy when the electron is released. It can be estimated as , where is the height of the combined Coulomb and driving laser field barrier at the ionization time [13]. Note that the initial energy is not significant for our parameters and is negligible if the uv photon energy is less than 8 eV (the central wavelength is about 135 nm). The results are shown by the solid lines in Fig. 2, which agree quite well with the HCOs from TDSE. In addition, one can see that the HCO depends sensitively on the CEP of the driving field, enabling one to retrieve the CEP from the harmonic spectrogram. For illustration, we refer the harmonic spectrogram obtained from TDSE to the “experimental” results without knowing the CEP, and then present an algorithm to retrieve the driving field information from the “experimental” spectrograms. Firstly, we calculate the HCOs by the classical model for a 5-fs pulse with a range of intensities ( ) and CEPs (), establishing a database of the “theoretical” HCOs. Afterward, we extract the HCOs from the “experimental” spectrograms and then compare it with the “theoretical” HCOs. Each comparison returns a value proportional to how well the two agree, which is defined as the square of the offset between the “experimental” and “theoretical” HCOs. Finally, the driving laser intensity and CEP can be taken from the best match and the error from the standard deviation of the degree of agreement from this value. The intensity returned by the algorithm is , which agrees quite well with the “exact” value. Figure 3 presents the retrieved CEPs, which also agree well with the “exact” ones. The largest deviation is and the average deviation is only .
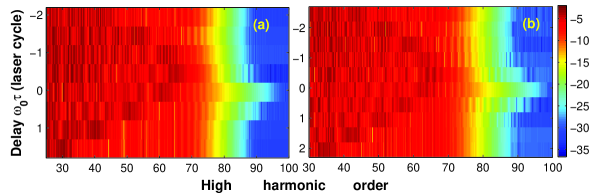
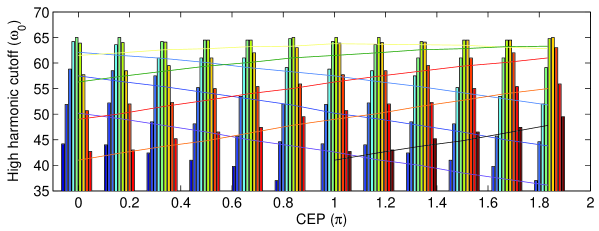
Figure 4 shows the harmonic spectrograms as a function of delay for a (a) 8- and (b) 11.5-fs laser pulses. One can clearly distinguish each HCH and HCO from these spectrograms. In Fig. 5, we show the HCOs for a range of CPEs obtained from TDSE and classical model. Similarly, the detail information of the driving field can be retrieved from the harmonic spectrogram as the above discussions. Hence, our method also indicates a potential to extend the CEP measurement to the multi-cycle regime.
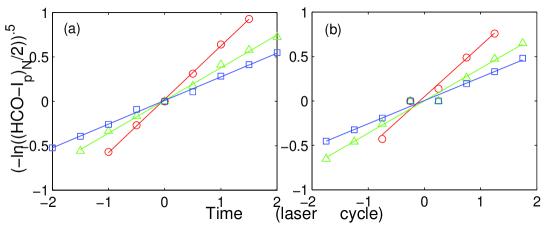
Pulse duration is another important parameter for the ultrashort pulse, which is usually measured by frequency-resolved optical gating. In principle, the pulse duration can be retrieved from the comparison algorithm mentioned above, which however enlarges the calculation. Here we present an alternative method for in situ pulse duration measurement during HHG. As the three-step model, the half-cycle harmonic cutoff , where is the laser amplitude of the individual half cycle, i.e., a series of values on the Gaussian envelope. In other words, , suggesting that the pulse duration can be extracted by fitting the HCOs with a Gauss squared function. We devise a simple algorithm to deal with it. Firstly, normalize by its maximum, consequently obeys the Gauss-squared function , which is then transformed as . The parameter T can be retrieved with the least squares fitting method. In Fig. 6(a), we shows the for a 5- (circles), 8- (triangles) and 11.5-fs (squares) pulses, which are fitted by the red, green and blue lines, respectively. The slopes are 0.6016, 0.3688, 0.2666, and the parameter T is retrieved as 1.66, 2.71, 3.75 , corresponding to 5.18, 8.5, 11.77 fs, respectively, which all agree well with the exact values. Note that this method enables one to retrieve the pulse duration without knowing the CEP. Figure 6(b) shows the and the fitted lines for the 5-, 8-, 11.5-fs pulses with a CEP of . The retrieved pulse durations are 5.48, 8.6 and 12 fs, respectively. We have also calculated for other CEPs, the deviations are bellow , showing that this method allows one measured the pulse duration independently on the CEP.
In summary, we investigate the HHG in an ultrashort linearly polarized laser pulse by mixing a weak uv pulse. It is shown that the uv pulse enhances and confines the photonionization in a short interval, and the high harmonics generated in the individual half cycle are clearly separated in the time domain by a 1-fs uv pulse. Further, we show that the HCOs depend sensitively on the CEP of the driving field, enabling one to in situ retrieve the driving laser pulse information with a high accuracy. In addition, we present an alternative way to measure the pulse duration independently on the CEP, and the deviation of the retrieved pulse duration is bellow . We also investigate the influence of the fluctuation on our method. The test simulation shows that neither a variation of the intensity ( ) nor a variation of wavelength (80-150 nm) of the uv pulse change the above results significantly. Moreover, we can clearly distinguish the HCH for a range of laser intensities of and a broader range is possible by taking other target atoms (e.g., He+, Ne). The HCOs still are distinguishable when the pulse duration is increased to 15 fs, indicating a potential to CEP measurement for a multi-cycle pulse. For even longer pulse, the HCHs still are separated in the time domain, but the HCO shift becomes more smaller and more difficult to measure.
Acknowledgements
This work was supported by the National Natural Science Foundation of China under grant Nos. 10574050, 10774054, 10734080 and 973 program under grant No. 2006CB806006. † Author to whom correspondence should be addressed.