Mass segregation in young star clusters: can it be detected from the integrated photometric properties?
Abstract
We consider the effect of mass segregation on the observable integrated properties of star clusters. The measurable properties depend on a combination of the dynamical age of the cluster and the physical age of the stars in the cluster. To investigate all possible combinations of these two quantities, we propose an analytical model for the mass function of segregated star clusters that agrees with the results of N-body simulations, in which any combination can be specified. For a realistic degree of mass segregation and a fixed density profile, we find with increasing age an increase in the measured core radii and a central surface brightness which decreases in all filters more rapidly than what is expected from stellar evolution alone. Within a Gyr the measured core radius increases by a factor of two and the central surface density in all filters of a segregated cluster will be overestimated by a similar factor if mass segregation is not taken into account during the conversion from light to mass. We find that the colour of mass segregated clusters decreases with radius by about 0.1-0.2 mag, which could be observable. From recent observations of partially resolved extra-galactic clusters, a decreasing half-light radius with increasing wavelength was observed, which was attributed to mass segregation. These observations can not be reproduced by our models. In addition, we provide physical arguments based on the evolution of individual stars that one should not expect strong dependence of core radius as a function of the wavelength. We find that the differences between measured radii in different filters are always smaller than 5%.
1 Introduction
Observations of star clusters are often used as test-beds for theories of star formation, the stellar initial mass function (IMF) and dynamical evolution. An important ingredient in most of these theories is the differential distribution of stellar masses within a cluster, or mass segregation.
In several resolved clusters, evidence of mass segregation has been claimed on the basis of observed variations of the stellar mass function (MF) with distance to the cluster centre (see for example Brandl et al. 1996; Hillenbrand & Hartmann 1998; de Grijs et al. 2002; Stolte et al. 2002 for R136 in 30 Doradus, the Orion Nebula Cluster, clusters in the LMC and the Arches cluster, respectively). These observations claim an overabundance of massive stars in the cluster centre. This stratification of stellar masses is expected from dynamical evolution, since dynamical friction slows down the most massive stars. As a result, these stars sink to the cluster centre on a time-scale that is inversely proportional to their mass. Because the aforementioned clusters are dynamically young, the observations advocate a primordial origin for this segregation of stellar masses.
From the “competitive accretion” star formation model (see for example Bonnell et al. 1997), it is expected that the most massive stars form in the highest density environments, corresponding to the inner parts of the clusters. The preferential formation of massive stars in the centre of the cluster is often used to explain the observations of dynamically young, but mass segregated clusters.
The determination of the stellar MF in different annuli around the cluster centre, which is the most common technique used to “detect” mass segregation in resolved clusters, is hampered by several observational difficulties. First, crowding and blending of stars in the core can mimic a shallower MF at that location (Maíz Apellániz, 2008; Ascenso et al., 2007). Second, the determination of stellar masses from the observed luminosities depends on the adopted age, which is usually taken constant for all stars in the cluster. However, only a small spread in age is enough to cause misinterpretations (see Hunter et al. 1995, who show that the MF of the R136 cluster is consistent with Salpeter when this effect is taken into account).
Alternatively, integrated properties, such as the surface brightness profile in different filters can be employed to study radial variations of the stellar MF. In this way one does not have to rely on individual star counts, thus avoiding possible biases; moreover, this method can be used for clusters at larger distances. It was shown that metal-rich (red) star clusters appear to have smaller half-light radii than their metal-poor (blue) counterparts (Jordán, 2004). In addition, one could expect that segregated star clusters appear larger in the ultra-violet (UV) than in the near infra-red (NIR) as most of the light at these red wavelengths comes from the massive stars, whereas the bluer wavelengths are dominated by intermediate mass stars. Tentative evidence for this is given by McCrady et al. (2005) who find a decreasing half-light radius, or effective radius (), with increasing wavelength for the young massive cluster M82-F. Larsen et al. (2008) find for NGC 1569-B that the measured in the -band is around 30-50% larger than the measured in the -band. A smaller radius in the redder filters is qualitatively what one would expect when the massive (red) stars are more centrally concentrated, but it has thus-far not been quantified how large the expected difference is.
Although the integrated properties are free of the biases that are encountered in methods that rely on individual star counts, there are other problems such as variations of the PSF between the different filters (Larsen et al., 2008), differential foreground extinction (Bastian et al., 2007) and intra-cluster extinction (Stolte et al., 2002), that make it a challenging task to accurately determine intrinsic differences between the cluster properties in different filters.
To quantify the expected variations in different filters, we present a method to rapidly simulate integrated luminosity profiles of mass segregated star cluster in different filters. We choose to do this analytically to avoid statistical fluctuations which one has to deal with when considering (realistic) -body systems, and therefore we do not include the dynamical evolution. Instead, we apply our method to clusters with different concentrations, which may result from dynamical evolution.
In Sect. 2 we introduce the model of the mass function of a segregated star cluster and in Sect. 3 we present simulated observational properties of such clusters. A discussion and our conclusions are presented in Sect. 4.
2 The Model
Recent numerical (Portegies Zwart et al., 2007; Gaburov et al., 2008) and observational (Kim et al., 2006) results suggest that the mass function in the inner parts of young (dynamically) segregated star clusters has a broken power-law form with the slope on the high mass end being shallower. We assume a segregated mass function (SMF) of the following form. For , with being the cluster’s half-mass radius in three dimensions, the SMF is
| (1) |
Here is the mean mass of the initial MF (IMF), is the distance to the cluster centre, is the index of the IMF which is assumed to be a power-law, and are the lower and upper limits of the MF, respectively, and is the dependent power-law index of the SMF at the high-mass end. The outer part of the SMF () does not depend on distance to the cluster centre. It can be uniquely constructed in such a way that the integrated cluster mass function results in the IMF, which we assume to be a Salpeter (1955) mass function between and . In other words, the excess of massive stars in the centre of the star cluster occurs at the expense of reducing the number of these stars in the outer regions.
The form of the mass function depends on the choice of the index , which can be arbitrary. Guided by -body simulations (Portegies Zwart et al., 2007), we choose the following “Ansatz”
| (2) |
Here is a free parameter determining the degree of mass segregation in the cluster centre, is a free parameter that specifies the functional form of , is the core radius of the underlying density profile , and is a parameter which is constrained by the condition that the mean stellar mass is a continuous function of , so that there is no jump at . For a given there is a maximum possible that can be achieved in our model in order to satisfy the constraint set by the initial MF. We compute this maximum by solving . Physically, this means that all the most massive stars from the outer region are already in the inner region. Therefore, any further increase in will result in a negative for some below , and this is clearly an unphysical situation.
Given and we can calculate the surface brightness profile in different broad-band filters. We use the Padova isochrones for solar metallicity () (Bertelli et al., 1994; Girardi et al., 1996, 2000) and the conversion to the Johnson-Cousins-Glass photometric system (Girardi et al., 2002) to convert mass to light. Our results do not depend on the adopted metallicity. Also, we explicitly note that all stars in the cluster have the same age and metallicity, which might be an oversimplification, since star cluster with multiple population are know, both young (for example Mackey et al. 2008) and old (for example Piotto et al. 2007). The spatial luminosity profile in a filter centred at wavelength , , is computed using the following conversion , in which is the mean stellar mass as a function of , and with being the luminosity of a star of mass in a filter with central wavelength .
We used a series of King (1966) models parameterised by a scaled central potential (Binney & Tremaine, 1987) as the input density profiles; these models were generated by the starlab software package (Portegies Zwart et al., 2001)111http://www.manybody.org/starlab. We obtain the projected core radius and the surface brightness profile by fitting a King (1962) profile to our models after projecting them in 2D.
Currently, our model contains three free parameters: , , . However, by considering only the maximal value of , we reduce the number of free parameters to two because the index is constrained by . In this case, the value of corresponds to the maximum degree of segregation which is reached at the moment of core collapse and remains roughly constant after that (Portegies Zwart et al., 2007; McMillan et al., 2007). Our results can therefore be considered as upper limits, since smaller values for will weaken the imprint of mass segregation on the integrated properties. We focus our studies on King models with . We find that the simulated properties depend weakly on the value of . Fitting Eq. 2 to -body simulations (Portegies Zwart et al., 2007), we find that . Nevertheless, our numerical experiments show weak dependence of the integrated properties on this parameter. Thus, we generally present our results for unless mentioned otherwise.
Even though there are other methods which include mass segregation in star cluster models (Šubr et al., 2008; Marks et al., 2008), we prefer this broken power-law approximation because it was found in dynamical simulations. In addition, we also provide physical argumentation based on stellar evolution why our results are not expected to be sensitive to stellar metallicity and the details of the model of mass segregation.
3 Results
Our aim is to understand the effect of mass segregation on the observed size of clusters, particularly on and the surface brightness profiles in different filters, as a function of age. In addition, we study the radial variation of colour, since it is expected that the central part of the cluster is redder than the outer parts, due to the overabundance of massive (red) post main-sequence stars there (Fleck et al., 2006). We note that we allow the stars to evolve while fixing the density profile, which is of course not realistic from a dynamical point of view. In reality, the measurable properties of mass segregated clusters will result from a complex interplay between mass loss by stellar evolution and dynamical relaxation processes. Such models only allow the choice of one combination of dynamical and physical age making the exploration of the full parameters space too time-consuming for the scope of this study. We refer the reader to the studies of Hurley (2007) and Mackey et al. (2007) as examples of full -body studies that take into account stellar evolution and the effects of projection.
3.1 Core radii
Mass segregated star clusters have an excess of massive stars in their central regions. As a result, they are expected to appear smaller in the NIR than in UV (Sternberg, 1998), since the light at these wavelengths is dominated by massive stars. If this is correct, it may provide a robust method for determining mass segregation in slightly resolved (extra-galactic) star clusters at distances up to several Mpc.
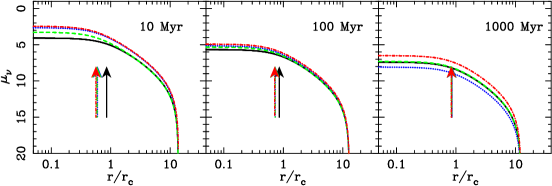
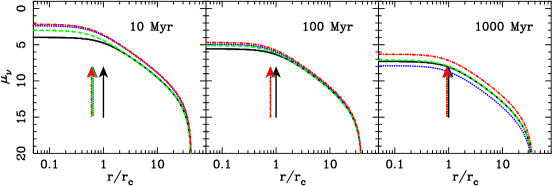
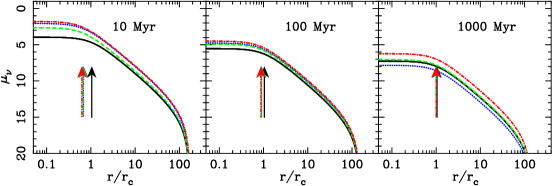
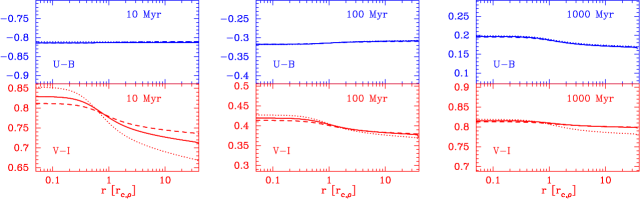
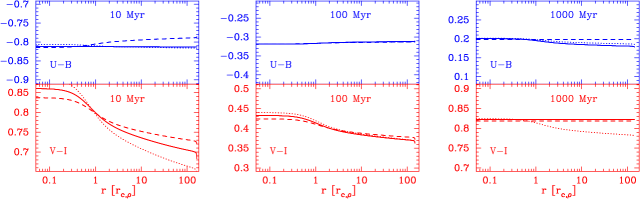
In Fig. 1 we show for different ages the surface brightness profiles for mass segregated clusters with different density profiles in the , and filters resulting from our model (Sect. 2). We use the same at all ages in order to eliminate effects related to the dynamical evolution of the cluster.
At an age of 10 Myr the difference in between the and filter is just 6%, with the smallest radius in the -band. The difference between the true and observed core radius is roughly a factor of two, with the measured radius being smaller. This is because the massive stars dominate the light in all filters and are overabundant in the centre. In the course of time, massive stars leave the main-sequence and become dark objects, such as black holes or neutron stars, which results in an apparent increase of the core radius. The observed core radii become roughly 80% of the true core radii at this age and the difference between core radii in the different filters has nearly disappeared. Finally, at 1 Gyr the light is dominated by red-giant and AGB stars. The turn-off point is close to 2 M⊙ and the light-to-mass ratio in the core is close to unity. We find that the observed core radius is 10% smaller than the true core radius, thus providing a good estimate of the true . However, it is unclear whether at 1 Gyr the mass function can still be represented by a broken power-law (Eq. 1). In fact, recent results suggest that in globular clusters, it is the low-mass part of mass function which becomes dependent (De Marchi et al., 2000; Baumgardt & Makino, 2003). We note that in our model we have assumed that the mass of all remnants is retained, that is, we do not take into account kick velocities, and the mass of the remnant we estimate from its zero age main sequence mass (Eggleton et al., 1989; Portegies Zwart & Verbunt, 1996)
The apparent increase of with age implies that light is not a good tracer of mass for young mass segregated clusters. Mackey & Gilmore (2003) observed a clear trend of increasing core radius with age, which can partially be explained by the effect of mass segregation making the younger clusters appear more compact. However, dynamical effects, such as heating by black hole binaries (Merritt et al., 2004; Mackey et al., 2007) are still required to fully explain the observed trend of the increasing with age for the LMC clusters.
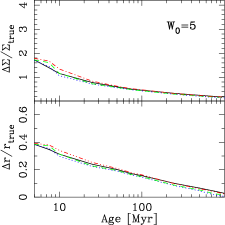
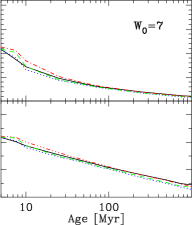
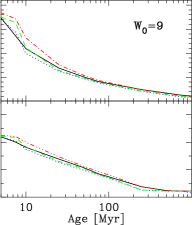
In the lower panel of Fig. 3, we show the time evolution of the difference between the true and the observed in the , and filters, as well as the computed from the bolometric surface brightness profile. As we have shown before, the difference between the true and the observed decreases in the course of time from roughly 50% at 10 Myr to about 10% at 1 Gyr. This result is quite robust showing only a weak dependence on the choice of the parameters and .
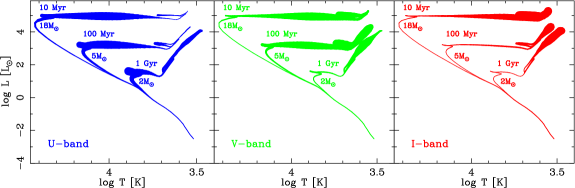
The reason that the core radii are similar at all wavelengths can be understood from some simple arguments. The light in all filters is dominated by stars with masses slightly above the turn-off mass (Fig. 2). The red filters are dominated by giant stars at all ages. The optical and blue filters are also dominated by stars that are close to the turn-off point and not by the stars on the main-sequence. This is because the increase of the light-to-mass ratio with mass is much stronger than the decrease of the number of stars, and this holds for any realistic MF. That is, stars of similar mass dominate the light in all the filters at all ages. However, since stars of similar mass have similar spatial distribution in a mass segregated star cluster, the differences in the observed core radii are small. In the case of mass segregation, MF is a function of the distance to the cluster centre, , such that the mean stellar mass decreases with . Since most of the light comes from stars of similar mass, independent of the shape of the MF, the observed core radii are weakly dependent on how mass segregation is implemented in our model.
The light-to-mass ratio in the centre of a segregated cluster can be several times larger than that of a simple stellar population (SSP) of the same age. Usually, the central mass density of a star cluster is estimated by using the light-to-mass ratio of an SSP model corresponding to the age of the cluster to convert the surface brightness profile to a surface density profile. Since in segregated clusters the light-to-mass ratio in the centre is higher, the central density will be overestimated. If the observed central surface brightness is , one can compute the “observed” central surface density, . The true surface density in the centre, , we obtain from the input density profile. The relative difference between these two quantities is displayed in Fig. 3. Deviations from one are most prominent in the first 100 Myr, where the maximum difference is about a factor of two. This is not a sensitive function of . However, in more concentrated clusters, , the density overestimation is larger by an additional factor of two (Fig. 3)
Our findings could explain the observed trend of decreasing central surface density with age in a sample of LMC and SMC clusters (Noyola & Gebhardt, 2007). If star clusters are born with a high central concentration, their central 3D density will be overestimated by nearly an order of magnitude.
3.2 Colour gradients
An additional tracer of mass segregation is the colour of a star cluster as a function of the distance to the cluster centre. Using a gas dynamics code, Fleck et al. (2006) studied mass segregation in young star clusters and found that the difference between the inner and outer part of the cluster is roughly 0.1 magnitude in the first few 10 Myr, with the inner parts being redder. This difference, though small, might be observable.
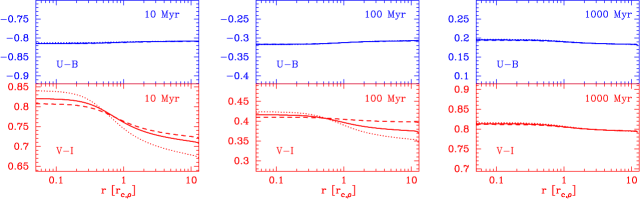
In Fig. 4 we display the colour as a function of at different ages resulting from our models. The colour gradients has a notable dependence on and, therefore, we covered three different values of : 0.3, 0.5, and 0.7. Note that these three cases are all for the maximum degree of mass segregation, that is set by . The value of controls the change of the MF with and the colour variations are sensitive to the value of . In all cases, the largest colour gradient is observed only for the clusters with ages younger than a few times 10 Myrs. The largest colour gradient of is roughly 0.2 magnitude, whereas the gradient of is barely observable. The clusters with high concentration exhibit higher colour gradient than the cluster with low concentration. In the course of time, however, the colour gradients become less prominent. We, therefore, expect that mass segregation might be detectable in young (Myr) star clusters through radial colour variations in or .
4 Discussions and Conclusions
We have simulated observational properties of mass segregated star clusters with the aim to quantify the imprint of mass segregation on integrated cluster properties. We choose to model the segregated mass functions analytically based on results from observations and -body simulations. In order to calculate upper limits of the imprint of mass segregation, we only considered clusters with the maximum possible degree of segregation which can be achieved in our model. While this may not necessary be reached through dynamical evolution, one may think of this setup as the result of a combination of primordial segregation combined with dynamical evolution.
In young (Myr) star clusters, we find only small differences () between the core radius () found in different filters, and the differences becomes smaller for older clusters. The explanation for these small differences is that the most massive stars dominate the light in all filters at all ages. It, therefore, appears that the comparison of the measure in different filters is not a particularly suitable tool to look for mass segregation in star clusters and, therefore, we do not expect that one could study whether the young star cluster is in core-collapse phase by using the light alone (Kim et al., 2006; Portegies Zwart et al., 2007).
The observed is underestimated for young segregated star clusters. The difference with the real decreases with age and is only 10% at 1 Gyr compared to nearly a factor of two at 10 Myr and this does not depend on the cluster concentration. The same factor was found for the half-light radius in gaseous models of mass segregated clusters by Boily et al. (2005).
The underestimation of results in an overestimation of the observed central density. This is because the light-to-mass ratio in the centre of a segregated cluster can be an order of magnitude higher than that of a simple stellar population without segregation and, therefore, central 3D mass density might be overestimated by nearly an order of magnitude. However, due to the projection the measured central surface density is overestimated by a factor of three, and this result slightly depends on the choice of . In particular, for clusters with high concentration the central density might be overestimated by nearly an order of magnitude. These results are consistent with the finding of Boily et al. (2005).
The observed central surface and core radius approached its true value around 1 Gyr. We therefore conclude that light is not a good tracer of mass in young (Myr) star clusters that are segregated and this effect should be taken into account when trends of or central surface density with age are discussed (Scheepmaker et al., 2007; Noyola & Gebhardt, 2007; Bastian et al., 2008). For clusters with ages above 100 Myr these differences are smaller than 20%.
It is possible to observe mass segregation by looking at colour differences between the inner and outer parts of star clusters. We find that our simulated clusters have differences of roughly 0.1-0.2 magnitude between the centre and the outer part of the cluster. This effect has been observed by Larsen et al. (2008) in the Myr old massive cluster NGC 1569-B. The colour difference decreases at older ages.
We would like to stress that our analytic results for the surface brightness profiles represent an observational best case scenario. From the observational data, the accuracy of the determination will be limited by photon noise, and perhaps more importantly, by stochastic effects in the stellar IMF. Several studies have quantified the effect of stochastic fluctuations (see for example Lançon & Mouhcine 2000; Bruzual 2002; Cerviño & Luridiana 2004). Lançon & Mouhcine (2000) determine the age dependent minimum mass a cluster should have, such that the relative fluctuations around the mean flux, , is less than 10%, corresponding to roughly 0.1 mag photometric uncertainty222Photometric uncertainty is calculated form the flux uncertainty in the following way, mag.. When flux is determined in the -band, this minimum mass at ages of [10, 50, 200, 1000] Myr is [] .
We predict that the most prominent feature of mass segregation in the integrated properties is a 0.1 mag difference in colour (Fig. 4) between the inner part and the outer part. In order to be able to report a detection of this difference, one needs an uncertainty of mag and we adopt .
Lançon & Mouhcine (2000) show that scales with , since . This implies that the minimum masses quoted above have to be a factor higher to be able to distinguish a radial colour variations due to mass segregation from stochastic fluctuations due to IMF sampling. For the 10 Myr case this implies a minimum mass of . This means it will be difficult to detect mass segregation in young massive Galactic clusters, such as the Arches clusters or Westerlund 1. Even the cluster R136 in the 30 Doradus region in the Large Magellanic Cloud is probably of too low mass to detect mass segregation. R136 is probably a special case anyway, since it does not have red evolved stars, which all of our models do have. Young clusters more massive than are known, for example in the Antennae galaxies (Whitmore & Schweizer, 1995) and M51 (Larsen, 2000; Bastian et al., 2005), but these are too distant (Mpc) to be able to determine a colour gradient in the light profile. There are probably only a handful of candidate clusters that are resolved enough such that a colour gradient can be observed (for example some of the young massive cluster in M82 (O’Connell et al., 1995), the massive “young globular cluster” in NGC 6946 (Hodge, 1967; Larsen et al., 2002) and a few clusters in M83 (Larsen & Richtler, 2004).
An alternative method to detect differences in the IMF between the inner and outer parts would be to determine the spectral properties. If this can be done without changing instrument set-up, then no problems with changing PSFs or weather conditions should affect the observations. It would, therefore, be interesting to investigate which spectral range would be most sensitive to changes of the slope in the IMF.
5 Acknowledgements
We thank Nate Bastian for ideas and suggestions and Simon Portegies Zwart, Henny Lammers, Søren Larsen and Andres Jordán for helpful discussion. EG is supported by NWO under the grant #635.000.303.
References
- Ascenso et al. (2007) Ascenso J., Alves J., Lago M. T. V. T., 2007, A&A, submitted
- Bastian et al. (2008) Bastian N., Gieles M., Goodwin S. P., Trancho G., Smith L., Konstantopoulos I., Efremov Y., 2008, ArXiv:0806.1460, MNRAS in press
- Bastian et al. (2005) Bastian N., Gieles M., Lamers H. J. G. L. M., Scheepmaker R. A., de Grijs R., 2005, A&A, 431, 905
- Bastian et al. (2007) Bastian N., Konstantopoulos I., Smith L. J., Trancho G., Westmoquette M. S., Gallagher J. S., 2007, MNRAS, 379, 1333
- Baumgardt & Makino (2003) Baumgardt H., Makino J., 2003, MNRAS, 340, 227
- Bertelli et al. (1994) Bertelli G., Bressan A., Chiosi C., Fagotto F., Nasi E., 1994, A&AS, 106, 275
- Binney & Tremaine (1987) Binney J., Tremaine S., 1987, Galactic dynamics. Princeton, NJ, Princeton University Press, 1987, 747 p.
- Boily et al. (2005) Boily C. M., Lançon A., Deiters S., Heggie D. C., 2005, ApJL, 620, L27
- Bonnell et al. (1997) Bonnell I. A., Bate M. R., Clarke C. J., Pringle J. E., 1997, MNRAS, 285, 201
- Brandl et al. (1996) Brandl B., Sams B. J., Bertoldi F., Eckart A., Genzel R., Drapatz S., Hofmann R., Loewe M., Quirrenbach A., 1996, ApJ, 466, 254
- Bruzual (2002) Bruzual G., 2002, in Geisler D., Grebel E. K., Minniti D., eds, Extragalactic Star Clusters Vol. 207 of IAU Symposium, Stellar Populations in Star Clusters: The Rôle Played by Stochastic Effects. pp 616–+
- Cerviño & Luridiana (2004) Cerviño M., Luridiana V., 2004, A&A, 413, 145
- de Grijs et al. (2002) de Grijs R., Gilmore G. F., Johnson R. A., Mackey A. D., 2002, MNRAS, 331, 245
- De Marchi et al. (2000) De Marchi G., Paresce F., Pulone L., 2000, ApJ, 530, 342
- Eggleton et al. (1989) Eggleton P. P., Tout C. A., Fitchett M. J., 1989, ApJ, 347, 998
- Fleck et al. (2006) Fleck J.-J., Boily C. M., Lançon A., Deiters S., 2006, MNRAS, 369, 1392
- Gaburov et al. (2008) Gaburov E., Gualandris A., Portegies Zwart S., 2008, MNRAS, 384, 376
- Girardi et al. (2002) Girardi L., Bertelli G., Bressan A., Chiosi C., Groenewegen M. A. T., Marigo P., Salasnich B., Weiss A., 2002, A&A, 391, 195
- Girardi et al. (2000) Girardi L., Bressan A., Bertelli G., Chiosi C., 2000, A&AS, 141, 371
- Girardi et al. (1996) Girardi L., Bressan A., Chiosi C., Bertelli G., Nasi E., 1996, A&AS, 117, 113
- Hillenbrand & Hartmann (1998) Hillenbrand L. A., Hartmann L. W., 1998, ApJ, 492, 540
- Hodge (1967) Hodge P. W., 1967, PASP, 79, 29
- Hunter et al. (1995) Hunter D. A., Shaya E. J., Holtzman J. A., Light R. M., O’Neil Jr. E. J., Lynds R., 1995, ApJ, 448, 179
- Hurley (2007) Hurley J. R., 2007, MNRAS, 379, 93
- Jordán (2004) Jordán A., 2004, ApJL, 613, L117
- Kim et al. (2006) Kim S. S., Figer D. F., Kudritzki R. P., Najarro F., 2006, ApJL, 653, L113
- King (1962) King I., 1962, AJ, 67, 471
- King (1966) King I. R., 1966, AJ, 71, 64
- Lançon & Mouhcine (2000) Lançon A., Mouhcine M., 2000, in Lançon A., Boily C. M., eds, Massive Stellar Clusters Vol. 211 of Astronomical Society of the Pacific Conference Series, Stochastic Fluctuations in the Spectrophotometric Properties of Star Clusters. pp 34–+
- Larsen (2000) Larsen S. S., 2000, MNRAS, 319, 893
- Larsen et al. (2002) Larsen S. S., Efremov Y. N., Elmegreen B. G., Alfaro E. J., Battinelli P., Hodge P. W., Richtler T., 2002, ApJ, 567, 896
- Larsen et al. (2008) Larsen S. S., Origlia L., Brodie J., Gallagher J. S., 2008, MNRAS, 383, 263
- Larsen & Richtler (2004) Larsen S. S., Richtler T., 2004, A&A, 427, 495
- Mackey et al. (2008) Mackey A. D., Broby Nielsen P., Ferguson A. M. N., Richardson J. C., 2008, ApJL, 681, L17
- Mackey & Gilmore (2003) Mackey A. D., Gilmore G. F., 2003, MNRAS, 338, 85
- Mackey et al. (2007) Mackey A. D., Wilkinson M. I., Davies M. B., Gilmore G. F., 2007, MNRAS, 379, L40
- Maíz Apellániz (2008) Maíz Apellániz J., 2008, ApJ, 677, 1278
- Marks et al. (2008) Marks M., Kroupa P., Baumgardt H., 2008, MNRAS, 386, 2047
- McCrady et al. (2005) McCrady N., Graham J. R., Vacca W. D., 2005, ApJ, 621, 278
- McMillan et al. (2007) McMillan S. L. W., Vesperini E., Portegies Zwart S. F., 2007, ApJL, 655, L45
- Merritt et al. (2004) Merritt D., Piatek S., Portegies Zwart S., Hemsendorf M., 2004, ApJL, 608, L25
- Noyola & Gebhardt (2007) Noyola E., Gebhardt K., 2007, AJ, 134, 912
- O’Connell et al. (1995) O’Connell R. W., Gallagher III J. S., Hunter D. A., Colley W. N., 1995, ApJL, 446, L1+
- Piotto et al. (2007) Piotto G., Bedin L. R., Anderson J., King I. R., Cassisi S., Milone A. P., Villanova S., Pietrinferni A., Renzini A., 2007, ApJL, 661, L53
- Portegies Zwart et al. (2007) Portegies Zwart S., Gaburov E., Chen H.-C., Gürkan M. A., 2007, MNRAS, 378, L29
- Portegies Zwart et al. (2001) Portegies Zwart S. F., McMillan S. L. W., Hut P., Makino J., 2001, MNRAS, 321, 199
- Portegies Zwart & Verbunt (1996) Portegies Zwart S. F., Verbunt F., 1996, A&A, 309, 179
- Salpeter (1955) Salpeter E. E., 1955, ApJ, 121, 161
- Scheepmaker et al. (2007) Scheepmaker R. A., Haas M. R., Gieles M., Bastian N., Larsen S. S., Lamers H. J. G. L. M., 2007, A&A, 469, 925
- Sternberg (1998) Sternberg A., 1998, ApJ, 506, 721
- Stolte et al. (2002) Stolte A., Grebel E. K., Brandner W., Figer D. F., 2002, A&A, 394, 459
- Šubr et al. (2008) Šubr L., Kroupa P., Baumgardt H., 2008, MNRAS, 385, 1673
- Whitmore & Schweizer (1995) Whitmore B. C., Schweizer F., 1995, AJ, 109, 960