, , spectro-interferometry of the Mira variable S Orionis ††thanks: Based on observations made with the VLT Interferometer (VLTI) at Paranal Observatory under program ID 080.D-0691
Abstract
Aims. We present , , spectrally dispersed interferometry with a spectral resolution of 35 for the Mira variable S Orionis. We aim at measuring the diameter variation as a function of wavelength that is expected due to molecular layers lying above the continuum-forming photosphere. Our final goal is a better understanding of the pulsating atmosphere and its role in the mass-loss process.
Methods. Visibility data of S Ori were obtained at phase 0.78 with the VLTI/AMBER instrument using the fringe tracker FINITO at 29 spectral channels between 1.29 m and 2.32 m. Apparent uniform disk (UD) diameters were computed for each spectral channel. In addition, the visibility data were directly compared to predictions by recent self-excited dynamic model atmospheres.
Results. S Ori shows significant variations in the visibility values as a function of spectral channel that can only be described by a clear variation in the apparent angular size with wavelength. The closure phase values are close to zero at all spectral channels, indicating the absence of asymmetric intensity features. The apparent UD angular diameter is smallest at about 1.3 m and 1.7 m and increases by a factor of 1.4 around 2.0 m. The minimum UD angular diameter at near-continuum wavelengths is =8.10.5 mas, corresponding to 420 R⊙. The S Ori visibility data and the apparent UD variations can be explained reasonably well by a dynamic atmosphere model that includes molecular layers, particularly water vapor and CO. The best-fitting photospheric angular diameter of the model atmosphere is =8.30.2 mas, consistent with the UD diameter measured at near-continuum wavelengths.
Conclusions. The measured visibility and UD diameter variations with wavelength resemble and generally confirm the predictions by recent dynamic model atmospheres. These size variations with wavelength can be understood as the effects from water vapor and CO layers lying above the continuum-forming photosphere. The major remaining differences between observations and model prediction are very likely due to an imperfect match of the phase and cycle combination between observation and available models.
Key Words.:
Techniques: interferometric – Stars: AGB and post-AGB – Stars: atmospheres – Stars: individual: S~Ori1 Introduction
Mira stars are low-mass, large-amplitude, long-period variable stars on the AGB, evolving toward the planetary nebula and white dwarf phases. They exhibit a mass-loss rate on the order of 10-6 M⊙/year that significantly affects the further stellar evolution and is one of the most important sources for the chemical enrichment of the interstellar medium. The dust condensation sequence, the wind-driving mechanism, and the role of pulsation are currently not well understood, in particular for oxygen-rich AGB stars (Woitke et al. woitke06 (2006); Höfner & Andersen hoefner07 (2007)). The pulsating atmospheres of Mira stars can become very extended because of dynamic effects including shock fronts, and they are very cool in their outer parts. Here, molecules can form, which for O-rich stars are most importantly H2O, CO, TiO, and SiO (Tsuji et al. tsuji97 (1997); Tej et al. tej03 (2003); Ohnaka ohnaka04 (2004)). Wittkowski et al. (wittkowski07 (2007)) found for the case of S Ori that Al2O3 dust condenses within the extended atmosphere at phase-dependent distances of 1.8–2.4 photospheric radii. This extended atmosphere, which is characterized by phase-dependent temperature and density stratifications, the presence of molecular layers, and the formation of dust, is thus of particular interest for our better understanding of pulsation and mass loss. Observed radii of Mira stars have been found to differ for different optical and infrared bandpasses (e.g. Thompson et al. thompson02 (2002); Mennesson et al. mennesson02 (2002); Ireland et al. ireland04a (2004); Perrin et al. perrin04 (2004); Eisner et al. eisner07 (2007)), and this has been attributed to the presence of molecular layers located above the continuum-forming photosphere. Here, we present both a spectro-interferometric observation of the Mira star S Ori that covers the near-infrared , , and bands simultaneously at a spectral resolution of 35 and a comparison to recent self-excited dynamic model atmospheres.
S Ori is a Mira variable star with spectral type M6.5e–M9.5e and magnitude 7.2–14.0 (Samus et al. samus04 (2004)). We use a Julian Date of last maximum brightness , a period (as in Wittkowski et al. wittkowski07 (2007)), and the distance of from van Belle et al. (vanbelle02 (2002)). The broadband near-infrared UD angular diameter of S Ori has been measured by van Belle et al. (vanbelle96 (1996)), Millan-Gabet et al. (millan05 (2005)), and Boboltz & Wittkowski (boboltz05 (2005)) to values between 9.6 mas and 10.5 mas at different phases. Joint VLTI/MIDI and VLBA/SiO maser observations by Wittkowski et al. (wittkowski07 (2007)) have shown that S Ori exhibits significant phase-dependencies of the atmospheric extension and dust shell parameters with photospheric angular diameters between 7.9 mas and 9.7 mas.
| Target | Purpose | DIT | Time | [m] | PAp | AM | Seeing | |||
|---|---|---|---|---|---|---|---|---|---|---|
| [mas] | [msec] | [UTC] | E0-G0/G0-H0/E0-H0 | [] | [msec] | |||||
| 45~Eri | Calibrator (K3 II-III) | 2.150.04 | 25 | 08:03-08:07 | 16.0/31.9/47.9 | -107 | 1.1 | 1.3 | 1.3 | |
| 45 Eri | Calibrator (K3 II-III) | 2.150.04 | 50 | 08:09-08:12 | 16.0/32.0/48.0 | -107 | 1.1 | 1.3 | 1.3 | |
| $γ$~Eri | Check star (M0.5 IIIb) | 8.740.09 | 25 | 08:22-08:26 | 15.6/31.2/46.8 | -104 | 1.1 | 1.4 | 1.2 | |
| Eri | Check star (M0.5 IIIb) | 8.740.09 | 50 | 08:28-08:32 | 15.5/31.0/46.5 | -104 | 1.1 | 1.4 | 1.2 | |
| S Ori | Science target | 25 | 08:45-08:49 | 0.78 | 15.9/31.8/47.8 | -107 | 1.1 | 1.3 | 1.3 | |
| S Ori | Science target | 50 | 08:52-08:57 | 0.78 | 16.0/31.9/47.9 | -107 | 1.1 | 1.3 | 1.3 | |
| Hor | Calibrator (K2 III) | 2.760.03 | 25 | 09:14-09:18 | 14.5/28.9/43.3 | -91 | 1.1 | 1.2 | 1.4 | |
| Hor | Calibrator (K2 III) | 2.760.03 | 50 | 09:21-09-24 | 14.3/28.7/43.0 | -90 | 1.1 | 1.4 | 1.2 | |
| S Ori | Science target | 25 | 09:36-09:40 | 0.78 | 15.9/31.8/47.7 | -106 | 1.1 | 1.5 | 1.1 |
2 Observations and data reduction
We obtained near-infrared , , interferometry of S Ori with the instrument AMBER (Petrov et al. petrov07 (2007)) in low-resolution mode at the ESO VLTI using the fringe tracker FINITO and three VLTI Auxiliary Telescopes (ATs) on 12 October 2007 (JD 2454386). The ATs were positioned on stations E0, G0, and H0. The date of observation corresponds to a visual phase =0.78, with an uncertainty of about 0.1. The details of the observing sequence are listed in Table 1, including the projected baseline lengths () and position angles (PAp), the airmass (AM), and the optical seeing and coherence time. Ambient conditions were not very good but stable. The airmass was the same for all observations. Data were recorded using two different detector integration times (DITs) of 25 msec and 50 msec.
The VLTI fringe-tracker FINITO records fringes on the two shortest baselines using 70% of the -band light. Output signals are processed in realtime and used to compensate for the fringe motion due to atmospheric turbulence. Owing to the low coherence time during the observations, FINITO was only able to provide average performances of 0.2–0.4 m RMS (to be compared with 0.1 m RMS achieved in good conditions). Nevertheless such a performance is sufficient for increasing the signal-to-noise ratio (S/R) of the AMBER data and stabilizing the transfer function. All observations used here were obtained with exactly the same FINITO controller parameters, which is important for avoiding systematic biases in calibrating the absolute visibility.
In addition to S Ori, the two calibration stars 45 Eri and Hor were observed close in time, as was Eri. The last is a regular non-pulsating M 0.5 giant with a well-known angular diameter similar to that of S Ori which is not expected to exhibit strong effects from molecular layers. This data is used to check that any strong wavelength-dependent features found for S Ori are not caused by any systematic effects of the instrument. The spectral types and angular diameters of the calibration and check stars are from Bordé et al. (borde02 (2002)).
Raw visibility and closure phase values were computed using the latest version of the amdlib package (version 2.0 beta 2b) and the yorick interface provided by the AMBER consortium and the Jean-Marie Mariotti Center. Absolute wavelength correlation was performed by correlating the raw spectra of all four stars with a model of the atmospheric transmission with the same spectral resolution. In particular, we used a plateau in the transmission curve at 2.0 m. The offset with respect to the original wavelength table was 3 spectral channels (0.1 m at a wavelength of 2.0 m). We estimated the error of the absolute wavelength calibration to 1 pixel ( 0.03 m). Individual frames were averaged after frame selection keeping 70% of the best frames based on piston (to remove the frames when the FINITO loop was not closed) and out of these keeping 30% of the best frames based on S/R. We verified that keeping up to 80% of the best frames based on SNR did not significantly change the results. The S Ori and Eri visibility data were calibrated for each DIT value separately using the 45 Eri and Hor calibration star data. After calibration, the different calibrated S Ori and Eri data were averaged. The errors of the calibrated visibility data include the statistical error of averaging the single frames, the errors of the calibration stars’ angular diameters, and the variation of the available transfer function measurements.
3 Results
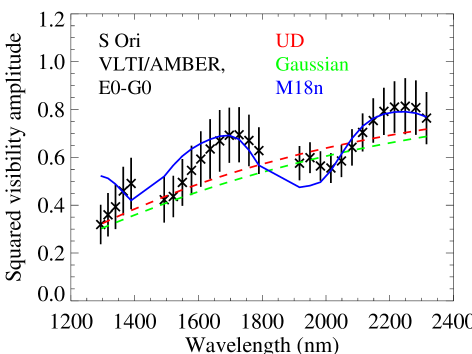
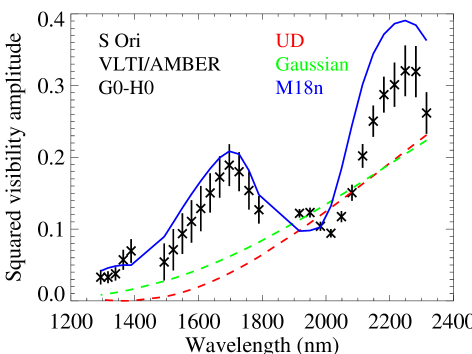
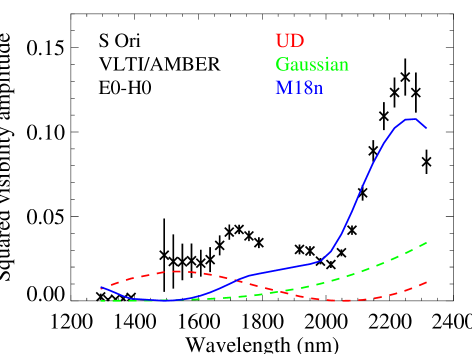
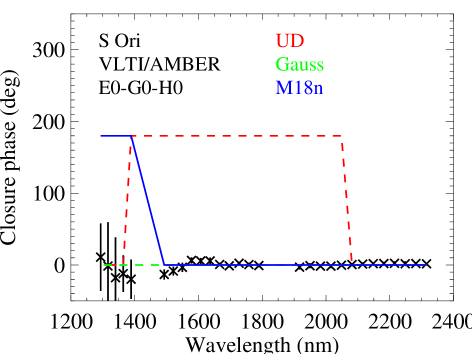
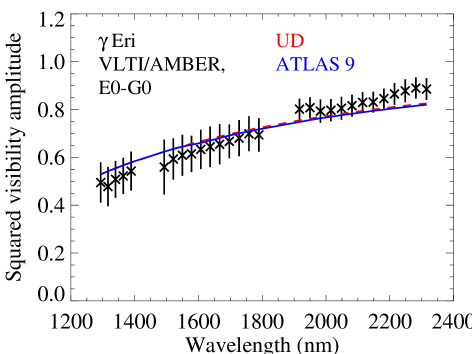
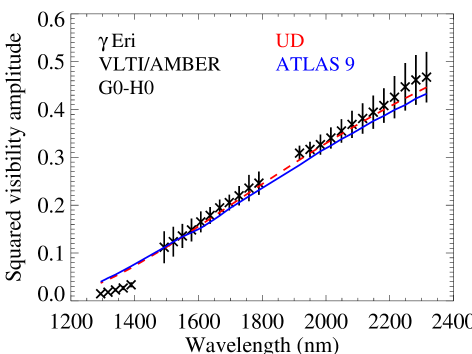
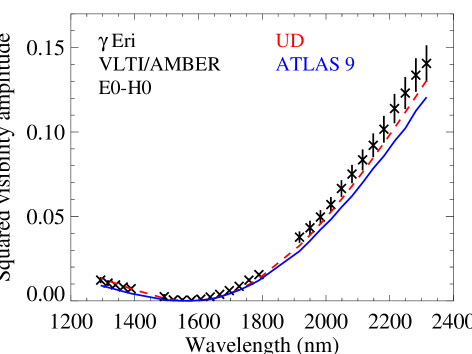
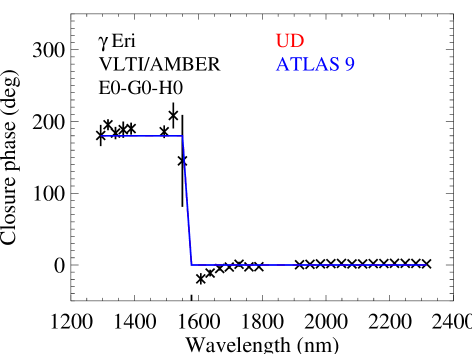
Figures 1 and 2 show the resulting visibility and closure phase data for S Ori and for the check star Eri, respectively. The gaps in the visibility data around 1.45 m and 1.85 m correspond to the regions between the bands. Also shown are the best fitting models of a UD with a constant diameter, of a Gaussian disk with a constant diameter, and of atmosphere models. The latter are for S Ori the M18n model (described in detail below in Sect. 4), and for Eri an ATLAS 9 model atmosphere (Kurucz kurucz (1993)) with =3750 K, =1.5, and solar chemical abundance as expected for Eri (Bordé et al. borde02 (2002)). The comparison of the S Ori visibility data to the dynamic model atmosphere is described in detail below in Sect. 4.
The calculation of synthetic visibility values and the fits to the
interferometric data were performed as in Wittkowski et al.
(wittkowski06 (2006, 2007)).
The fitted angular diameter of the Gaussian model corresponds to the FWHM,
that of the plane-parallel ATLAS 9 model to the 0% intensity (limb-darkened)
radius, and that of the M18n model to the 1.04 m (photospheric) radius
(as defined in Ireland et al. 2004b ).
The best-fit angular diameters are
S Ori: =10.8 mas; =6.9 mas;
=8.3 mas
Eri: =8.5 mas; =8.9 mas.
The errors are 0.2 mas
The visibility data of the check star Eri can be described well by a UD of constant diameter and by the ATLAS 9 model atmosphere. There are no significant wavelength-dependent deviations between measured visibility data and the UD model. It is not yet clear whether the relatively low -band visibilities for the G0-H0 baseline and the deviations in the closure phase values near the flip are caused by an asymmetric stellar surface feature or a systematic calibration uncertainty. Note that the angular diameter of Eri based on a given model is well-constrained by the position of the visibility minimum, which is independent of an absolute visibility calibration. The resulting angular diameter =8.90.2 mas is consistent with the value given in Bordé et al. (borde02 (2002)) of =8.740.09 mas.
The visibility data of S Ori show significant wavelength-dependent features clearly deviating from UD and Gaussian models of constant diameter on all three baselines. This indicates variations in the apparent angular diameter. The S Ori closure phase values are consistent with zero at all spectral channels, indicating the absence of asymmetric features in the intensity distribution.
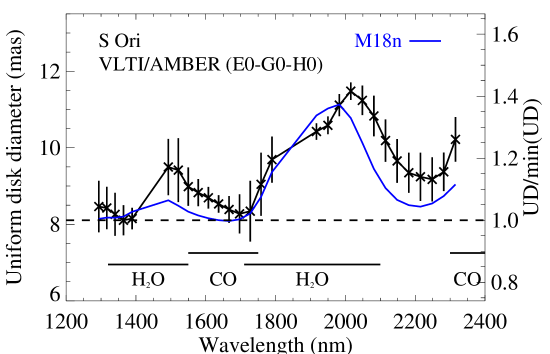
In order to characterize the variation of S Ori’s angular diameter as a function of wavelength, we fitted UD diameters to the data of each spectral channel separately. Figure 3 shows the resulting UD diameter values as a function of wavelength. Note that the intensity profile of a Mira star is generally not expected to be close to a UD and that this approach can only give a rough estimate of S Ori’s characteristic size as a function of wavelength. Fits of Gaussian functions lead to similar results. The apparent UD angular diameter shows clear variations with wavelength. It is smallest at about 1.3 m and 1.7 m and increases by a factor of 1.4 around 2.0 m. The minimum UD angular diameter of S Ori at the near-continuum wavelengths is =8.10.5 mas. This result at visual phase 0.78 is consistent with the S Ori photospheric angular diameters between 7.9 mas at phase 0.55 and 9.7 mas at phase 1.15 derived in Wittkowski et al. (wittkowski07 (2007)) based on VLTI/MIDI data and modeling with dynamic model atmospheres and a radiative transfer model of the dust shell. These photospheric angular diameters are also consistent with previous broadband measurements (cf. Wittkowski et al. wittkowski07 (2007)). With the adopted distance to S Ori, the angular diameter =8.10.5 mas corresponds to a radius 418 130 R⊙.
4 Comparison to dynamic Mira star atmosphere models
Few dynamic atmosphere models for oxygen-rich Mira stars are available that include the effects of molecular layers. The P and M model series (Ireland et al. 2004a ; 2004b ) are complete self-excited dynamic model atmospheres of Mira stars designed to match the prototype oxygen-rich Mira stars Cet and R Leo. They have been used successfully for comparisons to recent broadband interferometric data of Cet and R Leo (Woodruff et al. woodruff04 (2004); Fedele et al. fedele05 (2005)). Compared to Cet and R Leo, S Ori is a slightly cooler Mira variable with a longer period, a higher main-sequence precursor mass, and a larger radius. However, when scaled to variability phases between 0 and 1 and to the corresponding angular size on the sky, the general model results are not expected to be dramatically different for S Ori compared to Cet and R Leo (cf. the discussion in Wittkowski et al. wittkowski07 (2007)). The M model series was chosen to model the atmosphere of S Ori by Wittkowski et al. (wittkowski07 (2007)) as the currently best available option to describe Mira star atmospheres. Monochromatic center-to-limb variations (CLVs) at 46 angles between 0 and 5 based on the P and M models were recomputed for the wavelength range from 1–2.5 m in steps of 0.001 m.
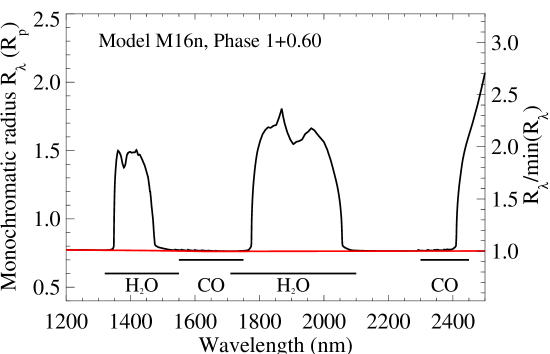
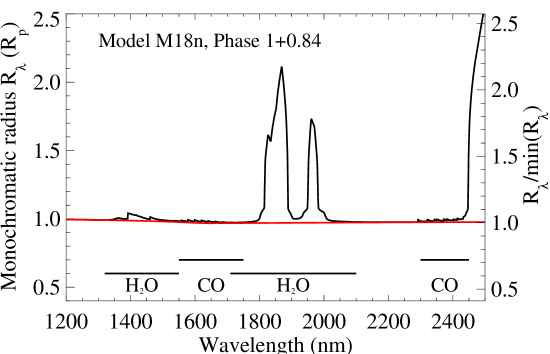
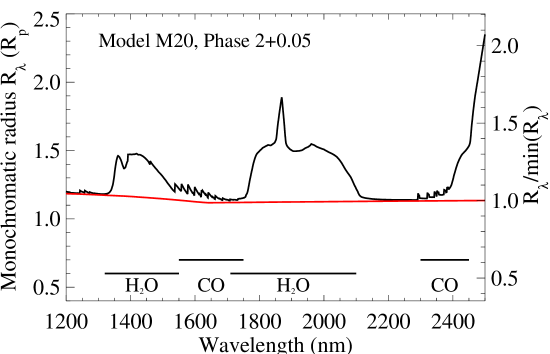
The P and M dynamic model atmospheres predict significant changes in the monochromatic radius , caused by molecular layers that lie above the continuum-forming photosphere and significantly affect certain bandpasses. Figure 4 shows the monochromatic radius in units of the non-pulsating parent star radius for the example of three models of the series. It illustrates the strong phase dependence of the molecular layers. The models are M16n (model phase 1.60), M18n (1.84), and M20 (2.05) models. The red lines denote for comparison the values solely based on the continuum radiation excluding all atomic and molecular features. Also shown are the positions of the H2O and CO bands after Lançon & Wood (lancon00 (2000)) and references therein. The most prominent features of these model curves in the near-infrared region are two water vapor features around 1.4 m and 1.9 m, and also CO features around 1.6 m and 2.4 m. The strengths, shapes, and widths of these molecular features depend strongly on the stellar phase (and also on cycle), as is evident from the comparison of the three model curves. Also, the relative strengths of the molecular features varies with stellar phase.
Model M18n provides the best formal fit to our S Ori AMBER visibility data out of the 20 available phase and cycle combinations of the M series. The synthetic visibility values based on the M18n model compared to our AMBER observation are indicated in Fig. 1. Here, the angular photospheric diameter corresponding to the 1.04 m (photospheric) model radius (defined in Ireland et al. 2004b ) is =8.3 0.2 mas, consistent with the UD diameter at near-continuum wavelengths 1.3 m and 1.7 m of =8.10.5 mas. The theoretical radii in Fig. 4 cannot be compared directly to the UD diameters derived from our AMBER data (Fig. 3), because of the different spectral resolution and because the model-predicted CLVs can be very different from a UD model (so that different radius definitions are not equal). The translation of the model prediction into a UD diameter depends on the exact shape of the bandpass-averaged CLV and the baselines used. To compare the model predictions to the measured UD values in Fig. 3, we fitted UD diameters to the synthetic visibility values of the M18n model using exactly the same spectral channels, baseline configuration, and fit method as for our AMBER data. The resulting model prediction for the UD diameter as a function of wavelength is shown in Fig. 3, in comparison to the values derived from the observation.
Figures 1 and 3 show that our AMBER visibility
data can be described reasonably well by the dynamic atmosphere model
M18n. The differences between observations and model prediction are
most likely due to an imperfect match of the phase and cycle combination
between observation and available M models of the series. Looking
at Figs. 3 and 4, it is evident
that a better fit to our AMBER data could be obtained with a model that
shows a stronger 1.4 m water vapor feature of the same shape
compared to M18n (as seen for instance in the case of M20),
and at the same time a just as strong but broader 1.9 m feature (as for
instance in the case of M16n).
It is quite possible that such a combination of the two water-vapor features
could appear for a model of another phase-cycle combination.
Also, some differences between M model predictions and observations of
S Ori are expected due to the different stellar parameters of S Ori
compared to the parent star of the M model series. Finally, differences
can also be caused by remaining uncertainties in the absolute calibration
of visibility values and of the wavelength scale. The S Ori dust shell
of =1.5–2.5 as modeled in Wittkowski et al. (wittkowski07 (2007))
is not expected to have a noticeable effect on our near-infrared visibility data,
because its contribution to the visibility was already small at 8 m
and because the visibility data are calibrated separately for each
spectral channel.
In summary, our AMBER observations of S Ori generally confirm the predictions by the M model series and we find that the observed variation of diameter with wavelength can be understood as the effect of phase-dependent water vapor and CO layers lying above the photosphere. The M model series can be used reasonably well to model the atmosphere of a Mira star such as S Ori and to derive a reliable photospheric radius based on broadband data. More such observations are needed to confirm and constrain the model predictions in more detail and to monitor the predicted phase dependence of the strength and characteristics of the molecular layers. Simultaneously obtained spectra would be a valuable addition.
Acknowledgements.
We acknowledge with thanks the use of the AMBER data reduction software from the JMMC (version 2.0 beta 2b).References
- (1) Boboltz, D. A., & Wittkowski, M. 2005, ApJ, 618, 953
- (2) Bordé, P., Coudé du Foresto, V., Chagnon, G., & Perrin, G. 2002, A&A, 393, 183
- (3) Eisner, J. A., Graham, J. R., Akeson, R. L., et al. 2007, ApJ, 654, L77
- (4) Fedele, D., Wittkowski, M., Paresce, F., et al. 2005, A&A, 431, 1019
- (5) Höfner, S., & Andersen, A. C. 2007, A&A, 465, L39
- (6) Ireland, M., Tuthill, P., Robertson, G., et al. 2004, ASP Conf. Proc. 310, 327
- (7) Ireland, M. J., Scholz, M., & Wood, P. R. 2004a, MNRAS, 352, 318
- (8) Ireland, M. J., Scholz, M., Tuthill, P., & Wood, P. 2004b, MNRAS, 355, 444
- (9) Kurucz, R. 1993, Limbdarkening for 2 km/s grid (No. 13): [+0.0] to [-5.0]. Kurucz CD-ROM No. 17. Smithsonian Astrophysical Observatory
- (10) Lançon, A., & Wood, P. R. 2000, A&AS, 146, 217
- (11) Mennesson, B., Perrin , G., Chagnon, G., et al. 2002, ApJ, 579, 446
- (12) Millan-Gabet, R., Pedretti, E., Monnier, J. D., et al. 2005, ApJ, 620, 961
- (13) Ohnaka, K. 2004, A&A, 424, 1011
- (14) Perrin, G., Ridgway, S. T., Mennesson, B., et al. 2004, A&A, 426, 279
- (15) Petrov, R. G., Malbet, F., Weigelt, G., et al. 2007, A&A, 464, 1
- (16) Samus, N. N., Durlevich, O. V., & et al. 2004, Combined General Catalog of Variable Stars (GCVS4.2, 2004 Ed.) VizieR Online Data Catalog, 2250
- (17) Tej, A., Lançon, A., & Scholz, M. 2003, A&A, 401, 347
- (18) Thompson, R. R., Creech-Eakman, M. J., & van Belle, G. 2002, ApJ, 577, 447
- (19) Tsuji, T., Ohnaka, K., Aoki, W., & Yamamura, I. 1997, A&A, 320, L1
- (20) van Belle, G. T., Dyck, H., Benson, J., & Lacasse, M. 1996, AJ, 112, 2147
- (21) van Belle, G. T., Thompson, R. R., & Creech-Eakman, M. J 2002, AJ, 124, 1706
- (22) Woitke, P. 2006, A&A, 460, L9
- (23) Woodruff, H. C., Eberhardt, M., Driebe, T., et al. 2004, A&A, 421, 703
- (24) Wittkowski, M., Hummel, C. A., Aufdenberg, J. P., & Roccatagliata, V. 2006, A&A, 460, 843
- (25) Wittkowski, M., Boboltz, D. A., Ohnaka, K., Driebe, T., & Scholz, M. 2007, A&A, 470, 191