Ac hopping conduction at extreme disorder takes place on the percolating cluster
Abstract
Simulations of the random barrier model show that ac currents at extreme disorder are carried almost entirely by the percolating cluster slightly above threshold; thus contributions from isolated low-activation-energy clusters are negligible. The effective medium approximation in conjunction with the Alexander-Orbach conjecture leads to an excellent analytical fit to the universal ac conductivity with no nontrivial fitting parameters.
Recent advances relating to ion conduction in glasses and other disordered solids include the application of multidimensional NMR techniques nmr , the introduction of ac nonlinear spectroscopy roling , and elucidations of the high-frequency nearly constant loss ncl . Moreover, it was found that the old idea of ions moving by the vacancy mechanism may well be correct vac , and simulations gave new insight into the mixed-alkali effect lam05 . Despite these and other significant advances, important questions remain unanswered. For instance, it is still not understood what role is played by ion interactions for the conductivity role , or why the random barrier model (RBM) rbm ; dca represents ac conductivity data so well. The latter question is not answered below, but new simulations and arguments are presented that we believe lead to a full understanding of the physics of the RBM in the extreme disorder limit (low temperature limit).
Ac conductivity is often studied also for amorphous semiconductors, electronically or ionically conducting polymers, defective crystals of various kinds, polaronic conductors, etc rbm ; dca . It is a longstanding observation that all disordered solids have remarkably similar ac conductivities univ . Universal features include dca : At low frequencies the conductivity is constant. At higher frequencies it follows an approximate power law with an exponent less than one that increases slightly with increasing frequency. When measured in a fixed frequency range, the exponent converges to one as temperature goes to zero. The ac conductivity is less temperature dependent than the dc conductivity and obeys time-temperature superposition (sometimes referred to as “scaling”). The frequency marking onset of ac conduction, , has the same activation energy as the dc conductivity.
These and other observed features are reproduced by the RBM characterized dca ; dyr by five assumptions: 1) All charge carrier interactions including self-exclusion are ignored; 2) Charge carrier motion takes place on a cubic lattice; 3) All lattice sites have same energy; 4) Only nearest-neighbor jumps are allowed; 5) Jump rates have random activation energies with distribution . In the RBM the ac conductivity relative to as a function of a suitably scaled frequency becomes independent of in the extreme disorder limit, i.e., when the width of is much larger than dca . Despite lack of non-trivial free parameters the RBM universal ac conductivity gives a good fit to experiment dca ; more refined models yield results that are close to those of the RBM rbm_ref .
It is well-known that the percolation threshold determines the dc conductivity activation energy perc . At low temperatures the particles preferably jump across the lowest barriers. The highest barriers on the percolation cluster are bottlenecks dominating the low-temperature dc conductivity. If is the highest barrier on the percolating cluster, one has as perc . In order to have a non-zero dc conductivity of the percolation cluster, barriers slightly above the percolation threshold must be included. This defines the “fat percolation cluster” dca ; on length scales shorter than its correlation length the fat percolation cluster appears fractal, on longer length scales it appears homogeneous.
Understanding the RBM universal ac conductivity in terms of percolation arguments is much more challenging. Traditionally rbm ; ac_perc the problem was approached “from the high-frequency side” by proceeding as follows. For (angular) frequencies there is a characteristic activation energy for motion on time scales ; when decreases towards one has . Links with form finite low-activation-energy clusters. The cluster size distribution is assumed to determine the ac conductivity. Some time ago we proposed what amounts to coming “from the low-frequency side,” namely that all relevant motion takes place on some subset of the infinite percolation cluster dca . Numerical evidence for this conjecture is given below, where it is shown that contributions from low-activation energy clusters outside the fat percolating cluster are insignificant. Moreover, it is shown that by assuming that not just a subset, but in fact the entire percolation cluster is important, an excellent analytical approximation to the universal ac conductivity with no nontrivial fitting parameters may be derived.
The simulations of the RBM reported below refer to the Box distribution of activation energies ( for , zero otherwise); ac universality in the extreme disorder limit implies that this distribution gives representative results dca . The lowest temperature simulated is given by where is the inverse dimensionless temperature, . For the jump rates cover more than 130 orders of magnitude, making simulations quite challenging. We used a method based on solving the Laplace transform of the master equation numerically method . Conductivity data for give an excellent representation of the universal master curve for the RBM over the frequency range studied here dca .
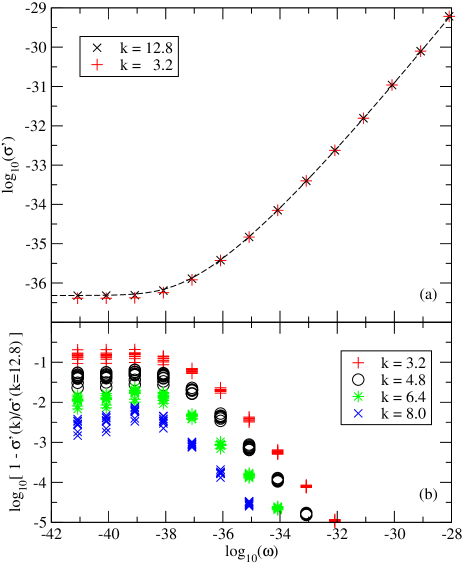
In previously reported simulations dca we applied an activation energy cut-off above the percolation threshold, , where is the percolation energy for the cubic lattice and a numerical constant. Jump rates for links with activation energies larger than were set to zero in order to be able to simulate large samples. Figure 1(a) presents the real part of the ac conductivity for and respectively at . There is little difference between the two data sets. The dashed line gives the prediction of the diffusion cluster approximation (DCA) combined with the Alexander-Orbach conjecture as detailed below (Eq. (2)). Fig. 1(b) gives the relative errors involved for different values, taking as representing the “correct” data. As expected, the errors are largest in the dc regime and decrease with increasing . Choosing gives an error of just 1-2%.
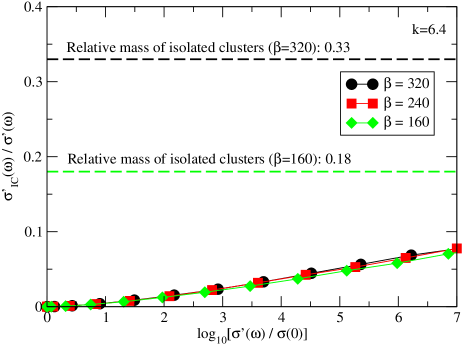
We proceed to investigate the behavior with in more detail. Applying this cut-off, the links with non-zero jump rate fall into two sets, the “fat” percolating cluster and all remaining finite isolated clusters. The latter do not contribute to the dc conductivity. According to the traditional approaches based on cluster statistics, however, they give a significant contribution to the ac conductivity as soon as rbm ; ac_perc . This was never tested numerically. Figure 2 presents the contribution from isolated clusters relative to the full ac conductivity as a function of the real part of the scaled conductivity . The dashed lines mark this relative mass of the isolated clusters for and , respectively. The quantity , however, is much smaller than the relative mass of isolated clusters for the range of frequencies covered in the figure, i.e., up to 10 billion times (compare Fig. 1). Moreover, for the relative mass of isolated clusters goes to one, whereas we find that is independent of temperature and stays insignificant. In summary, the dominant part of the low-temperature universal ac conductivity comes from the fat percolation cluster dca with little contributions from isolated clusters.
We now turn to the issue of analytical approximations utilizing the effective medium approximation (EMA) bru35 ; dyr ; note2 . If where is the probability for a particle to be at a site given it was there at for a homogeneous system with uniform jump rate, the extreme disorder limit of the EMA self-consistency equation is where is a numerical constant dyr . This determines a frequency-dependent complex “effective” jump rate that is proportional to the frequency-dependent conductivity rbm ; dyr . Henceforth we switch to the rationalized unit system dca where the EMA selfconsistent ac conductivity equals the complex effective jump rate. Because is a function of the effective jump rate times time, , the quantity is a function of . In the frequency range relevant for the universal ac conductivity of the extreme disorder limit corresponding to times obeying , one has dyr ; bry80 . If is dimension, whenever as a function of has a regular first order term rbm ; dyr : . If is absorbed into a dimensionless frequency by defining , the EMA universality equation dyr ; bry80 for is
| (1) |
This equation gives a qualitatively correct, but numerically inaccurate fit to simulations dca .
In our previous works it was proposed that some unspecified subset of the percolating cluster with fractal dimension (“the diffusion cluster”) is responsible for the ac conduction dca . If this led to the diffusion cluster approximation (DCA): dca . If the diffusion cluster is the so-called backbone, one expects , if the diffusion cluster is the set of red bonds, one expects dca . Treating as a fitting parameter led to dca , however, leaving the nature of the diffusion cluster as an open problem.
What if not just a subset, but in fact the entire percolating cluster contributes significantly to the universal ac conductivity? Random walks on a fractal structure are characterized by ben00 where is the spectral dimension. For this leads to . In terms of a suitably scaled frequency the EMA thus implies the DCA expression with . According to the Alexander-Orbach conjecture ale82 – known to be almost correct (see, e.g., hug96 ; method ) – one has for the infinite percolating cluster. If frequency is suitably scaled, this leads to the following approximation to the universal ac conductivity of the extreme disorder limit:
| (2) |
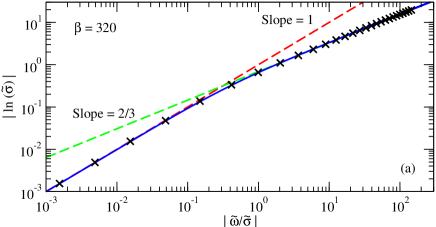
As shown in Fig. 1(a) this expression provides an excellent fit to the universal ac conductivity of the extreme disorder limit note3 . Equation (2) may be put to a more severe test, however, than just fitting the real part of . Figure 3(a) tests one implication of Eq. (2), , by plotting as function of in a log-log plot. A cross-over between two power-law regimes is seen, corresponding to a cross-over between Eqs. (1) and (2). In Fig. 3(b) the apparent exponent is plotted as a function of scaled frequency. Similar results are found by plotting the ratio of the phases of the complex numbers and (data not shown).
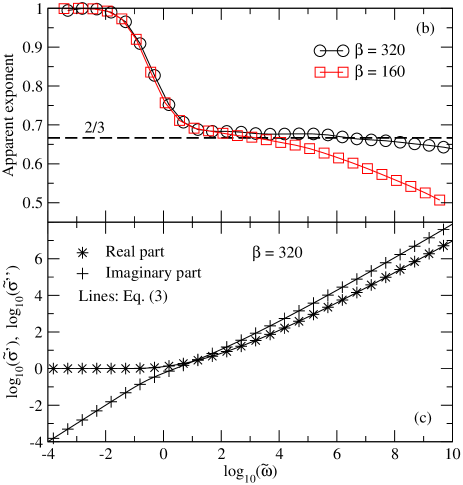
The picture emerging from Figs. 3(a) and (b) is the following: Equation (2) works well whenever ; here the fat percolation cluster appears fractal because over one cycle the particles move less than the correlation length. At low frequencies there is a transition to the analytic behavior predicted when the dimension is larger than two (Eq. (1)); over one cycle the particles here move longer than the correlation length and consequently the fat percolation cluster appears homogeneous.
The entire frequency range is accurately described by the expression
| (3) |
that is plotted as the full lines in Figs. 3(a) and 3(c). The exponent was chosen to get agreement with Eq. (2) for . The difference between Eqs. (2) and (3) is significant only at such low frequencies that is of order unity (Fig. 3(a)). Equation (2) breaks down only for the imaginary part for where Eq. (2) predicts instead of the observed . Numerical solutions of Eqs. (2) and (3) are provided Ref. suppl .
In our opinion, the RBM must now be regarded as solved in the extreme disorder limit in the sense that a good understanding of the model’s physics is at hand, leading to an accurate description of the ac conductivity. A notable consequence of the above is that the EMA – generally believed to be inaccurate except at weak disorder – works surprisingly well in the extreme disorder limit if the “geometrical” input is taken to reflect the fractal geometry of the percolation cluster. It would be interesting to know whether similar results apply when the EMA is applied for the extreme disorder limit of other models.
Acknowledgements.
The centre for viscous liquid dynamics “Glass and Time” is sponsored by the Danish National Research Foundation (DNRF).References
- (1) M. Vogel, C. Brinkmann, H. Eckert, and A. Heuer, Phys. Rev. B 69, 094302 (2004); S. Berndt, K. R. Jeffrey, R. Kuchler, and R. Böhmer, Solid State Nucl. Magn. Ress. 27, 122 (2005); R. Böhmer, K. R. Jeffrey, and M. Vogel, Prog. Nucl. Magn. Reson. Spectr. 50, 87 (2007).
- (2) B. Roling, J. Chem. Phys. 117, 1320 (2002); A. Heuer, S. Murugavel, and B. Roling, Phys. Rev. B 72, 174304 (2005).
- (3) C. Leon, A. Rivera, A. Varez, J. Sanz, J. Santamaria, and K. L. Ngai, Phys. Rev. Lett. 86, 1279 (2001); B. Roling, C. Martiny, and S. Murugavel, Phys. Rev. Lett. 87, 085901 (2001); D. L. Sidebottom and C. M. Murray-Krezan, Phys. Rev. Lett. 89, 195901 (2002).
- (4) A.N. Cormack, J. Du, T.R. Zeitler, Phys. Chem. Chem. Phys. 4, 3193 (2002); H. Lammert, M. Kunow, and A. Heuer, Phys. Rev. Lett. 90, 215901 (2003); J. C. Dyre, J. Non-Cryst. Solids 324, 192 (2003).
- (5) H. Lammert and A. Heuer, Phys. Rev. B 72, 214202 (2005).
- (6) W. Dieterich and P. Maass, Chem. Phys. 284, 439 (2002); M. Schulz, W. Dieterich, and P. Maass, Z. Phys. Chem. - Int. J. Res. Phys. Chem. Chem. Phys. 218, 1375 (2004).
- (7) J. M. Stevels, in Handbuch der Physik, Vol. 20, edited by S. Flügge (Springer, Berlin, 1957), pp. 350; H. E. Taylor, J. Soc. Glass technol. 41, 350T (1957); B. I. Shklovskii and A. L. Efros, Electronic Properties of Doped Semiconductors (Springer, Berlin, 1984); H. Böttger V. V. Bryksin, Hopping Conduction in Solids (Akademie, Berlin, 1985); J. W. Haus and K. W. Kehr, Phys. Rep. 150, 263 (1987); J.-P. Bouchaud and A. Georges, Phys. Rep. 195, 127 (1990); M. P. J. van Staveren, H. B. Brom, and L. J. de Jongh, Phys. Rep. 208, 1 (1991); Charge Transport in Disordered Solids, Edited by S. Baranovski (Wiley, New York, 2006).
- (8) J. C. Dyre and T. B. Schrøder, Rev. Mod. Phys. 72, 873 (2000); T. B. Schrøder and J. C. Dyre, Phys. Rev. Lett. 84, 310 (2000); J. C. Dyre and T. B. Schrøder, Phys. Stat. Sol. (b) 230, 5 (2002); T. B. Schrøder and J. C. Dyre, Phys. Chem. Chem. Phys. 4, 3173 (2002).
- (9) J. O. Isard, J. Non-Cryst. Solids 4, 357 (1970); H. Namikawa, J. Non-Cryst. Solids 18, 173 (1975); A. K. Jonscher, Nature 267, 673 (1977); A. E. Owen, J. Non-Cryst. Solids 25, 370 (1977); A. Mansingh, Bull. Mater. Sci. (India) 2, 325 (1980); S. Summerfield, Philos. Mag. B 52, 9 (1985).
- (10) J. C. Dyre, J. Appl. Phys. 64, 2456 (1988); J. C. Dyre, Phys. Rev. B 49, 11709 (1994).
- (11) M. Porto, P. Maass, M. Meyer, A. Bunde, and W. Dieterich, Phys. Rev. B 61, 6057 (2000); O. Bleibaum, H. Böttger, and V. V. Bryksin, J. Phys. Condens. Matter 15, 1719 (2003); M. Sahimi, M. Naderian, and F. Ebrahimi, Phys. Rev. B 71, 094208 (2005); W. F. Pasveer, P. A. Bobbert, and M. A. J. Michels, Phys. Rev. B 74, 165209 (2006); E. Pazhoohesh, H. Hamzehpour, and M. Sahimi, Phys. Rev. B 73, 174206 (2006); T. Ishii, and E. Matsumoto, J. Phys. Soc. Japan 76, 024606 (2007).
- (12) V. Ambegaokar, B. I. Halperin, and J. S. Langer, Phys. Rev. B 4, 2612 (1971); B. I. Shklovskii and A. L. Efros, Zh. Eksp. Teor. Fiz. 60, 867 (1971) [Sov. Phys. JETP 33, 468 (1971)]; S. Tyc and B. I. Halperin, Phys. Rev. B 39, 877 (1989).
- (13) H. Böttger, V. V. Bryksin, and G. Y. Yashin, J. Phys. C 12, 3951 (1979); I. P. Zvyagin, Phys. Status Solidi B 97, 143 (1980); S. D. Baranovskii and H. Cordes, J. Chem. Phys. 111, 7546 (1999); A. G. Hunt, Philos. Mag. B 81, 875 (2001).
- (14) T. B. Schrøder, Europhys. Lett. 81, 30002 (2008).
- (15) D. A. B. Brüggeman, Ann. Phys. (Leipzig) 24, 636 (1935).
- (16) In Ref. dyr we wrote for what is here denoted . This reserves the use of tildes to dimensionless quantities.
- (17) V. V. Bryksin, Fiz. Tverd. Tela (Leningrad) 22, 2441 (1980) [Sov. Phys. Solid State 22, 1421 (1980)].
- (18) D. Ben-Avraham and S. Havlin, Diffusion and Reactions in Fractals and Disordered Systems (Cambridge University Press, Cambridge, England, 2000).
- (19) S. Alexander and R. Orbach, J. Phys. (Paris) Lett. 43, L625 (1982).
- (20) B.D. Hughes, Random Walks and Random Enviroments, (Oxford Science Publications, 1996).
- (21) Equation (2) implies that the real part of the ac conductivity a few decades above has an approximate power-law frequency depedence with exponents in the range 0.6-0.7, thus close to (compare Fig. 1) and consistent with experiment. It is important to note that this is not related to the exponent appearing in Eq. (2); for instance Eq. (1) has the same mathematical property.
- (22) See EPAPS Document No. [number will be inserted by publisher] for [give brief description of material]. For more information on EPAPS, see http://www.aip.org/pubservs/epaps.html. See EPAPS Document No. … .