DOT Tomography of the Solar Atmosphere
VII. Chromospheric Response to Acoustic Events
Abstract
We use synchronous movies from the Dutch Open Telescope sampling the G band, Ca ii H, and H with five-wavelength profile sampling to study the response of the chromosphere to acoustic events in the underlying photosphere. We first compare the visibility of the chromosphere in Ca ii H and H , demonstrate that studying the chromosphere requires H data, and summarize recent developments in understanding why this is so. We construct divergence and vorticity maps of the photospheric flow field from the G-band images and locate specific events through the appearance of bright Ca ii H grains. The reaction of the H chromosphere is diagnosed in terms of brightness and Doppler shift. We show and discuss three particular cases in detail: a regular acoustic grain marking shock excitation by granular dynamics, a persistent flasher which probably marks magnetic-field concentration, and an exploding granule. All three appear to buffet overlying fibrils, most clearly in Dopplergrams. Although our diagnostic displays to dissect these phenomena are unprecedentedly comprehensive, adding even more information (photospheric Doppler tomography and magnetograms, chromospheric imaging and Doppler mapping in the ultraviolet) is warranted.
keywords:
Chromosphere, Granulation, Oscillations, Waves1 Introduction
“Acoustic events” (or “seismic events”) is the term used by P. Goode and coworkers (\opencite1987SoPh..110..237S; \opencite1992ApJ…387..707G; \opencite1993ApJ…408L..57R; \opencite1995ApJ…444L.119R; \opencite1998ApJ…495L..27G; \opencite2000ApJ…535.1000S) to describe localized small-scale happenings in the granulation that produce excessive amounts of upward-propagating acoustic waves in the upper photosphere, with the claim that these indicate the kinetic sources of the global -modes, “the smoke from the fire exciting the solar oscillations” (\opencite1995STIN…9610005G). Their technique was to sample the Doppler modulation of a suitable spectral line at different profile heights through Fabry-Perot imaging with rapid wavelength shifting, and then isolate the surface locations with the largest oscillatory amplitude at five-minute periodicity and upward propagating phase. Their result was that this measure of “acoustic flux” tends to be maximum above intergranular lanes, in particular those in which a small granule has vanished in so-called granular collapse.
Acoustic excitation through granular dynamics was also addressed theoretically and through numerical hydrodynamics simulations by Rast (1995, 1999), Skartlien and Rast (2000) and Skartlien, Stein, and Nordlund (2000), confirming the picture of small vanishing granules, especially at mesogranular downdraft boundaries, acting as “collapsars” to excite upward-propagating waves, in particular at three-minute periodicity corresponding to the photospheric acoustic cut-off frequency.
In this paper we address the reaction of the overlying chromosphere to such events. Skartlien, Stein, and Nordlund (2000) suggested that they may also cause Ca ii H2V and K2V cell grains, an enigma during many decades (see review by Rutten and Uitenbroek (1991)) that was eventually solved by Carlsson and Stein (1994, 1997) who identified them as marking upward-propagating acoustic shocks. The announcement by Goode (2002) that indeed acoustic events cause such acoustic grains in the chromosphere was followed up by Hoekzema, Rimmele, and Rutten (2002) who found that, while extreme acoustic events do tend to correlate with the subsequent appearance of exceptionally bright Ca ii K2V internetwork grains, this correspondence is far from a one-to-one correlation.
We now turn to H rather than H and K as diagnostic of the chromospheric response to acoustic events. It is important to note and to explain that H is a much better chromospheric diagnostic than the Ca ii H and K lines are. This is not the case for simple Saha-Boltzmann LTE partitioning in which H and K have larger opacity than H throughout the atmosphere (see Figure 6 of Leenaarts et al. (2006) and the second student exercise at http://www.astro.uu.nl/~rutten/education/rjr-material/ssa), and it is also not the case in the standard NLTE statistical and hydrostatic equilibrium VAL modeling of Vernazza, Avrett, and Loeser (1973, 1976, 1981) in which the line center of Ca ii K is formed higher than the line center of H (see the celebrated Figure 1 of Vernazza, Avrett, and Loeser (1981)). We use displays from older data here to argue that the real Sun does not conform.
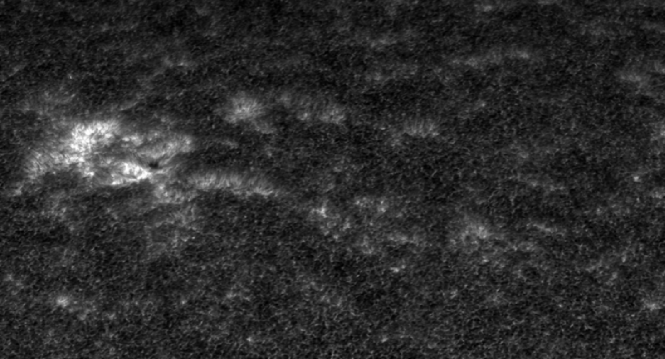
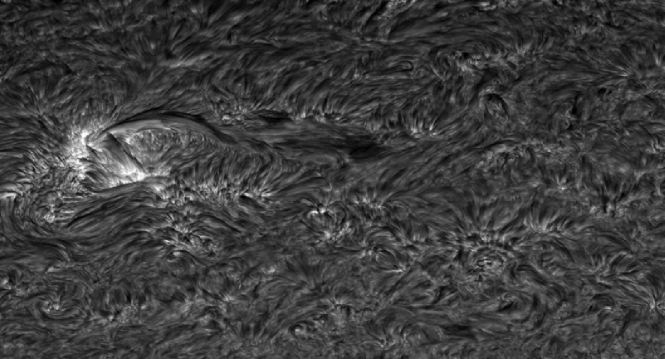
Figure 1 compares Dutch Open Telescope (DOT) images using the two diagnostics. The upper image is taken in Ca II H and shows a mixture of mid- and upper-photospheric contributions (reversed granulation and acoustic grains) and chromospheric contributions (bright plage, network, and straws in hedge rows as described by Rutten (2007)). The lower panel shows the same area observed in H line center. Comparison of the two demonstrates unequivocally that in such filter imaging H presents a much more complete picture of the chromosphere. In our opinion, the chromosphere is best defined as the collective of ubiquitous fibrils seen in this line. Most of these are internetwork-spanning structures, which probably outline magnetic canopies. Only truly quiet internetwork areas (there are some in the lower part of the image) are not masked off by such canopy fibrils but show much shorter, highly dynamic loops and grainy brightness patterns that are not connected to network (see also Rouppe van der Voort et al. (2007)). None of these structures is observed in the upper panel, except for the straws which correspond to bright H fibril endings.
What about the spectral passbands in this comparison? The Doppler cores of H and K are much narrower than for H , but H and K filter bandpasses are usually wider: FWHM 3 Å for Hinode, 1.4 Å for the DOT, 0.6 Å for the Lyot filter at the German VTT (e.g., Tritschler et al. (2007)), 0.3 Å for the Lockheed-Martin filter at the former SVST (Brandt et al. (1992); Lites, Rutten, and Berger (1999)), and also 0.3 Å for the Halle filter at the NSO/SP/DST (e.g., Bloomfield et al. (2004), who assigned propagation speeds and mode conversions to chromospheric oscillations naively adopting the VAL3C line-center height difference). Such H and K filter imaging adds considerable inner-wing contributions from the upper photosphere, including bright reversed granulation and yet brighter acoustic grains which may wash out the line-center-only contribution from chromospheric fibrils in the internetwork except where these are very bright, as in straws. The narrowest-band images with high spatial resolution published so far are R.A. Shine’s 0.3 Å ones in Lites, Rutten, and Berger (1999), which only show reversed granulation and acoustic grains in the internetwork. Narrow-band K3 spectroheliograms as the 0.1 Å ones in the collection of Title (1966) have lower angular resolution but do not suggest the presence of similar masses of internetwork Ca ii K fibrils as seen in H at similar resolution, except near active network and plage.
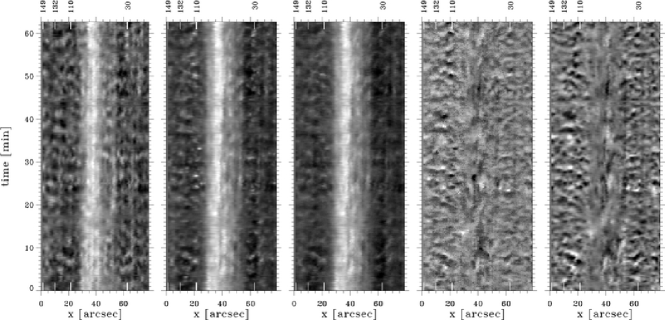
Figure 2 extends the Ca ii H passband comparisons in Figure 1 of Rutten, De Pontieu, and Lites (1999) and Figure 9 of Krijger et al. (2001) with additional spectral measures from the ancient but high-quality Ca ii H spectrogram sequence of Lites, Rutten, and Kalkofen (1993) also used by Carlsson and Stein (1997). The first three panels show that narrower Ca ii H passband produces larger network-to-internetwork brightness contrast, but does not significantly change the morphology of the observed scene. The oscillation patterns in the internetwork, brightest at H2V, remain visible even in the line-core intensity in the third panel. The line-core shift in the fourth panel confirms the acoustic nature of these patterns. Thus, even at full spectral resolution the Ca ii H core in this internetwork sample is dominated by radial three-minute waves, without obliteration by overlying fibrils or fibril-aligned motions. The final panel showing the H2RH2V Dopplergram ratio strengthens this conclusion. This measure comes closest to exhibiting chromospheric fibrilar structure in the form of oscillatory branches jutting out from the network with time, but regular three-minute oscillation patterns dominate further away in the internetwork.
The lower-left panel of Figure 21 of Krijger et al. (2001) demonstrated the close correspondence between Ca ii H line-center dynamics and underlying photospheric dynamics in the internetwork parts of these spectrograms in Fourier terms. In fact, it should be strange if the line-center formation layer would not fully partake in the shock dynamics in these data because substantial in-phase upper-atmosphere downdraft, above the next upcoming grain-causing acoustic shock, is required to give the H2V and K2V grains their characteristic spectral asymmetry as shown in the formation breakdown diagrams of Carlsson and Stein (1997). They actually obtained their best sequence reproduction for near-network column 110 in Figure 2, suggesting that even there the field was too weak to upset H3 acoustic shock signatures.
Thus, these well-studied Ca ii H spectrograms contradict the presence of opaque chromospheric fibrils masking upper-photosphere (or “clapotispheric”) internetwork dynamics in H and K, whereas H canopy fibrils ubiquitously do so. The notion that the Ca ii core generally forms higher than the H core, or that chromospheric structures should generally be more opaque in H and K than in H , seems questionable. The observations suggest instead that the fibrils that constitute the H chromosphere are either transparent in H and K or, when opaque, are either pummeled by shocks from below without hindrance (such as magnetic tension) or represent a featureless, very dark blanket located well above the clapotisphere.
In summary, we suspect that much of the K3 internetwork dynamics is dominated by shock modulation at heights around 1000 km, well below the VAL3C K3 formation height of 1800 – 2000 km and far below most H canopy fibrils.
This large discrepancy with equilibrium modeling may become understandable with the recent simulation of Leenaarts et al. (2007) implementing non-instantaneous hydrogen ionization and recombination. Three aspects combine in such an explanation. Firstly, the simulated chromosphere is pervaded by shocks. Secondly, the large difference between hydrogen ionization/recombination balancing speed in hot shocks and in cool post-shock gas implies that instantaneous statistical equilibrium does not apply to the latter. Carlsson and Stein (2002) already explained why this is so. The large 10 eV excitation energy of its level causes hydrogen to be ionized fast in shocks but to recombine slowly in the cool inter-shock phases so that the ionization degree remains high also in the latter. Thirdly, the population of H ’s lower level is closely coupled to the ion population (through the Balmer continuum; see also Rutten and Carlsson (1994)) and therefore remains similarly high at low post-shock temperature. Thus, the large excitation energy, being the very reason why H has very small cool-gas opacity in Boltzmann balancing, slows down the hydrogen recombination in post-shock cool gas so much that its H opacity exceeds the LTE value by many orders of magnitude. Therefore, fibrils can be opaque in H whether they are shock-hot or post-shock cool, and they even may be more opaque in H than in H and K at any temperature – in utter conflict with equilibrium modeling.
The chromospheric non-equilibrium balancing between Ca ii (12 eV ionization energy) and Ca iii is probably faster (no top-heavy term diagram) but has not yet been analyzed in similar detail; it is of interest to evaluate the opacity ratio between H and K and H in dynamic conditions. Another point of interest is that chromospheric fibrils seem to be more obvious in Ca ii 8542 Å than in H3 and K3, possibly due to larger Doppler sensitivity (Cauzzi et al. (2007)).
Thus, H is the key diagnostic of the internetwork chromosphere. Recent analyses of the chromosphere observed at high cadence in H line-center with the Swedish 1-m Solar Telescope (SST) have shed new light on chromospheric fibrils, showing that near network and plage “dynamic fibrils” tend to have repetitive mass loading at three – five-minute shock periodicity (De Pontieu et al. (2007)) whereas the little loops in quiet-sun internetwork are even more dynamic, presumably due to stronger buffeting by shocks where the magnetic field is weak (Rouppe van der Voort et al. (2007)).
In this paper we use image sequences from the Dutch Open Telescope (DOT) with lower cadence than H really requires (van Noort and Rouppe van der Voort (2006)), but with H profile sampling and synchronous co-spatial imaging in other wavelengths including Ca ii H. They permit us to isolate specific events in the photosphere and inspect the chromospheric response in the apparent brightness of Ca ii H and H , and particularly in H Doppler modulation. We do this here by presenting three exemplary cases: an acoustic grain, a persistent flasher, and an exploding granule.
2 Observations and Reduction
The image sequences used here were obtained with the Dutch Open Telescope (DOT) on La Palma on 14 October 2005 during 10:15:43 – 10:30:42 UT. The telescope, instrumentation, and data processing are described by Rutten et al. (2004).
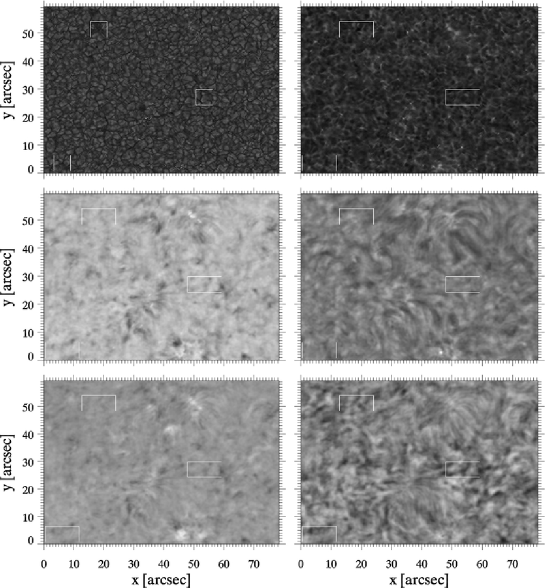
Synchronous and co-spatial images were taken in blue and red continuum passbands, the G band around 4305 Å, Ca ii H alternatingly at line center and at Å, and at five H wavelengths: line center, the H 350 mÅ inner-wing pair, and the H 700 mÅ outer-wing pair. The seeing had mean Fried parameter cm for the G band, just about good enough that the standard DOT speckle reconstruction produced angular resolution close to the diffraction limit of the 45-cm aperture (0.2 arcsec in the blue). The field of view measured arcsec2 ( Mm2), covering a very quiet area at disk center containing only few and sparse weak-network clusters of magnetic elements (bright points in the G band, bright grain clusters in Ca ii H) as evidenced by the first two sample images in Figure 3. This area was sufficiently quiet that H shows only short, highly dynamic fibrils concentrated around the magnetic clusters.
The image sequences had slightly irregular cadence and were interpolated to 30-image sequences at strict 30-second cadence. The G-band images were subsonically Fourier-filtered in () space, passing only components with apparent motion below the sound speed of 7 km s-1 to remove the brightness modulation due to the -mode oscillations since in this study granular dynamics is emphasized as pistoning agent. Horizontal flows were measured using the cross-correlation tracking algorithm of November (1986) and November and Simon (1988), using Gaussian FWHM widths of 1.5 arcsec and 330 seconds as boxcar averaging parameters. Differences between neighboring pixels were used to evaluate derivatives to determine the local horizontal divergence and vorticity in the flows.
The H sequences were also cone-filtered in () space but in this case reversely, only passing the supersonic components because here the oscillatory response of the chromosphere is of interest. Our intention was to remove stable fibrils in order to enhance the visibility of oscillatory modulations such as spreading rings, but in this very quiet area the fibrils are so dynamic that the differences between the filtered and unfiltered sequences are small. Finally, H Dopplergrams were constructed from the filtered H 700 mÅ and H 350 mÅ image pairs.
We used a live multi-panel on-screen display similar to Figures 4 – 6 to inspect the various diagnostics simultaneously and in mutual correspondence at large local magnification, varying both the location and time coordinates of the point of scrutiny within these image sequences. The three cases discussed below have been selected in this subjective manner as being the most informative – they are not “typical” but “best” examples. However, since the field of view and the sequence duration were small, they are nevertheless indicative of common occurrences on the solar surface. Automation of such a vision-based selection process for larger data sets is nontrivial.
Figure 3 shows that all three examples lie in pure internetwork without magnetic elements and with grainy rather than fibrilar H fine structure. They sample the thinnest and lowest sort of H chromosphere.
3 Acoustic Grains
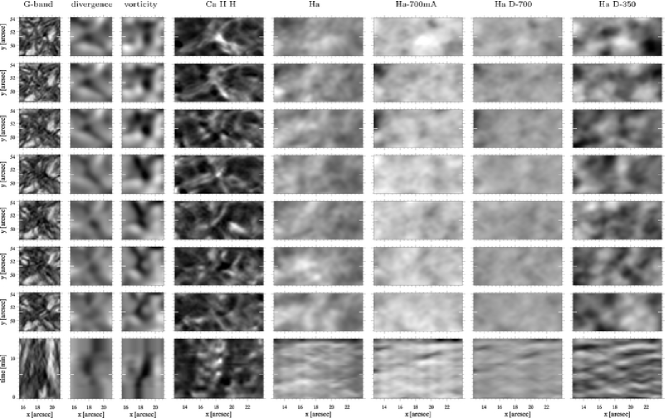
Figure 4 shows the appearance of a regular Ca ii H2V “grain train.” The caption specifies the complex figure layout which also holds for Figures 5 and 6. The cutout image sequences (time increasing upward in compliance with the timeslices at the bottom) are centered on the sudden appearance of a Ca ii H grain (fourth row, fourth column). It re-appeared three and six minutes later, marking a regular H2V shock sequence much like the triple grain occurrence at the top of column 30 in the first panel of Figure 2, shown also in Figures 9 and 10 of Krijger et al. (2001) and Fourier-analyzed there in detail, noting that such clear three-minute periodicity requires absence of large five-minutes modulation but spatial coincidence with the slower-evolving reversed-granulation background pattern. The latter was subsequently analyzed by Rutten, De Wijn, and Sütterlin (2004), Leenaarts and Wedemeyer-Böhm (2005), and Cheung, Schüssler, and Moreno-Insertis (2007). Such spatial coincidence is indeed seen to be the case in the Ca ii H cutouts and timeslice in Figure 4. (Note that reversed granulation is not seen in H which has insufficient opacity in the middle photosphere.) These three grains undoubtedly mark acoustic shocks as the ones simulated by Carlsson and Stein (1997) including the column-30 ones of Figure 2 (their Figure 17, Plate 21).
Do these Ca ii H grains mark an acoustic event? If so, one expects that a small granular feature disappeared about two minutes before the grain train onset. The corresponding area does show an intergranular space in the wake of a bright granule that split apart and disappeared five – two minutes earlier (G-band timeslice, not fully covered by the cutout sequence). Before the grain appeared there was weak divergence meeting weak convergence at the splitting-granule site, eventually followed by stronger convergence which bordered marked vorticity (dark blobs in the upper panels of the second and third columns) which earlier was located in the lane besides the splitting granule (third timeslice). Together, the photospheric diagnostics suggest that these grains mark acoustic excitation by a small whirlpool downdraft.
What happened in the overlying chromosphere? This subfield is located, as are the other two, in quiet internetwork without clear H fibrils. The H line-center column shows nothing special at the grain location. The top H - 700 mÅ panel shows marked brightening there, followed within two minutes by yet stronger darkening (seen the timeslice, which extends longer). The same pattern appears in the H 700 mÅ Doppler timeslice so this dark-after-bright pattern is mostly Doppler modulation, shifting the line out and into the passband. Due to the curvature of the line profile such Doppler darkening tends to be stronger than counter-phase brightening, as is the case here. The same bright-dark pair is also recognizable in the H 350 mÅ timeslice, more clearly preceded by another, smaller bright-dark pair at the grain location, and with apparent connectivity to longer features towards the top of the timeslice (beyond the top cutout images), extending over four to five arcseconds. Comparison with the H 700 mÅ timeslice shows that these are weakly present there as well. Their extent might suggest wide wave spreading with height, but the Dopplergram cutouts do not show corresponding rings around the grain location. Either the spreading wave ran into a finely structured atmosphere, or made already-existing H fibrils shake over extended lengths through shock buffeting. If so, these fibrils are not very distinct in H line center (also not in the unfiltered images) and obtain their clearest mark of presence through Doppler modulation.
Note that the simultaneous appearance of the second Ca ii H grain and the marked H - 700 mÅ downdraft in the top row fits the scenario for spectrally asymmetric grain formation of Carlsson and Stein (1997). Comparison of the Ca ii H and H 350 mÅ timeslices confirms that all three Ca ii H grains indeed had concurrent chromospheric downdrafts.
4 Persistent Flasher
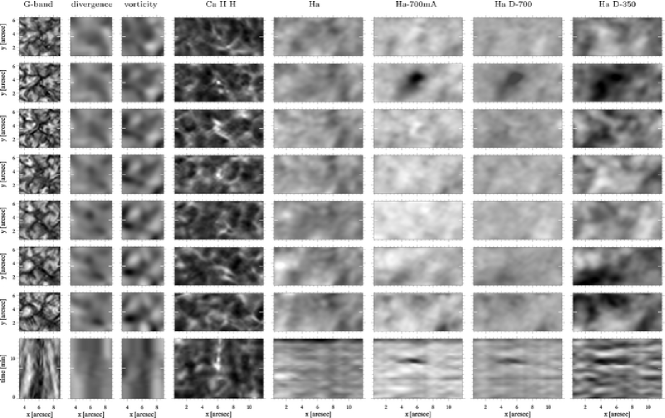
Figure 5 is again centered on the first appearance of a bright repetitive Ca ii H grain, but this one had continuous brightness underlying its repeated brightening and was accompanied by a small bright point in the G-band images and timeslice. This behavior suggests that it was a “persistent flasher” marking the presence of a small internetwork magnetic flux concentration (Brandt et al. 1992, 1994). These are more easily located in Ca ii H image sequences than as G-band bright points and tend to come and go in the form of intermittent “magnetic patches”, showing up as bright grains when squeezed together and vanishing when their concentration becomes less dense as imposed by the granular flows advecting their field (De Wijn et al. (2005)). Neither the Ca ii H flasher nor the G-band bright point is seen in the bottom half of the timeslices, indicating that the concentration was initially more spread-out. The second timeslice indeed shows persistent convergence which is already evident from the squeezing together of the large granules in the first timeslice. The largest convergence is in the neighboring lanes, up to the bright-point appearance (lower cutouts in the second column). Another speculation might be the incidence of fluxtube collapse, but the convergence should then maximize at the bright-point site.
The chromosphere shows marked response in the H - 700 mÅ and Doppler columns: a dark blob in the second row which again is seen to result from an up-down dark-bright Doppler stroke in the timeslices, most clearly in the H 350 mÅ Doppler slice in the last column (partially mimicked at lower contrast by the H line-center intensity in the fifth slice), but in this case preceded by a brief bright downstroke. The size of the oscillatory blob is much larger than the Ca ii H grains, especially in the second row, again suggesting response by extended fibrilar structures. The second row also indicates strong updraft above the (very sharp) Ca ii H grain, suggesting another mechanism than acoustic H2V grain formation. Fibril loading from the granular squeezing seen in the first timeslice, sending gas upward along the field concentration indicated by the Ca ii H flasher, may occur here following the scenario suggested by Babcock and Babcock (1955).
5 Exploding Granule
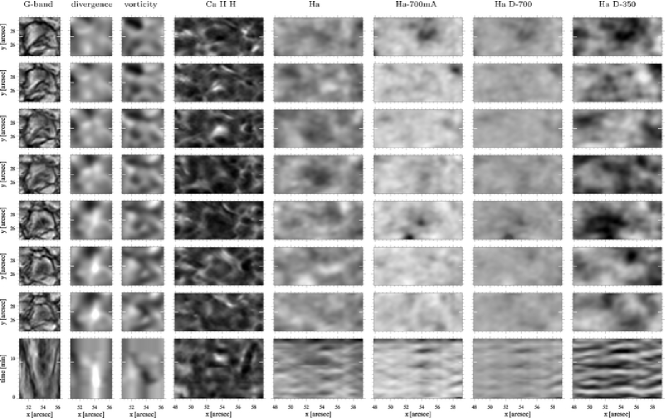
Our third example in Figure 6 concerns an exploding granule to assess the suggestion of Rast (1995) that such features may act as acoustic sources. The cutout sequences are centered on the moment at which the marked divergence in the second timeslice ends. The granule had already a large dark center and was about to become three small granules with some shards in between. A minute later, the Ca ii H line became very bright at that location, and after two more minutes very dark (top row). The same dark blob is seen along the top row in the H wing columns, implying large updraft. The H 350 mÅ Doppler timeslice in the last panel again shows much more spatially extended oscillatory behavior than the other diagnostics, suggesting fibril buffeting. The H line-center intensity timeslice again mimics the Doppler behavior partially. The exploding granule seems to cause oscillation amplitude increase above it which modulates the H core intensity.
6 Discussion
Each example shows large morphological difference between the low-photosphere scene in the G-band, the high-photosphere scene in Ca ii H, and the chromospheric scene in H . The H cutouts do not contain internetwork-spanning fibrils in this quiet region; each of the three events therefore shows chromospheric response that would otherwise have been blocked by overlying canopy fibrils. The responses are not very striking; in no case may one locate the photospheric happening uniquely from its subsequent H signature.
The H chromosphere sampled by the image cutouts comes close to our tentative description above of the Ca ii H3 and K3 internetwork chromosphere as a featureless opaque blanket pummeled from below. They may indeed be about the same, as suggested by the H downdrafts in Figure 4 above grains requiring H3 downdraft for H2V profile asymmetry. The much smaller temperature sensitivity of the H and K opacity then indeed diminishes the H and K feature contrast. Thanks to being an excited and narrower line, Ca II 8542 combines larger temperature and Doppler sensitivity to such pummeling but at smaller blanket opacity.
Fibrilar structuring appears most clearly in the H Dopplergram timeslices. Our impression is that indeed this quiet H chromosphere is continuously pummeled by internetwork waves, gaining much dynamics from these in the quietest areas where the magnetic fields have low tension but yet enough to impose slight fibrilarity. We suspect that slanted internal gravity waves contribute significantly in this pummeling (see Lighthill 1967, pp. 440 – 443), and together with the primarily vertically growing acoustic shocks cause intricate and fast-changing interference patterns at granular to mesogranular scales. Only the fiercest events punch through to be individually recognizable directly above their sources.
Our three examples whet the appetite for even more comprehensive multi-diagnostic solar-atmosphere tomography. The complexity of the panel layout in Figures 4 – 6 already demonstrates that the dynamical coupling between photosphere and chromosphere can only be addressed holistically with diverse diagnostics. The complexity of the solar scenes shown in these panels and their large differences between diagnostics strengthen this conclusion. In fact, our data is yet incomplete: we lack the principal acoustic-event measure of “acoustic flux” in this analysis, requiring Fabry-Perot Doppler mapping of the photosphere at multiple heights. Sensitive photospheric magnetic field mapping and ultraviolet chromospheric image and Doppler diagnostics would also be welcome – preferably all at similar or better angular resolution, cadence, duration, and field size than used here.
In this paper we have limited the discussion to three hand-picked cases from an early set of tomographic DOT image sequences. The large DOT database collected in the meantime (openly available at http://dotdb.phys.uu.nl/DOT) now permits wider statistical study of such various types of events. Rapid-cadence Fabry-Perot imaging at the SST promises unprecedented H diagnostics. Space-mission co-pointing adds EUV diagnostics of the transition region. Pertinent numerical simulations including realistic formation of H are also coming into reach.
Acknowledgements
The DOT is owned by Utrecht University and located at the Spanish Observatorio del Roque de los Muchachos of the Instituto de Astrofísica de Canarias. We are deeply indebted to V. Gaizauskas concerning the DOT H filter. We thank M. Carlsson, Ø. Langangen, S.E.M. Keek, J.M.D. Kruijssen and A.G. de Wijn for inspiring debates. This research made much use of SST hospitality and of NASA’s Astrophysics Data System. R.J. Rutten thanks the Leids Kerkhoven-Bosscha Fonds and the organizers of the SOHO 19/GONG 2007 meeting for travel support.
References
- Babcock and Babcock (1955) Babcock, H.W., Babcock, H.D.: 1955, ApJ 121, 349.
- Bloomfield et al. (2004) Bloomfield, D.S., McAteer, R.T.J., Mathioudakis, M., Williams, D.R., Keenan, F.P.: 2004, ApJ 604, 936.
- Brandt et al. (1994) Brandt, P.N., Rutten, R.J., Shine, R.A., Trujillo Bueno, J.: 1994, In: Rutten, R.J., Schrijver, C.J. (eds.) Solar Surface Magnetism. NATO ASI Series C 433 Kluwer, Dordrecht, 251.
- Brandt et al. (1992) Brandt, P.N., Rutten, R.J., Shine, R.A., Trujillo Bueno, J.: 1992, In: Giampapa, M.S., Bookbinder, J.A. (eds.) Cool Stars, Stellar Systems, and the Sun. Proc. Seventh Cambridge Workshop, Astron. Soc. Pacific Conf. Series 26, 161.
- Carlsson and Stein (1994) Carlsson, M., Stein, R.F.: 1994, In: Carlsson, M. (ed.) Chromospheric Dynamics. Proc. Miniworkshop, Inst. Theor. Astrophys., Oslo, 47.
- Carlsson and Stein (1997) Carlsson, M., Stein, R.F.: 1997, ApJ 481, 500.
- Carlsson and Stein (2002) Carlsson, M., Stein, R.F.: 2002, ApJ 572, 626.
- Cauzzi et al. (2007) Cauzzi G., Reardon K.P., Uitenbroek H., Cavallini F., Falchi A., Falciani R., Janssen K., Rimmele T., Vecchio A., Woeger F.: 2007, http://arxiv.org/abs/0709.2417, submitted to A&A
- Cheung, Schüssler, and Moreno-Insertis (2007) Cheung, M.C.M., Schüssler, M., Moreno-Insertis, F.: 2007, A&A 461, 1163.
- De Pontieu et al. (2007) De Pontieu, B., Hansteen, V.H., Rouppe van der Voort, L., van Noort, M., Carlsson, M.: 2007, ApJ 655, 624.
- De Wijn et al. (2005) De Wijn, A.G., Rutten, R.J., Haverkamp, E.M.W.P., Sütterlin, P.: 2005, A&A 441, 1183.
- Goode (1995) Goode, P.: 1995, NASA STI/Recon Technical Report N 96, 10005.
- Goode (2002) Goode P.R.: 2002, Bull. Amer. Astron. Soc. 34, 730.
- Goode, Gough, and Kosovichev (1992) Goode, P.R., Gough, D., Kosovichev, A.G.: 1992, ApJ 387, 707.
- Goode et al. (1998) Goode, P.R., Strous, L.H., Rimmele, T.R., Stebbins, R.T.: 1998, ApJ 495, L27.
- Hoekzema, Rimmele, and Rutten (2002) Hoekzema, N.M., Rimmele, T.R., Rutten, R.J.: 2002, A&A 390, 681.
- Krijger et al. (2001) Krijger, J.M., Rutten, R.J., Lites, B.W., Straus, T., Shine, R.A., Tarbell, T.D.: 2001, A&A 379, 1052.
- Leenaarts et al. (2007) Leenaarts, J., Carlsson, M., Hansteen, V., Rutten, R.J.: 2007, A&A 473, 625.
- Leenaarts et al. (2006) Leenaarts, J., Rutten, R.J., Sütterlin, P., Carlsson, M., Uitenbroek, H.: 2006, A&A 449, 1209.
- Leenaarts and Wedemeyer-Böhm (2005) Leenaarts, J., Wedemeyer-Böhm, S.: 2005, A&A 431, 687.
- Lighthill (1967) Lighthill, M.J.: 1967, In: Thomas, R.N. (ed.) Aerodynamical Phenomena in Stellar Atmospheres. IAU Symp. 28, Academic Press, New York, 429.
- Lites, Rutten, and Berger (1999) Lites, B.W., Rutten, R.J., Berger, T.E.: 1999, ApJ 517, 1013.
- Lites, Rutten, and Kalkofen (1993) Lites, B.W., Rutten, R.J., Kalkofen, W.: 1993, ApJ 414, 345.
- November (1986) November, L.J.: 1986, Appl. Opt. 25, 392.
- November and Simon (1988) November, L.J., Simon, G.W.: 1988, ApJ 333, 427.
- Rast (1995) Rast, M.P.: 1995, ApJ 443, 863.
- Rast (1999) Rast, M.P.: 1999, ApJ 524, 462.
- Restaino, Stebbins, and Goode (1993) Restaino, S.R., Stebbins, R.T., Goode, P.R.: 1993, ApJ 408, L57.
- Rimmele et al. (1995) Rimmele, T.R., Goode, P.R., Harold, E., Stebbins, R.T.: 1995, ApJ 444, L119.
- Rouppe van der Voort et al. (2007) Rouppe van der Voort, L.H.M., De Pontieu, B., Hansteen, V.H., Carlsson, M., van Noort, M.: 2007, ApJ 660, L169.
- Rutten (2007) Rutten R.J.: 2007, In: Heinzel, P., Dorotovič, I., Rutten, R.J. (eds.) The Physics of Chromospheric Plasmas, Astron. Soc. Pacific Conf. Series 368, 27.
- Rutten and Carlsson (1994) Rutten R.J., Carlsson M.: 1994, In: Rabin, D.M., Jefferies, J.T., Lindsey, C. (eds.) Infrared Solar Physics, IAU Symposium 154, Kluwer, Dordrecht, 309.
- Rutten, De Pontieu, and Lites (1999) Rutten R.J., De Pontieu B., Lites B.: 1999, In: Rimmele, T.R., Balasubramaniam, K.S., Radick, R.R. (eds.) High Resolution Solar Physics: Theory, Observations, and Techniques, Astron. Soc. Pacific Conf. Series 183, 383.
- Rutten, De Wijn, and Sütterlin (2004) Rutten, R.J., De Wijn, A.G., Sütterlin, P.: 2004, A&A 416, 333.
- Rutten et al. (2004) Rutten, R.J., Hammerschlag, R.H., Bettonvil, F.C.M., Sütterlin, P., De Wijn, A.G.: 2004, A&A 413, 1183.
- Rutten and Uitenbroek (1991) Rutten, R.J., Uitenbroek, H.: 1991, Sol. Phys. 134, 15.
- Skartlien and Rast (2000) Skartlien, R., Rast, M.P.: 2000, ApJ 535, 464.
- Skartlien, Stein, and Nordlund (2000) Skartlien, R., Stein, R.F., Nordlund, Å.: 2000, ApJ 541, 468.
- Stebbins and Goode (1987) Stebbins, R., Goode, P.R.: 1987, Sol. Phys. 110, 237.
- Strous, Goode, and Rimmele (2000) Strous, L.H., Goode, P.R., Rimmele, T.R.: 2000, ApJ 535, 1000.
- Title (1966) Title A.M.: 1966, Selected spectroheliograms, Mount Wilson and Palomar Observatories, Pasadena.
- Tritschler et al. (2007) Tritschler, A., Schmidt, W., Uitenbroek, H., Wedemeyer-Böhm, S.: 2007, A&A 462, 303.
- van Noort and Rouppe van der Voort (2006) van Noort, M.J., Rouppe van der Voort, L.H.M.: 2006, ApJ 648, L67.
- Vernazza, Avrett, and Loeser (1976) Vernazza, J.E., Avrett, E.H., Loeser, R.: 1976, Astrophys. J. Suppl. Ser. 30, 1.
- Vernazza, Avrett, and Loeser (1981) Vernazza, J.E., Avrett, E.H., Loeser, R.: 1981, Astrophys. J. Suppl. Ser. 45, 635.
- Vernazza, Avrett, and Loeser (1973) Vernazza, J.E., Avrett, E.H., Loeser, R.: 1973, Astrophys. J. 184, 605.