Quantum Monte Carlo, Density Functional Theory, and Pair Potential Studies of Solid Neon
Abstract
We report quantum Monte Carlo (QMC), plane-wave density-functional theory (DFT), and interatomic pair-potential calculations of the zero-temperature equation of state (EOS) of solid neon. We find that the DFT EOS depends strongly on the choice of exchange-correlation functional, whereas the QMC EOS is extremely close to both the experimental EOS and the EOS obtained using the best semiempirical pair potential in the literature. This suggests that QMC is able to give an accurate treatment of van der Waals forces in real materials, unlike DFT. We calculate the QMC EOS up to very high densities, beyond the range of values for which experimental data are currently available. At high densities the QMC EOS is more accurate than the pair-potential EOS. We generate a different pair potential for neon by a direct evaluation of the QMC energy as a function of the separation of an isolated pair of neon atoms. The resulting pair potential reproduces the EOS more accurately than the equivalent potential generated using the coupled-cluster CCSD(T) method.
pacs:
64.30.+t,71.10.-wI Introduction
One of the most important goals of ab initio computational electronic-structure theory is the development of accurate methods for describing interatomic bonding. Quantum Monte Carlo (QMC) techniques are useful in this regard as they can provide a highly accurate description of electron correlation effects. Although QMC methods are computationally expensive, they can be applied to systems which are large enough to model condensed matter.
In this study we have considered solid neon, in which the bonding arises from the competition between short-range repulsion and the van der Waals attraction between the atoms. High-quality experimental measurements of the equation of state (EOS) exist, which can be used as reference data. Furthermore, various neon pair potentials have been developed using experimental and theoretical data, which can also be used for comparison purposes. Solid neon is therefore an ideal system in which to test the descriptions of van der Waals bonding and short-range repulsion offered by various theoretical methods.
We have calculated theoretical EOS’s for crystalline neon using the QMC and density-functional theory (DFT) ab initio electronic-structure methods as well as various interatomic pair potentials. Standard DFT methods do not describe van der Waals bonding accurately, but they might be expected to work quite well at high densities, where the short-range repulsion dominates. The high-pressure properties of neon are of some experimental interest, because neon is often used as a pressure-conducting medium in diamond-anvil-cell experiments.neon_dac_exps We have therefore extended the range of our QMC EOS for neon to very high pressures (about 400 GPa).
The zero-point energy (ZPE) of the lattice-vibration modes makes a small but important contribution to the total energy of solid neon. We have therefore studied the lattice dynamics of solid neon within the quasiharmonic-phonon approximation and within the Einstein approximation, using DFT methods and pair potentials.
For some time there has been considerable interest in developing neon pair potentials in order to test the accuracy of theoretical methods for calculating the properties of materials.rgs We have performed a direct calculation of the neon pair potential using QMC. We compare the accuracy of the EOS predicted by this pair potential with the results obtained using other pair potentials, including one obtained from coupled-cluster CCSD(T) calculations.cybulski
Detailed information about our computational methodologies is given in Sec. II and DFT calculations of the phase stability and band gap of solid neon are reported in Sec. III. The calculation of a neon pair potential using QMC is described in Sec. IV. The lattice dynamics of solid neon are studied in Sec. V. We compare the EOS’s obtained using different methods in Sec. VI. Finally, we draw our conclusions in Sec. VII.
Hartree atomic units (a.u.) are used throughout, in which the Dirac constant, the magnitude of the electronic charge, the electronic mass, and times the permittivity of free space are unity: .
II Methodology
II.1 DFT calculations
II.1.1 DFT total-energy calculations
Our DFT calculations were performed using the castep plane-wave-basis code.newcastep The local-density approximation (LDA) and Perdew-Burke-Ernzerhof (PBE) generalized-gradient-approximationpbe exchange-correlation functionals were used. The Ne8+ ionic cores were represented by ultrasoft pseudopotentials.newcastep The EOS calculations were performed using a Monkhorst-Pack -point mesh and a plane-wave cutoff energy of 200 a.u., for which the DFT energies have converged to about 7 significant figures. The self-consistent-field calculations were judged to have converged when the fractional change in the energy was less than . The DFT band-gap calculations reported in Sec. III.2 were performed using the same parameters, except that the plane-wave cutoff energies ranged from 100 a.u. for the lowest densities to 800 a.u. for the highest densities.
II.1.2 DFT force-constant calculations
We used the quasiharmonic approximationwallace to evaluate the DFT ZPE of the lattice-vibration modes and we used the method of finite displacements and the Hellmann-Feynman theorem to evaluate the density-dependent force constants. Symmetry and Newton’s third law were imposed iteratively on the matrix of force constants.ackland The DFT force-constant calculations were carried out using a plane-wave cutoff energy of 60 a.u., a Monkhorst-Pack -point mesh, and ultrasoft pseudopotentials.newcastep The force constants were converged to about a.u. with respect to the plane-wave cutoff energy and the -point mesh. In the production force-constant calculations, the displacement of the neon atom from its equilibrium position was % of the nearest-neighbor distance in each case, which ensures that anharmonic effects are negligible. The force-constant calculations were carried out in both and supercells of the primitive unit cell, and the difference in the resulting ZPE’s was found to be negligible. The dispersion curves shown in Sec. V were produced using a supercell, while the ZPE’s that were combined with the static-lattice EOS’s were calculated in a supercell.
II.1.3 DFT orbital-generation calculations
DFT-LDA calculations were performed in order to generate orbitals for the trial wave functions used in the QMC calculations. The QMC calculations made use of relativistic Hartree-Fock neon pseudopotentials,jrt_psps_1 ; jrt_psps_2 and these were also used in the DFT orbital-generation calculations. The Hartree-Fock pseudopotentials are much harder than the ultrasoft pseudopotentials. Plane-wave cutoffs in excess of 250 a.u. were used in each orbital-generation calculation, so the DFT energy was converged to around a.u. This cutoff is very large by the normal standards of DFT calculations, but there is evidence that using large basis sets reduces the variance of the energy in QMC calculations.alfe_2005
II.2 QMC calculations
II.2.1 VMC and DMC methods
In the variational quantum Monte Carlo (VMC) method, expectation values are calculated using an approximate trial wave function, the integrals being performed by a Monte Carlo technique. In diffusion quantum Monte Carloceperley_1980 ; foulkes (DMC) the imaginary-time Schrödinger equation is used to evolve an ensemble of electronic configurations towards the ground state. The fermionic symmetry is maintained by the fixed-node approximation,anderson_1976 in which the nodal surface of the wave function is constrained to equal that of a trial wave function. Furthermore, the use of nonlocal pseudopotentials to represent the Ne8+ cores necessitates the use of the locality approximation,hurley_1987 which leads to errors that are second order in the quality of the trial wave function.mitas
Our QMC calculations were performed using the casino code.casino The trial wave functions were of Slater-Jastrow form, with the orbitals in the Slater wave function being taken from DFT calculations and the free parameters in the Jastrow factor being optimized by minimizing the unreweighted variance of the energy.umrigar_1988a ; ndd_newopt The DFT-generated orbitals were represented numerically using splines on a grid in real space rather than an expansion in plane waves in order to improve the scaling of the QMC calculations with system size.alfe_blips ; williamson_lin_scaling The Jastrow factors consisted of isotropic electron-electron, electron-nucleus, and electron-electron-nucleus terms.ndd_jastrow The electron-electron terms describe long-ranged correlations and therefore play the most important role in describing van der Waals forces.
II.2.2 Finite-size bias
The QMC simulations of crystalline neon were carried out in supercells of finite size subject to periodic boundary conditions. The electrostatic energy of each electron configuration was calculated using the Ewald method.ewald The QMC energy per atom obtained in a finite cell differs from the energy per atom of the infinite crystal due to single-particle finite-size effects and Coulomb finite-size effects. The former result from the fact that the allowed points for the Bloch orbitals form a discrete lattice, so that the single-particle energy components change when the size of the simulation supercell is changed. The latter, which are the more important in insulators, are caused by the interaction of the charged particles with their periodic images. At any given instant, each electron feels itself to be part of an infinite crystal of electrons.ceperley_1978 ; kent_1999 The resulting bias is negative, and is generally believed to fall off as , where is the number of atoms in the simulation cell.ceperley_1980 ; zong_2002 ; ceperley_1987 ; rajagopal_1995
In order to eliminate the finite-size bias, simulations were carried out in supercells consisting of and primitive unit cells. The error in the DFT results arising from the use of a -point mesh is small (about a.u.), so we conclude that single-particle finite-size effects are negligible. The assumed form of the Coulomb finite-size bias was therefore used to extrapolate the results to infinite system size. The static-lattice energy per atom in the infinite-system limit is given by
| (1) |
where is the Vinet fit (see Sec. II.4) to the DMC static-lattice energy-volume data obtained in a set of -atom simulation supercells, is the primitive-cell volume, and is a parameter determined by fitting. Since we only have energy-volume data for two different system sizes, and , we may eliminate and write
| (2) |
The pressure due to the static-lattice energy at infinite system size is given by
| (3) |
where is the static-lattice pressure in an -atom simulation supercell.
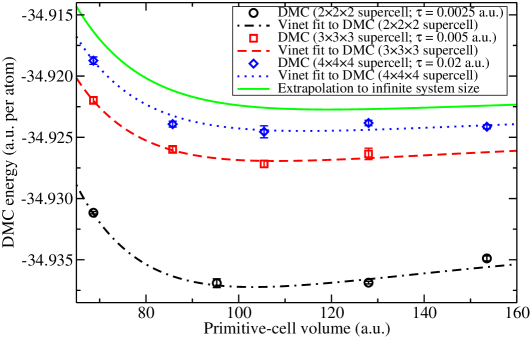
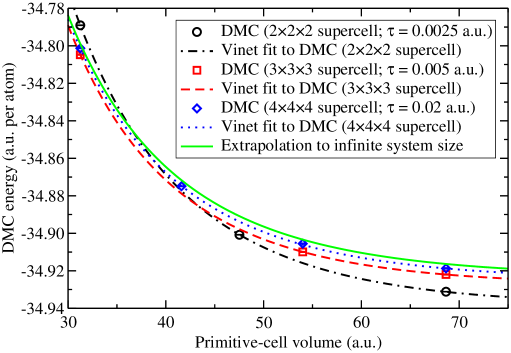
The zero-temperature, static-lattice energy-volume curves of neon, calculated using DMC in different sizes of simulation supercell are shown in Figs. 1 and 2. Vinet EOS’s are fitted to the data. The corresponding pressure-volume data are shown in Figs. 3 and 4. It can be seen that the DMC pressure-volume curves converge steadily with system size, and that the DMC pressure extrapolated to infinite system size using Eq. (3) is close to the pressure of the supercell. This implies that the error introduced by the extrapolation is small, because the extrapolation is itself a small correction.
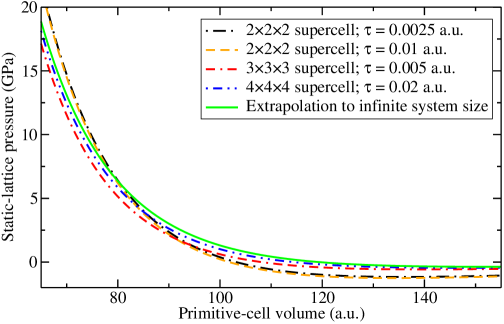
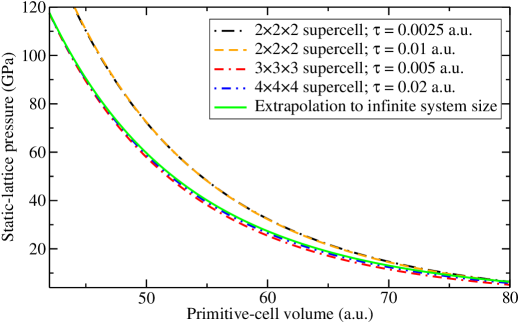
II.2.3 Time-step bias
The fixed-node DMC Green’s function is only exact in the limit of zero time step; the use of a nonzero time step biases the DMC energy. An example of the bias in the DMC energy of a pseudoneon crystal is shown in Fig. 5. On the other hand, as shown by the supercell results in Figs. 3 and 4, the pressure is very insensitive to the time step. We used time steps of a.u. and a.u. in our production calculations for the and supercells, respectively. A time-step of a.u. was used in the DMC pair-potential calculations. The target population was at least 320 configurations in each case, while a target population of 1000 configurations was used for the pair-potential-generation calculations.

II.3 Pair-potential calculations
II.3.1 Forms of neon pair potential
We have used the following forms of pair potential: (i) the HFD-B potential proposed by Aziz and Chenaziz_1977 with the parameter values given by Aziz and Slamanaziz_1989 ; footnote_aziz ; (ii) the form of potential proposed for helium by Korona et al.,korona containing the parameter values determined by Cybulski and Toczyłowskicybulski using all-electron double-excitation coupled-cluster theory with a non-iterative perturbational treatment of triple excitations (CCSD(T)) and an av5z Gaussian basis set; and (iii) a fit of the potential of Korona et al.korona to our DMC energy data, as described in Sec. IV. We believe the HFD-B pair potential to be the most accurate neon pair potential in the literature to date.
II.3.2 Static-lattice energy-volume curve using pair potentials
Let the pair potential between two neon atoms at and be . Let be a large radius. We evaluate the static-lattice energy per atom as
| (4) |
where the are the lattice sites and is the number density of neon atoms. This expression becomes exact as goes to infinity. The integral in Eq. (4) was evaluated analytically for each pair potential, while the sum was evaluated by brute force. was increased until converged.
II.3.3 Force-constant calculations using pair potentials
Pair potentials were used to generate force-constant data for a quasiharmonicwallace calculation of the ZPE of neon. The method of finite displacementsackland was used to generate the force constants in a finite supercell subject to periodic boundary conditions. It was ensured that the force constants were highly converged with respect to the size of the displacements and the number of periodic images of the neon atoms that contributed to the force constants. Following the evaluation of the force constants, the calculation of the ZPE proceeded as described in Sec. II.1.2.
II.4 EOS models
Let be the total energy of a neon crystal as a function of primitive-cell volume . It has previously been noticedtsuchiya that a Vinet EOS of the form
| (5) |
where the zero-pressure volume , bulk modulus , pressure-derivative of the bulk modulus , and integration constant are fitting parameters, gives a better fit than a third-order Birch-Murnaghan EOS,
| (6) |
to DFT results for solid neon. In some cases the Vinet EOS gives a lower value when fitted to our DMC data than the Birch-Murnaghan EOS; in others it gives a higher value. For example, using DMC data obtained in simulation cells consisting of primitive cells and a time step of a.u., the Vinet and Birch-Murnaghan EOS models give values of and , respectively, whereas at a time step of a.u. the EOS models give values of and , respectively. The resulting pressure-volume curves are essentially indistinguishable in each case, however. To be consistent, we have fitted Vinet EOS’s to all of our theoretical data.
III DFT study of phase stability and band gap
III.1 Phase transitions in solid neon
We have compared the DFT energies of face-centered cubic (FCC) and hexagonal close-packed (HCP) phases of solid neon. For HCP neon the lattice-parameter ratio was optimized, but the optimal ratio always turned out to be , which is the ratio appropriate for an ideal HCP lattice. The DFT energy difference between the FCC and HCP phases is typically less than a.u.: too small for us reliably to identify any phase transition. Experimentally, Hemley et al.hemley_1989 have found that solid neon adopts the FCC phase up to pressures of at least 110 GPa at 300 K. We have therefore used the FCC lattice in all of our calculations, apart from those described in this section.
III.2 Band gap of solid neon
The band gap of solid neon, calculated using DFT, is shown in Fig. 6. The band gap is large at the equilibrium volume, and increases significantly when the material is compressed. The DFT calculations predict that neon is still an insulator when it is compressed to a primitive-cell volume of 2 a.u., corresponding to a pressure of about 366 TPa. The use of the ultrasoft neon pseudopotential (with a core radius of 0.9 a.u.) probably causes the DFT results to become unreliable at such high densities; nevertheless, our results indicate that the metalization pressure of neon is of the order of hundreds of TPa. Hemley et al.hemley_1989 concluded that neon remains a wide-gap insulator over the range of pressures that they studied using diamond-anvil cells (up to 110.4 GPa), while Hawke et al.hawke used a magnetic-flux compression device to show that solid neon remains an insulator up to at least 500 GPa.
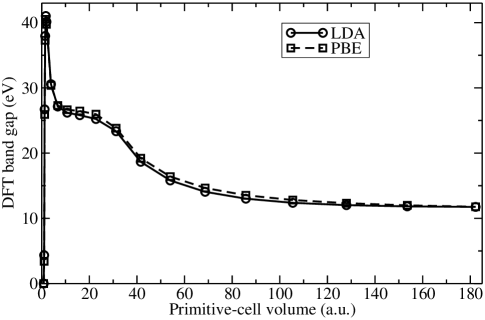
The DFT-LDA and DFT-PBE band gaps at the experimental equilibrium primitive-cell volume (150 a.u.) are 11.85 eV and 12.04 eV, respectively, compared with the experimentally determined value of 21.51 eV.runne As usual, DFT substantially underestimates the band gap. The GW band gap of 20.04 eV, calculated by Galamić-Mulaomerović and Patterson, is relatively accurate.patterson The DMC method can also be used to perform highly accurate band-gap calculations,williamson1998 ; towler2000 although we have not done this for neon.
IV DMC-calculated pair potential for neon
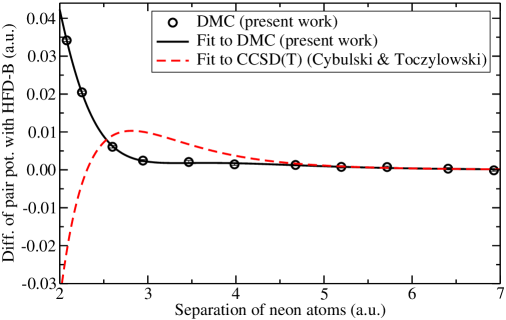
The difference between the DMC pair potential, evaluated as the fixed-nucleus total energy of a neon dimer, and the HFD-B potential is shown in Fig. 7. The DMC energy data have been offset by a constant that was determined by fitting the data to a pair-potential model.footnote_offset We have used the form of potential proposed by Korona et al. for helium,korona which can be written as
| (7) |
where is the separation of the neon atoms. The dispersion coefficients are taken from Cybulski and Toczyłowskicybulski (, , , , , and ) and is the damping function proposed by Tang and Toennies,tang_toennies
| (8) |
, , , and are adjustable parameters, which were determined by a fit to the DMC data, as was the constant offset. The fitted parameter values (in a.u.) are , , , and . The difference of the resulting pair potential with the HFD-B potential is shown in Fig. 7, as is the corresponding curve for the CCSD(T) data. It can be seen that over a wide range of separations the DMC pair potential lies closer to the HFD-B pair potential than the CCSD(T)-generated pair potential.
V Lattice dynamics and zero-point energy
By comparing the results obtained using a Lennard-Jones potential in the harmonic approximation with the VMCfootnote_vmc results obtained using the same potential by Hansen,hansen Pollock et al.pollock have demonstrated that the harmonic approximation is valid for solid neon at high pressures. We consider two methods for calculating the ZPE: (i) the ZPE of quasiharmonic phonons can be evaluated in a supercell of several primitive cells, or (ii) the ZPE can be computed within the Einstein approximation by evaluating the quadratic potential felt by each atom as it is displaced from its equilibrium position with all the other atoms held fixed.
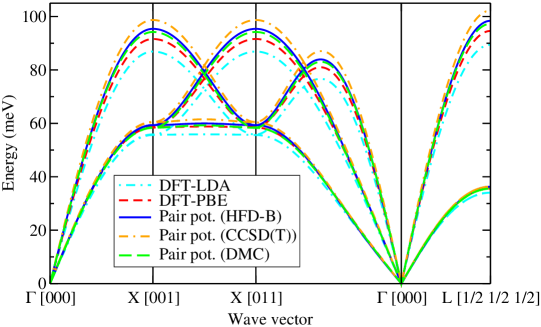
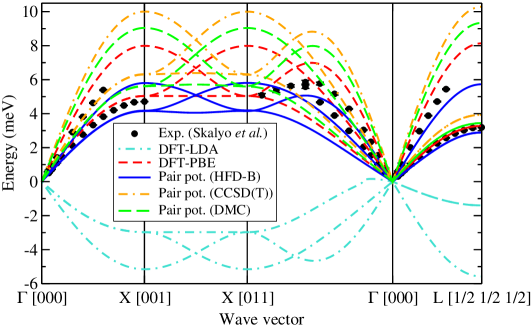
Examples of phonon dispersion curves at two different densities are shown in Figs. 8 and 9. Inelastic neutron-scattering dataskalyo are also shown in Fig. 9. At high density the DFT-LDA and DFT-PBE dispersion curves are in good agreement, but at low density the DFT-LDA phonon frequencies are significantly lower than the DFT-PBE frequencies. Unstable (imaginary) phonon modes start to occur at a primitive-cell volume of about 133 a.u. in the LDA. By contrast, there are no unstable phonon modes, even at a primitive-cell volume of 182.25 a.u., when the PBE functional is used. The DFT and pair-potential results are in agreement at high densities, indicating that the DFT results are accurate in this regime. Overall, the DFT-PBE dispersion curves appear to be more accurate (that is, closer to the HFD-B and experimental results) than the DFT-LDA dispersion curves.
The pressure arising from the ZPE of solid neon as calculated using different methods is plotted relative to the HFD-B results in Fig. 10. Within DFT, the Einstein approximation is excellent. It can be seen that the difference between the LDA and PBE results is appreciable at low densities, but that the difference between the Einstein and quasiharmonic zero-point pressures is more significant at high densities. As expected from examination of the dispersion curves, the HFD-B zero-point pressure is closer to the DFT-PBE results than the DFT-LDA ones; nevertheless, all the zero-point-pressure results are in good agreement.
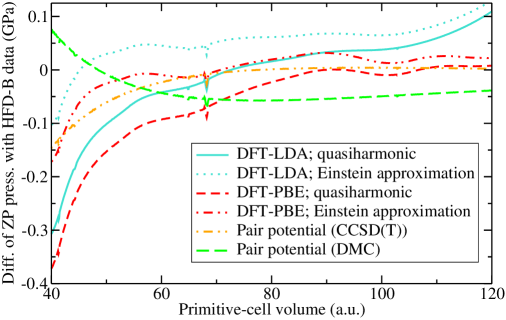
The DFT quasiharmonic zero-point pressures have been added to the corresponding static-lattice pressures to give the final EOS’s. The DFT-PBE quasiharmonic zero-point pressure has been added to the DMC static-lattice pressure to give the final DMC EOS. For the pair potentials, the quasiharmonic zero-point pressure calculated using each pair potential has been added to the corresponding static-lattice pressure in order to obtain the final EOS.
VI Zero-temperature EOS of neon
Zero-temperature EOS’s for solid neon, calculated using DFT-LDA, DFT-PBE, DMC [extrapolated to infinite system size using Eq. (3)], and pair potentials are shown in Fig. 11, and the differences of the theoretical EOS’s with the experimental EOS are plotted in Fig. 12. (The low-density experimental pressure-volume data of Anderson et al.anderson shown in Fig. 11 were obtained at 4.2 K, while the high-density experimental data of Hemley et al.hemley_1989 were obtained at 300 K. Hemley et al. reduced their pressure-volume data to the zero-temperature isotherm using a Mie-Grüneisen model and fitted their results to a third-order Birch-Murnaghan EOS, with the zero-pressure primitive-cell volume and bulk modulus being the values obtained by Anderson et al. The resulting EOSfootnote_exp_eos is valid at both low and high densities and is regarded as being the definitive experimental EOS.) The parameter values for a Vinet fit (Eq. (5)) to our DMC data (including the DFT-PBE ZPE) are a.u., GPa, and .
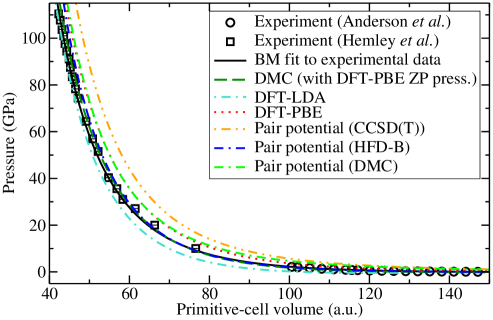
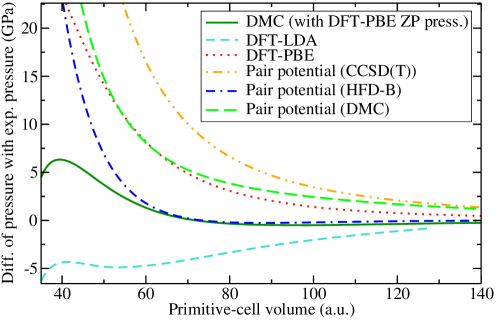
At low densities the DFT-LDA and DFT-PBE EOS’s differ markedly. The strong dependence of the DFT results on the choice of exchange-correlation functional implies that the description of van der Waals bonding within DFT is unreliable, as one would expect, given the local nature of the approximations to the exchange-correlation functional. DMC produces a considerably more accurate EOS than DFT, suggesting that DMC is capable of giving a proper description of van der Waals bonding. The HFD-B pair potentialaziz_1989 gives an EOS of similar accuracy to the DMC EOS at low to intermediate densities. At higher densities, the EOS calculated using DMC is better than any of the pair-potential EOS’s. Although the difference between the DMC and experimental pressures is significant at high densities, it should be emphasized that the fractional error remains small.
The pair potential calculated using CCSD(T) theorycybulski gives a poorer EOS than the DMC-generated pair potential. On the other hand, the EOS obtained using the DMC pair potential is significantly poorer than the HFD-B EOS. Taken together with the fact that the direct DMC EOS is excellent, this suggests that many-body interactions play a significant role in solid neon, and that such interactions are included to some extent in the HFD-B potential.
VII Conclusions
We have performed DMC calculations of the energy of FCC solid neon as a function of the lattice constant and the energy of the neon dimer as a function of atomic separation. Other calculations using DFT methods and pair potentials have been performed to evaluate the ZPE and for comparison purposes.
We have calculated the phonon dispersion curves of solid neon using the DFT-LDA and DFT-PBE methods, the HFD-B pair potential, and CCSD(T)- and DMC-derived pair potentials. We believe the results obtained with the HFD-B pair potential are likely to be the most accurate. DFT-PBE gives more accurate dispersion curves than DFT-LDA, for which the phonon frequencies are too low. The dispersion curves obtained with the DMC pair potential are more accurate than those obtained using either DFT or the CCSD(T) pair potential. We have calculated the ZPE of solid neon using the DFT-LDA and DFT-PBE methods, and the HFD-B, CCSD(T), and DMC pair potentials, within the quasiharmonic approximation. At low pressures the ZPE depends on the calculation method used, but the contribution to the EOS is small, while at high pressures the dependence on the calculation method is relatively weak, although the contribution of the ZPE to the EOS is significant. The Einstein model gives ZPE’s in very good agreement with the quasiharmonic values over the pressure range considered.
We have calculated the zero-temperature EOS of solid neon using the DFT and DMC methods, including corrections for the ZPE. We have shown that the DFT results depend strongly on the choice of exchange-correlation functional, while the DMC results are close to the experimental EOS. We therefore have evidence that DMC gives a better description of van der Waals bonding in real materials than DFT. At high pressures the DMC EOS is closer to the experimental results than the EOS obtained using the HFD-B pair potential. However, the statistical errors of about 0.0002 a.u. in the DMC energy data for solid neon are too large to determine an accurate value for the lattice constant of the solid. We have shown that the neon pair potential determined by DMC calculations gives a more accurate EOS than the pair potential determined by CCSD(T) calculations, although the DMC pair-potential results are not as accurate as those obtained using the semiempirical HFD-B potential. Overall, our results demonstrate the accuracy and reliability of the DMC method and the high quality of the neon pseudopotentials that we have used.
VIII Acknowledgments
Financial support has been provided by the Engineering and Physical Sciences Research Council (EPSRC), UK. Computing resources have been provided by the Cambridge-Cranfield High Performance Computing Facility. We thank J. R. Trail for providing the relativistic Hartree-Fock pseudopotential used in this work.
References
- (1) E. Gregoryanz, R. J. Hemley, H.-K. Mao, and P. Gillet, Phys. Rev. Lett. 84, 3117 (2000); J. Li, H.-K. Mao, Y. Fei, E. Gregoryanz, M. Eremets, and C. S. Zha, Phys. Chem. Minerals 29, 166 (2002); S. D. Jacobsen, H. Spetzler, H. J. Reichmann, and J. R. Smyth, Proc. Natl. Acad. Sci. USA 101, 5867 (2004); J.-F. Lin, V. V. Struzhkin, S. D. Jacobsen, M. Y. Hu, P. Chow, J. Kung, H. Liu, H.-K. Mao, and R. J. Hemley, Nature 436, 377 (2005).
- (2) Rare Gas Solids, ed. M. L. Klein and J. A. Venables, Academic (1977).
- (3) S. M. Cybulski and R. R. Toczyłowski, J. Chem. Phys. 111, 10520 (1999).
- (4) M. D. Segall, P. J. D. Lindan, M. J. Probert, C. J. Pickard, P. J. Hasnip, S. J. Clark, and M. C. Payne, J. Phys. Condens. Matter 14, 2717 (2002).
- (5) J. P. Perdew, K. Burke, and M. Ernzerhof, Phys. Rev. Lett. 77, 3865 (1996).
- (6) D. C. Wallace, Thermodynamics of crystals, John Wiley and Sons, New York (1972).
- (7) G. J. Ackland, M. C. Warren, and S. J. Clark, J. Phys. Condens. Matter 9, 7861 (1997).
- (8) J. R. Trail and R. J. Needs, J. Chem. Phys. 122, 014112 (2005).
- (9) J. R. Trail and R. J. Needs, J. Chem. Phys. 122, 174109 (2005).
- (10) D. Alfè, M. Alfredsson, J. Brodholt, M. J. Gillan, M. D. Towler, and R. J. Needs, Phys. Rev. B 72, 014114 (2005).
- (11) D. M. Ceperley and B. J. Alder, Phys. Rev. Lett. 45, 566 (1980).
- (12) W. M. C. Foulkes, L. Mitas, R. J. Needs, and G. Rajagopal, Rev. Mod. Phys. 73, 33 (2001).
- (13) J. B. Anderson, J. Chem. Phys. 65, 4121 (1976).
- (14) M. M. Hurley and P. A. Christiansen, J. Chem. Phys. 86, 1069 (1987).
- (15) L. Mitás̆, E. L. Shirley and D. M. Ceperley, J. Chem. Phys. 95, 3467 (1991).
- (16) R. J. Needs, M. D. Towler, N. D. Drummond, and P. Lopez Rios, casino version 2.0 User Manual, University of Cambridge, Cambridge (2005).
- (17) C. J. Umrigar, K. G. Wilson, and J. W. Wilkins, Phys. Rev. Lett. 60, 1719 (1988).
- (18) N. D. Drummond and R. J. Needs, Phys. Rev. B 72, 085124 (2005).
- (19) D. Alfè and M. J. Gillan, Phys. Rev. B 70, 161101(R) (2004).
- (20) A. J. Williamson, R. Q. Hood, and J. C. Grossman, Phys. Rev. Lett. 87, 246406 (2001).
- (21) N. D. Drummond, M. D. Towler, and R. J. Needs, Phys. Rev. B 70, 235119 (2004).
- (22) P. P. Ewald, Ann. Physik 64, 253 (1921).
- (23) D. Ceperley, Phys. Rev. B 18, 3126 (1978).
- (24) P. R. C. Kent, R. Q. Hood, A. J. Williamson, R. J. Needs, W. M. C. Foulkes, and G. Rajagopal, Phys. Rev. B 59, 1917 (1999).
- (25) F. H. Zong, C. Lin, and D. M. Ceperley, Phys. Rev. E 66, 036703 (2002).
- (26) D. M. Ceperley and B. J. Alder, Phys. Rev. B 36, 2092 (1987).
- (27) G. Rajagopal, R. J. Needs, A. James, S. D. Kenny, and W. M. C. Foulkes, Phys. Rev. B 51, 10591 (1995).
- (28) R. A. Aziz and H. H. Chen, J. Chem. Phys. 67, 5719 (1977).
- (29) R. A. Aziz and M. J. Slaman, Chem. Phys. 130, 187 (1989).
- (30) The short-range modifications to the HFD-B potential proposed by Aziz and Slaman are irrelevant in this work, because the potential is only modified at a separation of less than 2.36 a.u., corresponding to an FCC primitive-cell volume of 9.32 a.u.
- (31) T. Korona, H. L. Williams, R. Bukowski, B. Jeziorski, and K. Szalewicz, J. Chem. Phys. 106, 5109 (1997).
- (32) T. Tsuchiya and K. Kawamura, J. Chem. Phys. 117, 5859 (2002).
- (33) R. J. Hemley, C. S. Zha, A. P. Jephcoat, H. K. Mao, L. W. Finger, and D. E. Cox, Phys. Rev. B 39, 11820 (1989).
- (34) P. S. Hawke, T. J. Burgess, D. E. Duerre, J. G. Huebel, R. N. Keeler, H. Klapper, and W. C. Wallace, Phys. Rev. Lett. 41, 994 (1978).
- (35) M. Runne and G. Zimmerer, Nucl. Instr. Meth. B 101, 156 (1995).
- (36) S. Galamić-Mulaomerović and C. H. Patterson, Phys. Rev. B 71, 195103 (2005).
- (37) A. J. Williamson, R. Q. Hood, R. J. Needs, and G. Rajagopal, Phys. Rev. B 57, 12140 (1998).
- (38) M. D. Towler, R. Q. Hood, and R. J. Needs, Phys. Rev. B 62, 2330 (2000).
- (39) We have determined the constant offset to the energy data during the fitting procedure instead of subtracting the energy of two isolated neon atoms in order to improve the accuracy of the fit. The fixed-node error in a neon dimer is larger than the fixed-node error in an isolated neon atom. Therefore a direct evaluation of the absolute value of the pair potential is a (slight) systematic overestimate.
- (40) K. T. Tang and J. P. Toennies, J. Chem. Phys. 80, 3726 (1984).
- (41) While Hansenhansen used the VMC method to calculate the ground-state of the atoms, interacting with Lennard-Jones potentials, we use the VMC method to calculate the ground state of the electrons within the Born-Oppenheimer approximation.
- (42) J.-P. Hansen, Phys. Rev. 172, 919 (1968).
- (43) E. L. Pollock, T. A. Bruce, G. V. Chester, and J. A. Krumhansl, Phys. Rev. B 5, 4180 (1972).
- (44) J. Skalyo, Jr., V. J. Minkiewicz, G. Shirane, and W. B. Daniels, Phys. Rev. B 6, 4766 (1972).
- (45) M. S. Anderson, R. Q. Fugate, and C. A. Swenson, J. Low Temp. Phys. 10, 345 (1973).
- (46) The experimental EOS, taken from Ref. hemley_1989, , is given by Eq. (6) with GPa, a.u., and .