Magnetophoresis of Flexible DNA-based Dumbbell Structures
Abstract
Controlled movement and manipulation of magnetic micro and nanostructures using magnetic forces can give rise to important applications in biomedecine, diagnostics and immunology. We report controlled magnetophoresis and stretching, in aqueous solution, of a DNA-based dumbbell structure containing magnetic and diamagnetic microspheres. The velocity and stretching of the dumbbell were experimentally measured and correlated with a theoretical model based on the forces acting on individual magnetic beads or the entire dumbbell structures. The results show that precise and predictable manipulation of dumbbell structures is achievable and can potentially be applied to immunomagnetic cell separators.
pacs:
47.63. b,85.70. w,87.14.Gg,47.85.NpMagnetic micro- and nanoparticles find widespread applications in biotechnology, e.g. separation of cells and biomolecules. Commercially available, micrometer-sized magnetic beads (MBs) are polymer spheres containing homogenously dispersed superparamagnetic iron oxide nanoparticles Fonnum . To make them suitable for biological uses their surface is typically functionalized with high affinity binding proteins e.g. Streptavidin or protein A. Such affinity functionalized beads can then be bound specifically to cells or biomolecules for magnetic separation from biological samples (magnetic pulldown). In contrast to such bulk magnetic separation, controlled manipulation and movement (magnetophoresis) of individual magnetic beads requires more intricate control over external magnetic fields. There have been efforts in the last years to optimize magnetophoretic conditions for this purpose Inglis1 ; Chiou , however, applications involving magnetophoresis are still scarce and almost exclusively tested on individual MBs Fonnum ; Pamme ; Watarai .
General theoretical basis for MB magnetophoresis can be derived by accounting for the forces acting on the MB. In the presence of an inhomogeneous magnetic field, a magnetic force is exerted on a MB. Here, is the magnetization of a bead in the magnetic field . In the conditions used in this study the magnetization of a MB is unsaturated (the saturation magnetic field is T), and hence the magnetic response of the bead is described as a linear function of the volumetric magnetic susceptibility, . Therefore, the magnetic force becomes:
| (1) |
where is MB’s volume, is the volume magnetic susceptibility of the surrounding aqueous solution and is the vacuum magnetic permeability. In addition to this magnetic force, MBs moving in a fluid also experience a counteracting viscosity-related drag force. For a spherical particle in laminar flow, the drag force is , where is viscosity of a fluid, and v and stand for velocity and radius of a bead, respectively. Thus, the net force acting on a MB is given as:
| (2) |
Magnetic separations of specific immune cell types and populations have found widespread use in research, diagnostic and therapeutic uses. Immunochemical methods have been developed for attachment of magnetic beads to the cell surfaces, typically followed by magnetic separation Thiel . Frequent problem encountered in this type of ”positive” immunomagnetic sorting is that the immune cell can ”sense” the magnetic bead, thus triggering immunogenic responses such as activation and internalization Oren . This often necessitates the use of an alternative, ”negative” sorting technique that targets for removal all cell types with the exception of the cell population of interest, which remains unattached Cotter . Negative sorting is an expensive and cumbersome proposition, as it requires the use of large quantities and diverse panels of magnetic beads directed at many divergent cell types.
We have reasoned that formation of dumbbell structures by attaching magnetic beads to immune cells via polymeric linkers would provide sufficient separation between the MB and the cell surface to minimize activation and internalization, and thus would be an attractive alternative to negative immunomagnetic sorting. In this letter, we report on an experimental study of controlled movement of model structures consisting of magnetic beads and latex diamagnetic spheres, joined via DNA linkers, as a physical model for magnethophoretic separation of immunological cell types via dumbbells.
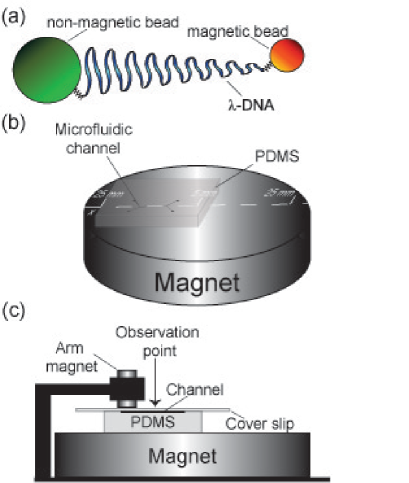
An illustration of a dumbbell is shown on Fig. 1(a). The magnetic beads M-280 with diameters of m and MyOne with diameters of m (Invitrogen, Oslo, Norway) were investigated. The iron content for M-280 and MyOne was and , respectively Dynal . In this study, we concentrated on analyzing the results obtained with M-280 MBs. The non-magnetic beads (NMBs) are diamagnetic, polymer spheres with a diameter of m (Bangs Laboratories, Inc., USA).
The flexible linker consisted of bacteriophage -DNA (New England Biolabs, USA) with a contour length of m. A biotinylated oligonucleotide was ligated to the first recessed end of and the purified biotinylated DNA was then bound to streptavidin coated M-280 MBs via a strong biotin-streptavidin bond. In order to attach a streptavidin-coated NMB to the other terminus of the DNA polymer, we used biotin incorporation via fill-in of the second recessed end with Klenow polymerase and biotin-dCTP. Finally, the complete DB was formed by resuspending the reaction product in aqueous buffer and adding streptavidin-coated NMBs. A full description of the dumbbell synthesis process will be published elsewhere. Prior to magnetophoresis, the solutions were diluted in deionized water containing by weight ( wt ) of sodium dodecyl sulfate surfactant. This minimizes nonspecific adhesive binding between the beads and the surfaces of the channel.
All experiments on controlled movement and manipulation of the dumbbells were done in microfluidic channels with widths from m down to m. A mould with the channel pattern was structured with SU-8 photoresist on a silicon wafer using standard photolithography. The microfluidic device was cast in polydimethylsiloxane (PDMS) and subsequently sealed on a glass cover slip Whitesides .
Magnetophoresis was performed initially on individual MBs and subsequently the procedure was applied to the dumbbells. The microfluidic chip was loaded with the MB suspension (typically l) and subsequently transferred onto a stationary, permanent disk magnet (rare earth magnet NdFeB, mm diameter, mm width). An illustration of the magnet with a microfluidic channel is shown in Fig. 1(b). The radial magnetic field gradient generated by the disk shape ( T/m), enables us to achieve directional movement of the beads along the channel in a controlled manner (the -direction was arbitrarily choosen). We safely neglected effects of the gravitational force and thermal energy Fonnum . The movement of individual MBs was observed with a light microscope (X, Olympus, Japan) equipped with a objective (UPlan FI, Olympus, Japan). The trajectories were recorded at different spatial positions on the magnet with a digital camera (DP-70, Olympus, Japan). The integration time varied between one second (strong magnetic field) up to ten seconds (weak magnetic field). From these images one can calculate the velocity of MBs, by dividing the recorded distance with the integration time.
To estimate the dynamics of a DB in a microfluidic channel we considered that the net force acting on a DB is composed of the total force given by Eq. 2, acting on the MB terminus, while the NMB experiences only the drag force. Stretching of the DNA linker occurs only if sufficient force difference is exerted on the DB between the MB and the NMB. The dumbbell will move with equilibrium velocity approximating a value that can be found from Eq. 2 for the MB, and which will determine the drag force acting on the NMB terminus. The hydrodynamic drag force would act as a dynamic anchor, and at equilibrium would be equal to the stretching force. For the disk magnet, the stretching force was estimated pN forceestimate , which was not sufficient to completely stretch a DB. To increase the force, we redesigned our magnetophoretic set up, introducing an additional permanent magnet ( mm diameter, mm width), which can be moved at desired position over the stationary disk magnet. A side view of a channel sandwiched between the arm and disk magnet is shown in Fig. 1(c). This provided a significant increase in the magnetic field gradient experienced by a MB. For example, even at a distance of mm from its center (the observation point in Fig. 1(c)), the stretching force is pN, which should be sufficient to fully stretch a single strand of -DNA Bustamante ; Chiou .
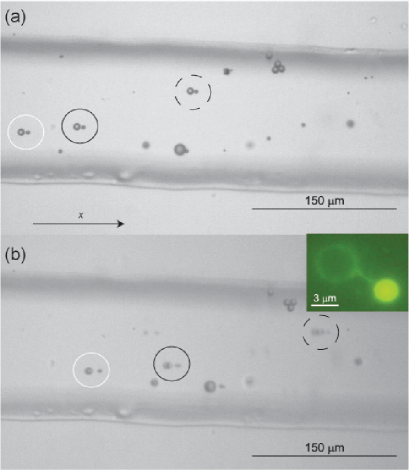
Figure 2(a) shows an optical image of a microfluidic channel at position mm on the disk magnet and relatively far away from the arm magnet ( mm). Three partially stretched DBs are visible in the channel (indicated by circles). The average stretching was found to be m. Subsequently, we approached with the arm magnet at a distance of mm from the observation point. The image shown in Fig. 2(b) is taken at the same position of the microfluidic channel as in Fig. 2(a). The movements of all three DBs are clearly visible despite the short integration time msec. Moreover, the DBs from left to right along the channel (the arm magnet is situated on the right side), show an increase in velocity which is reflected in the image as blurring (the faster the DB moves, the more pronounced the blurring is). The average stretching is found to be m, more then doubled compared to the stretching obtained from Fig. 2(a). This conformal elongation of DB is significantly shorter then the full length of -DNA. The main reason for such incomplete streching is the presence of multiple DNA molecules in the linker since the large surface area of the beads contained multiple streptavidin molecules. In addition, some of the DNA molecules are very likely to be wrapped around the beads, which further reduces the probability of a full contour stretching of a DB. It is possible to reduce multiple attachments of DNA by sonicating the samples for few seconds ( sec) which can lead to shearing of DNA molecules. After sonication, the percentage of DBs connected by a single strand was found to be around . However, the overall number of DBs was also reduced, and at longer sonication times no DBs were visible, due to complete shearing of the dumbbell linker. The fluorescent image of a DB containing the beads and DNA is shown in inset of Fig. 2(b). The image is obtained with a florescence microscope where the DNA is stained with a cyanine dimer dye, YOYO-1 (Molecular Probes Inc., USA). The numerous DNA molecules anchored at the edges of the beads are clearly visible as a bright halo. The multiple DNA binding could be more controllably reduced in the future by using magnetic nanoparticles which offer smaller surface area per particle and hence fewer attachment sites.
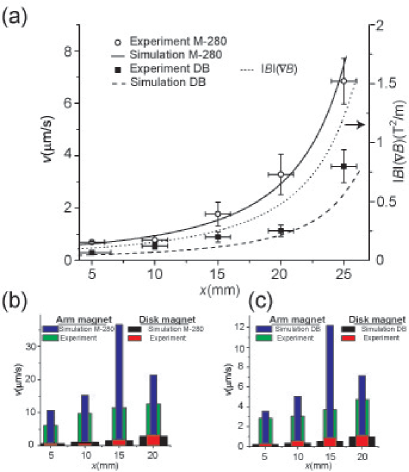
In order to model the system, we needed to know the magnetic field and its gradient. The magnetic field was measured with a gaussmeter (Lakeshore, 410). From the obtained values we were numerically able to extract the magnetic field gradient. In Fig. 3(a), we plotted the experimentally obtained velocities at various spatial positions on the disk magnet for an individual MB and a DB. The velocity-position dependance is simulated by numerically solving Eq. 2 using m as the MB diameter ( m and m for a DB), the viscosity of water kg m-1s-1, the magnetic permeability of vacuum N/A2, while the magnetic susceptibility of the fluid comparative to the MB was neglected. We would like to emphasize that the volume magnetic susceptibility of the MB can be extracted as a fitting parameter from the velocity-position measurements. For an individual MB, we obtain which is in good agreement with previously reported values Lee ; Amblard . In the case of the DB, the dynamics of DNA were neglected, which was justified due to the size of the used beads: the drag force associated with the beads is greater than for a single DNA molecule, multiple DNA molecules in the linker between, or multiple DNAs wrapped around beads. From the plot in Fig. 3(a), we see that the experimental results for the MBs and DBs are well described by this simple theoretical model. As a qualitative check, we also display in Fig. 3(a) the product ) versus spatial position on the disk magnet (dotted line). Clearly, the ) product is the main qualitative determinant for the dynamic behavior of the objects in this study. Finally, with Fig. 3(b) and (c) we demonstrate the significant increase in the velocity and stretching of a DB, when the arm magnet is used in combination with the disk magnet. Fig. 3(b) shows histograms of experimentally found velocities, together with the corresponding simulation for a single MB, while Fig. 3(c) displays similar histograms for the DB. Simulated velocities were extracted by calculating the magnetic field and its gradient along the length of the channel for the magnetic configuration illustrated in Fig. 1(c) us1 . Both histograms in Fig. 3(b) and (c), display a marked increase in the velocities of the test objects. While the overall trend of velocity increase in the case of the arm magnet setup is present, it is in lesser agreement with the simulation than in the case of the bare disk magnet. We find that simulation values are highly sensitive to the magnetic field gradient and the extracted values strongly depend on the exact choice of observation position. Thus, small inherent inaccuracies in precise determination of the observation point position can lead to sizeable disagreement between the model and the data.
In conclusion, we have investigated magnetophoresis of MBs and DBs formed from magnetic and non-magnetic beads connected by DNA strands. We find a strong dependence of dumbbell stretching on the product of the magnetic field and its gradient. Experimentally measured velocities of the MBs and DBs were compared with a theoretical model, assuming simple equilibrium between magnetic and drag force. We find solid agreement between the model and the experimental data. This demonstrated approach to use a magnetic force to stretch a flexible DNA-based dumbbell - with a hydrodynamic drag force acting as a dynamic anchor on the nonmagnetic terminus - has the potential to be a versatile tool in future applied biological and biomedical separation devices.
Acknowledgements.
We acknowledge experimental help from M. Hines and J. Cooper-White, and valuable discussion with T. Meehan, R. Vogel and M. Trau.References
- (1) G. Fonnum, C. Johansson, A. Molteberg, S. Mørup and E. Aksnes, J. Magn. Magn. Mater. 293, 41-47 (2005).
- (2) D. W. Inglis, R. Riehn, R. H. Austin and J. C. Sturm, J. Appl. Phys. 85, 5093 (2004).
- (3) C. Chiou, Y. Huang, M. Chiang, H. Lee and G. Lee, Nanotechnology 17, 1217 (2006).
- (4) N. Pamme and Andreas Manz, Anal. Chem., 76, No.24, 7250 (2004).
- (5) H. Watarai, M. Suwa and Y. Iiguni, Analytical and Bioanalytical Chemistry 378(7), 1693-1699 (2004).
- (6) A. Thiel, A. Scheffold, and A. Radbruch, Immunotechnology 4, 89-96 (1998).
- (7) A. Øren, C. Husebø, A. C. Iversen and R. Austgulen, Journal of Immunological Methods 303, 1-10 (2005).
- (8) M. J. Cotter, K. E. Norman, P. G. Hellewell and V. C. Ridger, American Journal of Pathology 159, 473-481 (2001).
- (9) Invitrogen private communication.
- (10) S. K. Sia and G. M. Whitesides, Electrophoresis 24(21), 3563-3576 (2003).
- (11) Initial estimation of the magnetic force was performed based on numerical simulation of the magnetic field distribution calculated using Quick-field sofware.
- (12) S. B. Smith, L. Finzi and C. Bustamante, Science 258, 1122 (1992).
- (13) H. Lee, A. M. Purdon and R. M. Westervelt, Appl. Phys. Lett. 55, R6137 (1997).
- (14) F. Amblard, B. Yurke, A. Pargellis and S. Leibler, Rev. Sci. Lett. 67(3), 818-827 (1996).
- (15) The magnetic field distribution is calculated with software package Quick field (not shown), while all the other simulations are done using Mathematica ver 5.1. The arm magnet data for the position mm is absent due to our magnetic design.