Double-peaked Oxygen Lines Are not Rare in Nebular Spectra of Core-Collapse Supernovae
Abstract
Double-peaked oxygen lines in the nebular spectra of two peculiar Type Ib/c Supernovae (SN Ib/c) have been interpreted as off-axis views of a GRB-jet or unipolar blob ejections. Here we present late-time spectra of 8 SN IIb, Ib and Ic and show that this phenomenon is common and should not be so firmly linked to extraordinary explosion physics. The line profiles are most likely caused by ejecta expanding with a torus- or disk-like geometry. Double-peaked oxygen profiles are not necessarily the indicator of a mis-directed GRB jet.
Subject headings:
gamma-ray burst: general supernovae: general1. INTRODUCTION
To understand the connection between long-duration Gamma Ray Bursts (GRBs) and the supernovae (SNe) associated with them, it would be significant to detect the effects of jets that are produced in the explosion even when the observer is not in the relativistic beam (Woosley & Bloom, 2006)). In the broad-lined Type Ic, SN 2003jd, an off-axis GRB jet was proposed as the cause for the double-peaked oxygen profile observed in its nebular spectrum (Mazzali et al., 2005; Valenti et al., 2008). A similar double-peaked oxygen profile, with a large blueshift, was detected in the peculiar Type Ib, SN 2005bf (Maeda et al., 2007; Modjaz, 2007), where it was interpreted as coming from a unipolar blob or jet (Maeda et al., 2007).
If the double-peaked oxygen shape were exclusively caused by highly relativistic jets, then we might expect only broad-lined SN Ic, whose line widths approach 30,000 , and which are the only subtype of stripped-envelope SN seen at the sites of GRBs to exhibit them. However, if we see double-peaked profiles in a range of supernova types, we might conclude that asphericities are present in more typical core-collapse events.
We set out to obtain a set of nebular spectra for supernovae of various subtypes to measure the emission line profiles with adequate resolution and signal to detect signs of these double-peaked profiles in nebular spectra of supernovae. As the supernova turns optically thin a few months after maximum light, the emission line shapes can provide information on the velocity distribution of the ejecta (Matheson et al., 2001; Foley et al., 2003; Maeda et al., 2006). Structure in emission line profiles have been reported in SN II (Spyromilio, 1991), SN IIb (Spyromilio, 1994; Matheson et al., 2000) and SN Ib (Sollerman et al., 1998; Elmhamdi et al., 2004), and interpreted as clumping of oxygen in the ejecta.
2. Observations and Analysis
Spectra were obtained with the 6.5 m Clay Telescope of the Magellan Observatory located at Las Campanas Observatory, the 8.1 m Gemini-North telescope via queue-scheduled observations (GN-2005B-Q-11, GN-2006B-Q-16 PI: Modjaz), the 6.5 m Multiple Mirror Telescope (MMT) and the 1.5 m Tillinghast telescope at the Fred Lawrence Whipple Observatory (FLWO). The spectrographs utilized were the LDSS-3 (Mulchaey & Gladders 2005) at Magellan, the GMOS-North (Hook et al., 2003) at Gemini, the Blue Channel (Schmidt et al., 1989) at the MMT, and FAST (Fabricant et al., 1998) at the FLWO 1.5 m telescope. All optical spectra were reduced and calibrated employing standard techniques in IRAF111IRAF is distributed by the National Optical Astronomy Observatory, which is operated by the Association of Universities for Research in Astronomy, Inc., under cooperative agreement with the National Science Foundation. and our own IDL routines for flux calibration (see e.g., Matheson et al. 2008).

In Figure 1, we present the observed nebular spectra of 8 new SN IIb, SN Ib and SN Ic. For clarity we show only the latest spectrum of each SN (except for SN 2004ao). We double the number of unambiguous SN Ib with late-time data from four historical cases (SNe 1983N, 1984L, 1990I, and 1996N) to a total of eight (now including SNe 2004ao, 2004dk, 2004gq, 2004gv), not counting SN 2005bf (see also Maeda et al. 2008). We determined the phase with respect to maximum from our own photometry (Modjaz 2007, M. Modjaz, in prep.). In addition, we show our data of the peculiar SN Ib 2005bf, independently observed and analyzed by Maeda et al. (2007), and of SN 2006aj, the broad-lined SN Ic connected with GRB 060218 (Modjaz et al., 2006), independently observed and analyzed by Mazzali et al. (2007).
All spectra display the hallmark features of nebular SN Ib/c spectra: strong forbidden emission lines of intermediate-mass elements such as [O I] 6300,6363 and [Ca II] 7291,7324, similar to spectra of SN II. In the absence of hydrogen, oxygen is the primary coolant in the ejecta of stripped-envelope SN at late epochs when the gas is neutral or at most singly ionized (Uomoto & Kirshner, 1986; Fransson & Chevalier, 1987). SN 2005bf is the only SN discussed here that exhibits broad H (see also Maeda et al. 2007).
3. Detection of Double-peaked Oxygen Lines
In the optically-thin case, the late-time emission line profile is dictated, in principle, by the geometry and distribution of the emitting material (Fransson & Chevalier, 1987; Schlegel & Kirshner, 1989). A radially expanding spherical shell of gas produces a square-topped profile, while a filled uniform sphere produces a parabolic profile. In contrast, a cylindrical ring, or torus, that expands in the equatorial plane gives rise to a “double-horned” profile as there is very little low-velocity emission in the system, while the bulk of the emitting gas is located at , where is the projected expansion velocity at the torus.
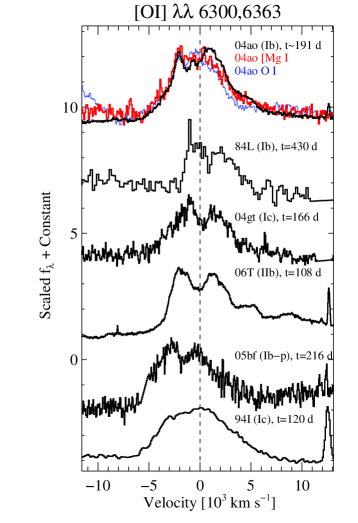
Figure 1 shows that SNe 2004ao, 2004gt, 2006T show conspicuous double-peaked lines of [O I] 6300,6363. We plot the oxygen line profiles in velocity space for these objects in Figure 2. A literature search of published SN IIb, Ib, and Ic spectra reveals that SN Ib 1984L, the prototype of the SN Ib class, also shows a clear double-peaked profile that went unremarked in the original publication (Schlegel & Kirshner, 1989). We plot the spectrum with the highest S/N in Figure 2. Finally, we also include our data on SN 2005bf, the peculiar SN Ib with extraordinary early-time light curves and spectra (Tominaga et al., 2005; Folatelli et al., 2006), that showed highly blue-shifted (by 2000 ) oxygen and calcium lines (Maeda et al., 2007; Modjaz, 2007).
This double-peaked line profile is visible in the oxygen line and not in calcium. For SN 2004ao, the only SN for which we have a sufficiently high S/N spectra, the double-horned feature is present in the permitted line of oxygen, O I 7774, and in [Mg I (see Fig. 2). Our late-time spectral follow-up for some SN (Modjaz, 2007) shows that SN without double-peaked profiles (SNe 2004gk, 2004gq) do not exhibit them at any epoch, while SN with double peaks (SNe 2004ao, 2004gt) retain them over the full observed period.
The two horns are roughly symmetrically offset by 10002000 around the trough. For most SN in our sample, the trough between the two “horns” is located at nearly zero velocity for [O I] 6300Å. SN 2004ao shows an apparent blueshift and SN 1984L shows a redshift in the trough. A velocity shift of 200 (as seen for SN 2004gt) could be due to rotation of the host galaxy. We discuss other possible causes for these shifts in § 4.
3.1. Optical Depth Effects causing the Double Peaks?
Could the observed double-peaked profile be due to optical depth effects? The [O I] 6300,6363 doublet has a velocity separation of 3000 (with respect to 6300 Å) and an intensity ratio of 3:1 in the optically thin limit. Optical depth effects for [O I] 6300,6363 have been discussed in the supernova context by Leibundgut et al. (1991), Spyromilio (1991) and Li & McCray (1992). In these models, the ratio of [O I] 6300 to [O I] 6363 evolves from 1 to 3 from early times to late times as the supernova expands and the lines become optically thin, as was observed for SNe 1987A (Spyromilio et al., 1991; Li & McCray, 1992) and 1988A (Spyromilio, 1991). In Figure 3, we plot the measured ratio of the blue to the red horn for SN 2004ao, the supernova in our sample with the longest time span of observations. The ratio of line intensity decreases over time for SN 2004ao. In contrast, this ratio would increase with time if the two horns were due to [O I] 6300 and [O I] 6363, as seen in SN 1987A (Li & McCray 1992, overplotted in Fig. 3).
In SN 2004ao, where we have sufficiently high S/N- data, we also see a similar double-peaked profile in the permitted O I 7774 line and in [Mg I which are not doublets, as shown in Fig. 2. This suggests that the line shapes really do provide a guide to the distribution of oxygen and magnesium in the ejecta. Optical depth is not the probable cause for seeing two equal peaks in the [O I] 6300,6363 line profile.

4. Interpretation
We suggest a torus-like structure for either the oxygen distribution or for the radioactive energy source that excites the oxygen lines, 56Co (Fransson & Chevalier, 1989). If the distribution of the energy source were most important, we would expect to see a double-peaked profile for all the emission lines, including calcium. Since the double-peaked lines are seen only for oxygen and magnesium, the evidence favors the view that we are seeing the effects of the distribution of those elements in velocity space.
Models of the line shape that results from an expanding disk are worked out by, e.g., Gerardy et al. (2000), and Fransson et al. (2005). Comprehensive modeling of the line profiles needs to take into account viewing angle effects and the thickness of the line-emitting and expanding region. We leave that as a topic for future work.
Here we do not attempt to explain the extreme blueshift ( 2000 ) seen in SN 2005bf at epochs later than 200 days. The less extreme blueshifts seen in spectra obtained at 200 days for one of our SN (SN 2004ao) might be caused by the same mechanism that is responsible for the observed blueshifts in SN that show a single-peak line of [O I] 6300,6363. S. Taubenberger at al. (in preparation) observe in a large set of late-time spectra of 34 SN Ib and SN Ic that the oxygen line centroids are found to be blueshifted for spectra taken at 200 days. These blueshifts range up to 1500 for spectra at 90 days and go to zero with increasing time. Taubenberger et al. exclude dust formation, contamination from oth er lines and geometric effects as potential causes and invoke residual opacity effects as the most likely reason. The observed blueshift-values in our sample agree with those seen in Taubenberger et al. for similar epochs; thus, the same mechanism might be causing the blueshifts in both single- and double-peaked [O I] 6300,6363. We encourage future detailed modeling of the radiative transfer of [O I] 6300,6363 to elucidate the exact reason for the blueshift. We do not have a simple explanation for the redshift seen in the trough of the double-peaked [O I] 6300,6363 of SN 1984L.
We conclude that the most probable explanation for the double-horned oxygen profiles is a torus like, or at least flattened, distribution of oxygen, that may be a relic of the explosion physics. Energy deposition and radiation transport modeling of late-time emission in SN Ib (Fransson & Chevalier 1989) predicts that material contributing to [O I] 6300,6363 (and to [Mg I ) emission is situated further out in the ejecta than material emitting in [Ca II] 7291,7324 (see their Fig. 8). We speculate that the mechanism causing the asphericities has to affect the outer layers of the SN debris more than the inner ones. The anisotropies we observe in the oxygen lines suggest large-scale plumes of mixing rather than the small-scale inhomogeneities invoked to explain sub-structure of the oxygen lines as reported for SNe II 1979C, 1980K (Fesen et al. 1999 and references therein), in SN IIb 1993J (Matheson et al., 2000) and in SN Ib/c 1985F (Filippenko & Sargent, 1986). In the case of our observed SN, the anisotropies may be of global nature in order to give rise to such a clear double-peaked line profiles. Alternatively, in case the supernova progenitors are part of binaries, binary interaction or merger might be modulating the geometry of the supernova ejecta (Morris & Podsiadlowski, 2007).
Such a clear signature of a pure double-peaked oxygen profile has not been found in other SN Ib/c (Matheson et al., 2001), except in SN 2003jd (Mazzali et al., 2005) and in SN 2005bf. SN 2003jd was a broad-lined SN Ic without an observed GRB and showed the same double-peaked oxygen profile (Mazzali et al., 2005) as SN 2004ao (compare their Fig. 2 with our Fig. 2). Mazzali et al. (2005) interpret their observations as indicating an aspherical axisymmetric explosion viewed from near the equatorial plane, and suggest that this asphericity was caused by an off-axis GRB jet. They conclude that only special SN, those with high expansion velocities and possibly connected with GRBs, are aspherical, and use SN 2003jd as a link between the normal, spherical SN Ic and those highly aspherical ones connected with GRBs. In our sample, however, the SN showing these line profiles are normal SN Ib and even SN IIb, i.e. SN from stars with intact helium and partial H envelopes before explosion, and have normal early-time expansion velocities. Thus, it appears that asphericities are prevalent in normal core-collapse events.
Indeed, complex and ring-like velocity structures of oxygen have been observed in SN remnants (SNRs), most prominently in the oxygen-rich SNR 1E0102.27219 in the Small Magellanic Cloud (Tuohy & Dopita, 1983). Tuohy & Dopita (1983) and subsequent papers fit a twisted ring model to the spatial and velocity extent of the filaments that extents to velocities ranging between 2500 to 4000 . It is conceivable that the stellar death leading to SNR 1E0102.27219 had a geometry for the ejecta that was similar to the events we observe. Asphericities may be common in in core-collapse events, be they neutrino-driven (Scheck et al., 2006), acoustic (Burrows et al., 2006), or magneto driven (Burrows et al., 2007; Dessart et al., 2008), as indicated by polarization, neutron star kick velocities and the morphologies of young remnants. Recently, Maeda et al. (2008) also reported that double-peaked line profiles are not rare in stripped core-collapse SN. They suggested that the observed fraction of double-peaked profiles (%) is consistent with the hypothesis that all of these core-collapse events are mildly aspherical. Although their inferences are based on the results of bipolar jet models (Maeda et al., 2006), Maeda et al. (2008) suggest that a wide variety of geometries, similar to those suggested here, may be present.
5. Conclusions
In summary, we detect clear double-peaked line profiles of [O I] 6300,6363 in three SN IIb and SN Ib/c out of our observed sample of 8 and additionally, in one out of four published SN Ib. Our sample does not include broad-lined SN Ic or peculiar objects. These line profiles are probably not caused by optical depth effects, and suggest global anisotropies in the ejecta. Prior to this work, double-peaked oxygen lines had only been reported in two peculiar SN Ib/c and interpreted as off-axis GRB-jet or unipolar blob ejections. It seems more likely that asphericities are present in a wide variety of core-collapse events and they are not strictly confined to the supernovae associated with GRB jets. Although special models have been proposed to account for the line profiles in peculiar supernovae, our investigation suggests that double-peaked profiles, and underlying disks, are not unusual. These ordinary SN from our sample have a variety of subtypes, reflecting the diversity of mass loss prior to the explosion.
We recommend a meta-analysis of available nebular spectra of all core-collapse SN, spanning the full range from SN II to IIb, Ib, Ic and finally, to broad-lined SN Ic, in order to quantify the kinematics and geometry of the ejecta and to seek trends as a function of SN type. Further high-SN/N multi-epoch observations of a sample of SN II/IIb/Ib/Ic coupled with radiative transfer models should help to elucidate the observed blue- and redshifts of the line profiles.
References
- Burrows et al. (2006) Burrows, A., Livne, E., Dessart, L., Ott, C. D., & Murphy, J. 2006, ApJ, 640, 878
- Burrows et al. (2007) Burrows, A., Dessart, L., Livne, E., Ott, C. D., & Murphy, J. 2007, ApJ, 664, 416
- Dessart et al. (2008) Dessart, L., Burrows, A., Livne, E., & Ott, C. D. 2008, ApJ, 673, L43
- Elmhamdi et al. (2004) Elmhamdi, A., Danziger, I. J., Cappellaro, E., Della Valle, M., Gouiffes, C., Phillips, M. M., & Turatto, M. 2004, A&A, 426, 963
- Fabricant et al. (1998) Fabricant, D., Cheimets, P., Caldwell, N., & Geary, J. 1998, PASP, 110, 79
- Fesen et al. (1999) Fesen, R. A., et al. 1999, AJ, 117, 725
- Filippenko & Sargent (1986) Filippenko, A. V. & Sargent, W. L. W. 1986, AJ, 91, 691
- Filippenko et al. (1995) Filippenko, A. V. et al. 1995, ApJ, 450, L11
- Folatelli et al. (2006) Folatelli, G., et al. 2006, ApJ, 641, 1039
- Foley et al. (2003) Foley, R. J., et al. 2003, PASP, 115, 1220
- Fransson et al. (2005) Fransson, C., et al. 2005, ApJ, 622, 991
- Fransson & Chevalier (1987) Fransson, C. & Chevalier, R. A. 1987, ApJ, 322, L15
- Fransson & Chevalier (1989) —. 1989, ApJ, 343, 323
- Gerardy et al. (2000) Gerardy, C. L., Fesen, R. A., Höflich, P., & Wheeler, J. C. 2000, AJ, 119, 2968
- Hook et al. (2003) Hook, I., et al. 2003, in Proceedings of the SPIE., ed. M. Iye & A. F. M. Moorwood, Vol. 4841, 1645–1656
- Leibundgut et al. (1991) Leibundgut, B., Kirshner, R. P., Pinto, P. A., Rupen, M. P., Smith, R. C., Gunn, J. E., & Schneider, D. P. 1991, ApJ, 372, 531
- Li & McCray (1992) Li, H. & McCray, R. 1992, ApJ, 387, 309
- Maeda et al. (2008) Maeda, K., et al. 2008, Science, 319, 1220
- Maeda et al. (2006) Maeda, K., Nomoto, K., Mazzali, P. A., & Deng, J. 2006, ApJ, 640, 854
- Maeda et al. (2007) Maeda, K., et al. 2007, ApJ, 666, 1069
- Matheson et al. (2000) Matheson, T., Filippenko, A. V., Ho, L. C., Barth, A. J., & Leonard, D. C. 2000, AJ, 120, 1499
- Matheson et al. (2001) Matheson, T., Filippenko, A. V., Li, W., Leonard, D. C., & Shields, J. C. 2001, AJ, 121, 1648
- Matheson et al. (2008) Matheson, T., et al. 2008, AJ, 135, 1598
- Mazzali et al. (2007) Mazzali, P. A., et al. 2007, ApJ, 661, 892
- Mazzali et al. (2005) Mazzali, P. A., et al. 2005, Science, 308, 1284
- Modjaz (2007) Modjaz, M. 2007, PhD thesis, Harvard University
- Modjaz et al. (2006) Modjaz, M., et al. 2006, ApJ, 645, L21
- Morris & Podsiadlowski (2007) Morris, T. & Podsiadlowski, P. 2007, Science, 315, 1103
- Scheck et al. (2006) Scheck, L., Kifonidis, K., Janka, H.-T., & Müller, E. 2006, A&A, 457, 963
- Schlegel & Kirshner (1989) Schlegel, E. M. & Kirshner, R. P. 1989, AJ, 98, 577
- Schmidt et al. (1989) Schmidt, G. D., Weymann, R. J., & Foltz, C. B. 1989, PASP, 101, 713
- Sollerman et al. (1998) Sollerman, J., Leibundgut, B., & Spyromilio, J. 1998, A&A, 337, 207
- Spyromilio (1991) Spyromilio, J. 1991, MNRAS, 253, 25P
- Spyromilio (1994) —. 1994, MNRAS, 266, L61
- Spyromilio et al. (1991) Spyromilio, J., Stathakis, R. A., Cannon, R. D., Waterman, L., Couch, W. J., & Dopita, M. A. 1991, MNRAS, 248, 465
- Tominaga et al. (2005) Tominaga, N. et al. 2005, ApJ, 633, L97
- Tuohy & Dopita (1983) Tuohy, I. R. & Dopita, M. A. 1983, ApJ, 268, L11
- Uomoto & Kirshner (1986) Uomoto, A. & Kirshner, R. P. 1986, ApJ, 308, 685
- Valenti et al. (2008) Valenti, S., et al. 2008, MNRAS, 383, 1485
- Woosley & Bloom (2006) Woosley, S. E. & Bloom, J. S. 2006, ARA&A, 44, 507