The Complete Census of 70-m-Bright Debris Disks within the (Formation and Evolution of Planetary Systems) Spitzer Legacy Survey of Sun-like Stars
Abstract
We report detection with the Spitzer Space Telescope of cool dust surrounding solar type stars. The observations were performed as part of the Legacy Science Program, “Formation and Evolution of Planetary Systems” (). From the overall sample (Meyer et al. 2006) of 328 stars having ages 0.003-3 Gyr we have selected sources with 70 m flux densities indicating excess in their spectral energy distributions above expected photospheric emission. Six strong excess sources are likely primordial circumstellar disks, remnants of the star formation process. Another 25 sources having excesses are associated with dusty debris disks, generated by collisions within planetesimal belts that are possibly stirred by existing planets. We draw attention to six additional sources with excesses which require confirmation as debris disks. In our analysis, most (80%) of the debris disks identified via 70 m excesses have excesses at 33 m as well, while only a minority (40%) have excesses at 24 m.
The rising spectral energy distributions towards - and perhaps beyond - 70 m imply dust temperatures 45-85 K for debris in equilibrium with the stellar radiation field. We infer bulk properties such as characteristic temperature, location, fractional luminosity, and mass of the dust from fitted single temperature blackbody models. For 1/3 of the debris sources we find that multiple temperature components are suggested, implying a spatial distribution of dust extending over many tens of AU. Because the disks are dominated by collisional processes, the parent body (planetesimal) belts may be extended as well. Preliminary assessment of the statistics of cold debris around sun-like stars shows that 10% of targets with masses between 0.6 and 1.8 and ages between 30 Myr and 3 Gyr exhibit 70 m emission in excess of the expected photospheric flux density. We find that fractional excess amplitudes appear higher for younger stars and that there may be a trend in 70 m excess frequency with stellar mass.
1 Introduction
Revolutionary improvements in astronomical observing capability are directed not only towards the distant reaches of the universe, but also to our nearest neighbors beyond, and even within, the Solar System. In exploiting these new capabilities we scrutinize old paradigms in new detail. The Spitzer Space Telescope is no exception and a major science area for Spitzer has been the investigation of dusty circumstellar disks – both young primordial and older debris systems. Spitzer has unprecedented ability to detect the Rayleigh-Jeans tail of stellar photospheres in the 3-70 m mid-infrared regime – and hence small excesses above those photospheres due to circumstellar dust – since for sizable samples of nearby stars, the photometric accuracy is dominated by calibration uncertainty rather than by signal-to-noise considerations. Spitzer has thus extended our knowledge of disks beyond the brightest/nearest objects of various classes, to previously unexplored realms of completeness in e.g. volume, spectral type, and age. In particular, Spitzer has enabled statistically significant surveys for warm (TK) dust in the outer terrestrial zone (R AU) and cold (T 40-120K) dust in the Jovian/Kuiper zone (R AU) of potential Solar System analogs having a wide range of ages.
The current Kuiper Belt dust mass is estimated at in sub-cm-sized particles, based on several different measures such as: IRAS and COBE upper limits to cold emission in the ecliptic plane and associated modeling (e.g. Backman et al. 1995; Teplitz et al. 1999) of assumed 2-5000 m grains, or detections of outer Solar System dust thought to originate from the Kuiper Belt (Landgraf et al. 2002) and the dynamical model of Moro-Martin & Malhotra (2003) for 1-150 m grains. There is currently an additional in large – more than cm-sized – bodies (Gladman et al. 2001). Although the numbers are uncertain by probably 1-1.5 orders of magnitude, the above may be compared to an inferred in dust and for the large bodies during the early debris stages at a few tens of Myr (Stern & Colwell 1997; Stern, 1996b). This dust level is easily detected by Spitzer for nearby solar-type stars. In contrast, the low dust mass observed at the current solar age is not detectable.
The Spitzer Legacy program (Formation and Evolution of Planetary Systems) was designed to study the final stages of primordial disk dissipation and the development and evolution of debris disks around solar-mass stars over a range of ages. The Spitzer data include IRAC and MIPS photometry and IRS spectrophotometry for 328 sources. Approximately 55 stars in each of 6 logarithmic age bins between 3 Myr and 3 Gyr of age were observed for the program. The targets span a narrow mass range (95% are within 0.8-1.5 M⊙) in order to focus on Sun-like stars. The targets are proximate enough (d 10-200 pc) to enable a complete census for circumstellar dust comparable in quantity to predictions from simple models of our Solar System’s collisional evolution as a function of stellar age (such as that discussed in Meyer et al. 2007). Sensitivity was further maximized by choosing targets in regions of lower infrared background over those of the same age in regions of higher background/cirrus. Signal-to-noise (SNR) 30 is obtained on the underlying stellar photosphere at 3.6, 4.5, 8, and 24 m with IRAC and MIPS photometric observations while SNR 4 is achieved out to 35 m from IRS spectophotometric observations for 90% of the objects.
The main aim of is to trace dust evolution via spectral energy distribution interpretation and thereby to probe the detritus indicative of planet formation and evolution. In this contribution we focus on sources that are detected at 70 m with flux densities in excess of those expected from the stellar photosphere. Six such objects (RX J1852.3-3700, HD 143006, RX J1842.9-3532, 1RXS J132207.2-693812 a.k.a. PDS 66, RX J1111.7-7620, and 1RXS J161410.6-230542 a.k.a. PZ99 J161411.0-230536) are considered “primordial disks” and have been presented also by Silverstone et al. (2006) and Bouwman et al. (2008). These young disks have strong excess emisson not only at 70 m but also shortward, down to at least 3-8 m. We provide their data again here, for completeness and for context. However, our main focus is on the larger sample of “debris disks” which generally have weaker excess emission at 70 m, 24-33 m flux densities consistent with, or only moderately in excess of, expected photospheric values, and 3-13 m flux densities which are purely photospheric. Our debris sample includes 25 sources with significant and 6 possible sources with significant cold disk systems detected at 70 m. Of the total, 14 are newly appreciated debris disk systems announced here while the remainder have been reported previously including in contributions by Meyer et al. (2004); Kim et al. (2005); and Pascucci et al. (2006); see Table 1 for details.
We begin with a description of the Spitzer observations and data handling (§2). We then present our methods for distinguishing detections from noise at 70 m and our results in the form of: color-color diagrams, excess signal-to-noise histograms, and spectral energy distributions which demonstrate the existence of 70 m excesses indicative of cool circumstellar material (§3). We proceed to analyze the spectral energy distributions in terms of single-temperature blackbody models and argue that in 1/3 of the cases multi-temperature models indicative of a range of dust radii, are a better match to the data than are the narrow ring implied by single-temperature models (§4). Our modeling results indicate dust temperatures typically 85 K which imply, depending on the stellar parameters, corresponding dust inner radii typically 5-50 AU and (poorly constrained) dust outer radii typically several hundred AU. Comparison (§5) with inferred parent star ages of the theoretical time scales for dust depletion mechanisms such as: inward drag due to Poynting-Robertson (P-R) or corpuscular effects, outward push due to stellar radiative or mechanical effects, and in situ collisional destruction, suggests that the dust is continuously generated debris resulting from collisions among an unseen population of planetesimals. Planetesimal orbits can be perturbed either by the largest embryos in the planetesimal population or by planetary mass bodies, generating in both cases a steady state collisional cascade. Alternately, debris dust may be the result of individual, large catastrophic collisions that artifically raise the mass in small dust particles over steady state evolution values. Trends in debris disk detections with stellar age and mass are investigated (§6). Finally, we place our results into a larger context in §7 and then conclude in §8.
2 Sample, Observations, and Data Processing
The program utilized all three Spitzer science instruments – IRAC, IRS, and MIPS – to observe 328 solar-type stars. Meyer et al. (2006) provides a description of the observing strategy. Among the sample are 15 previously suspected (based on IRAS or ISO literature) debris or long-lived primordial disk systems, only 11 of which are in fact confirmed by Spitzer. Ten of these 15 were observed by for the purpose of probing primordial gas disk dissipation (e.g. Pascucci et al 2006, 2007) while the others were either serendipitously on our lists or discovered as excess sources after the program was submitted. The sources selected ab initio because they were claimed to exhibit infrared excess emission can not be included in statistical analyses of Spitzer data for debris characteristics as a function of e.g. stellar age, stellar mass, stellar metallicity, stellar rotation, etc. However, we do include them in this paper which presents disk detections and simple dust models.
Carpenter et al. (2008b) provides a detailed discussion of realized observation, data reduction, and data validation procedures. We review here only those details of particular relevance to the present discussion of 70 m excess. Four sources – HD 17925, HD 72905, HD 202917, HD 216803 – were observed at 70 m not by but instead by the GTO program described by Bryden et al. (2006) who employ the same observing strategy as is standard for ; the data were obtained from the Spitzer archive and processed using standard techniques. These particular sources were included in for the purpose of the gas disk dissipation experiment discussed above. MIPS 160 m photometry was obtained by the project for a sub-sample of the full target list. It derives for most of the sources discussed here from follow–up Spitzer GO-2 and GO-3 programs in which additional 160 m data 111 MIPS 160µm data from GO-2 and GO-3 followed the standard observations, using 10 sec exposure time per data collection event with 2–4 cycles (typically 4). Raw data were processed with SSC pipeline S14.4.0 and the MIPS DAT pipeline (Gordon et al. 2005) version 3.02. The final mosaic image has 8″/pixel. The flux conversion factor from instrumental units to MJy/Sr) is 44.7 and the absolute calibration uncertainty is 12% (http://ssc.spitzer.caltech.edu/mips/calib/conversion.html). For aperture photometry we used an aperture radius of 24″, a sky annulus spanning 64-128″, and an aperture correction of 2.380. Uncertainty was calculated by propogating the measured root-mean-square deviation in the sky area over the source aperture. was obtained for sources with detected 70 (and/or 33) m excesses.
Exposure times at 70 m were 10 seconds per data collection event or image, with 8 images taken per cycle. The number of cycles varied between (1, for the four GTO targets) 2 and 14 in order to reach the desired depth. Our original intent to detect photospheres at 70 m was predicated upon pre-launch sensitivity estimates. However, the higher than expected rate of large cosmic-ray hits reduced the on-orbit sensitivity by about a factor of three (Rieke et al. 2004), so we attempted instead for each of our targets to reach a common sensitivity relative to an estimate for the outer Solar System dust level at the age of the star (see §3.1).
Spitzer data were processed initially by the Spitzer Science Center pipeline S13. Post-pipeline processing of IRAC, IRS, and MIPS data, including further reduction details, photometry/spectral extraction, error derivation, and flux density calibration discussions are all given in Carpenter et al. (2008b); see also Kim et al. (2005) for 160 m procedures. The photometric uncertainties are also discussed in Carpenter et al. (2008b). They were assessed for the IRAC and MIPS 24 m data by computing the error in the mean of the flux densities derived from individual frames, with an adopted floor. These (presumed) photometric uncertainties are then validated by examination of flux density histograms and of source colors. For MIPS 70 m data, the photometry was performed not on individual images as for data at all other wavelengths, but on the final stacked/mosaicked image only, with the error calculated by propogating the measured root-mean-square deviation in the sky area over the source aperture. Thus the only validation of the internal uncertainty comes from the Kurucz model comparison (illustrated below). The random errors in the photometry at 70 and 160 m were estimated from the square root of the variance observed in the sky annuli of the final resampled mosaics for these background–limited observations. After careful analysis we find that the MIPS 70 m internal uncertainties must be inflated by a factor of 1.5 to account for the scatter in the quantity (data - model), as discussed in detail in Carpenter et al. (2008a). Calibration uncertainties were taken from the Spitzer Observers’ Manual version 7.0 (2% for the IRAC bands, 4% for MIPS 24 m and 7% for MIPS 70 m ) and dominate the error in our absolute photometry for sources with SNR 1/ (see Table 2 for relevant details). We make use of internal and internal calibration uncertainties at separate points in our analysis. For comparison between simple models and the data, we also use synthetic photometry points constructed from the IRS spectrophotometric data (S14 processing) with square bandpasses of 12-15% width centered at 13 and 33 m (flux-weighted average wavelengths 13.17 and 32.36 m, assuming a Rayleigh-Jeans spectral energy distribution).
3 Identifying 70 m Detections and Excess Sources
In this section, we first establish the reliability of the 70 m source detections and their association with the intended target. We consider sensitivity, cirrus, and confusion as limitations. The possible detections at 70 m are defined by: 1) photometric measurements with SNR 2 at 70m using internal errors, 2) visibility to the human eye and point source morphology on the 70m images, and 3) positional alignment with the corresponding 24 m point sources. From the detections at 70 m, we then define via color-color diagrams and excess signal-to-noise histograms the sub-sample with SNR 2 excesses at 70 m, using both internal and calibration errors. Finally in this section, we present spectral energy distributions for these sources. Table 1 contains our 70 m excess candidates and includes notes on several sources for which the determination of excess detection in 70 m is not straightforward.
3.1 Sensitivity Considerations
achieves photospheric sensitivity with SNR 30 for 100% of the program objects at all Spitzer broad band wavelengths 24 m, and with SNR 3 for 90% of the program objects in IRS spectrophotometry out to 35 m. At 70 m, however, detecting photospheres of solar type stars at distances greater than about 12 pc is not feasible in the launched version of Spitzer in less than several hours of integration. As our targets range from tens to hundreds of parsecs, a very small fraction of our sample was proximate enough for detection at 70 m in the absence of excess emission. A few such photospheres are indeed detected: HD 13974 (11 pc) and HD 216803 (7.6 pc), the latter observed as part of GTO time (Rieke), and also potentially HD 17925 (10 pc) which is noted below as only a low significance excess object.
Our integration times (§2) were chosen to be sensitive to a minimum dust level relative to that inferred for dust in our own Solar System (e.g. Landgraf et al. 2002) as it appeared earlier in its evolutionary history. Such evolution has been described as having a power-law behavior in certain regimes – roughly until collisional equilibrium is reached, transitioning to by several hundred million years, then to beyond a few billion years (cf. Dominik and Decin, 2003; Wyatt, 2005). These canonical regimes are well sampled by the age distribution. A realistic model has more structure than the simple power-law estimates above, which are just guides to the behavior. The simulations that we used (Backman et al., private communication; see also Meyer et al. 2007) assume an initial planetesimal belt of 30 M⊕ distributed between 30 and 50 AU that undergoes collisional evolution; material is subsequently parsed according to a Dohnanyi (1969) fragment mass distribution down to small sizes. For a fiducial source at distance 30 pc and luminosity 1 L⊙, the dust evolution predicts a change in 70 m flux density from 180 to 50 mJy for source ages between 150 and 1500 Myr. Given the actual age and distance/luminosity distribution of our sample, approximately 1/3 of our targets are younger than 150 Myr and almost all targets 150-1500 Myr have 3-sigma sensitivity at 70 m exceeding this dust model. Our survey is sensitive to dust emission 5 greater than that estimated from the projected young Solar System model for most of the remaining 2/3 of the targets, and sensitive to 10 greater emission for all but a few (with the limitations primarily driven by the increased distance range required to find young targets). For older (nearby) stars, our survey was sensitive to dust emission roughly 5-20 times the current Solar System level (or 9-36 mJy in the excess, for the fiducial source above).
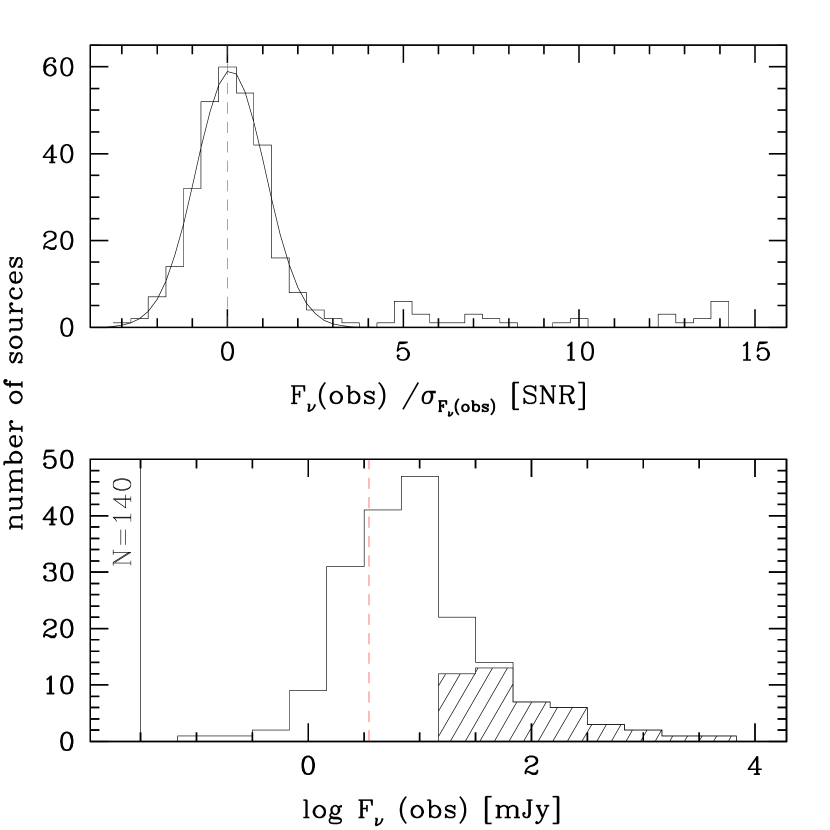
Figure 1 shows for the full sample of stars observed under the auspicies of , the distribution of signal-to-noise at 70 m and the distribution of measured 70 m flux density, separately for detections and non-detections. There is significant overlap among the detected and non-detected flux densities due to source-to-source variation in astrophysical background, the main sensitivity limitation. The typical 2-sigma non-detection has measured flux density about 5-10 mJy (median noise = 9 mJy) while the typical 2-sigma detection has measured flux density 30 mJy (median = 60 and mean = 80 mJy). The 2-sigma level is used rather than a more stringent 3- or 5-sigma threshold in order to identify all reasonable candidate 70 m sources, including those that require confirmation.
Assuming our (estimated) uncertainties are accurate, for our sample of 328 sources we expect 1 to fall above 3-sigma and 8 to fall above 2-sigma if the data follow a gaussian distribution. Therefore, 7 should fall between 2- and 3-sigma. We observe 33 sources above 3-sigma and 11 sources between 2- and 3-sigma. Accordingly, possibly 1 of the 3-sigma detections and probably most of the 2-3 sigma detections are noise, and should be treated with caution. Only a portion of the latter survive our other cuts for source detection (image visibility and positional alignment), and are subsequently identified as objects with excess emission. They are noted in Table 1 as those also having excess SNR between 2- and 3-sigma (except for HD 17925 which is a 4.6-sigma detection in observed flux density but only a 2.9-sigma significant excess).
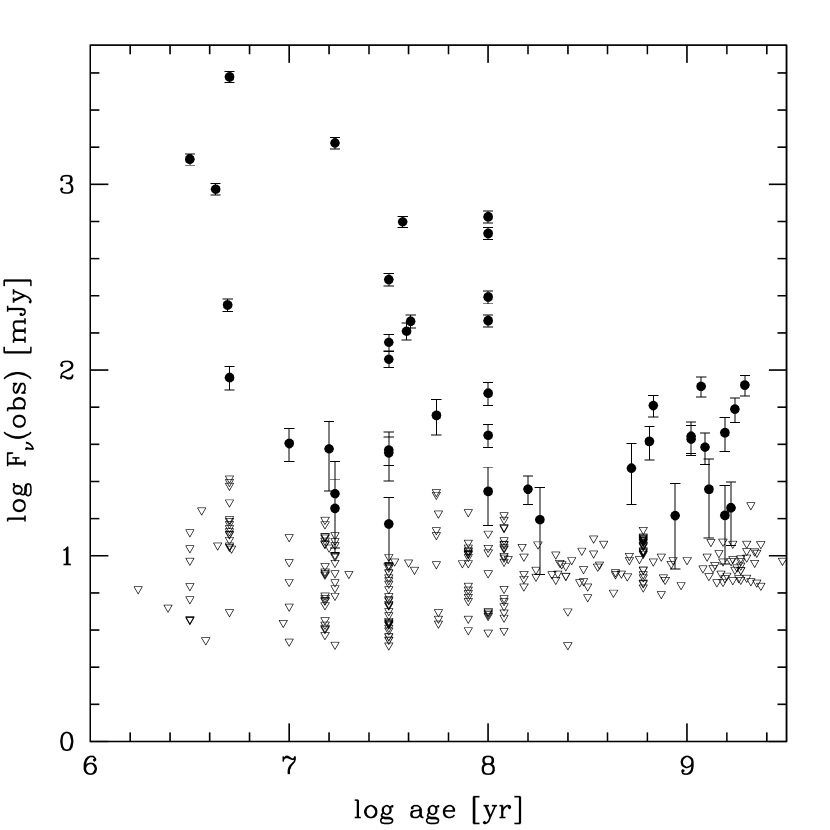
Approximately 10% of targets are detected at 70 m and the remainder are undetected, having flux density upper limits. 222We note that some of the sources represented here as upper limits at 70 m have been identified as having dust excesses from IRS data and subsequently were detected at 70 m in deeper follow-up observations conducted by the team through GO programs (see Kim et al. 2008). In Figure 2 we illustrate the measured flux densities and 1 noise values, versus source distance and stellar age. No trends are apparent in the relative distribution of the upper limits with these variables. This is consistent with the interpretation that our sensitivity at 70 m is dominated by infrared background and cirrus effects, as expected. A K-S test comparing the distributions of photometric background for the detected and non-detected sources indicates that they might not be consistent with having been drawn from the same parent population (P(d) a few percent). However, the distance and age distributions of detected and nondetected sources are both consistent with having been drawn from the same parent based on the K-S test ( a few percent), the distances being potentially more distinguishable than the ages. The only obvious trend in Figure 2 is that younger sources (which typically are more distant than the older sources in our sample) tend to have a larger upper range to their 70 m flux densities, (indicating higher values of ). We return to this point in §6.1.
3.2 Cirrus and Confusion Considerations
We take care to ensure not only the detection of signal above the noise at 70 m, but that the signal is from the intended target. Peaks in the galactic cirrus structure or confusion with extragalactic contaminants are considerations at 70 m.
Each candidate 70 m source was thus inspected by-eye to check for point-like appearance. No obvious examples of resolved extended emission, which could indicate contamination from cirrus, were identified. Such emission can also be identified via relative photometry in larger vs smaller apertures. As reported in Carpenter et al. (2008b), two sources are identified with larger than expected flux ratios in photometry derived from bigger versus smaller apertures. Both are confused by nearby 70 m bright objects which were removed by PSF fitting before the final photometry of the target was measured and reported. Based on this analysis, cirrus contamination is an unlikely explanation for the 70 m point source detections reported here.
The MIPS 70 m FWHM is 16” (9.8” pixels) compared to 5”.4 FWHM (2”.5 pixels) at 24 m. Because of the dependence of diffraction on wavelength, a 70 m source near the center of the MIPS field may not be spatially coincident with the targeted source that is detected with a higher accuracy centroid and at higher SNR at shorter wavelengths. Unassociated contaminants such as AGN and ULIRGs have 70/24 flux density ratios of 0.5-3 (e.g. Frayer et al. 2006), similar to those observed for our sources (e.g. Figure 4 below) which we interpret as due to circumstellar dust disks. Thus comparing the centroids of detections at 24 and 70 m is particularly important. The absolute pointing of Spitzer’s focal plane array pixel centers is assessed by the Pointing Control System, which is astrometrically tied to the 2MASS survey. The 1 uncertainties on the absolute pointing reconstruction are better than 1”.4 at 24 m (1/4 beam) and 1”.7 at 70 m (1/10 beam). Therefore, 24 m coordinates should be within 1”.4 of corresponding 2MASS sources and the difference between 24 and 70 m positions should be in the high SNR limit. Measured positional offsets thus provide a good, though not robust, discriminant between associated and unassociated sources. We use the 24 m and 70 m images for this comparison in order to keep the relative investigation to within the Spitzer focal plane and free of absolute positional calibration.
Figure 3 shows the right ascension and declination offsets between the 24 m and 70 m point source positions. At 24 m, pixel positions were determined from Gaussian centroiding and the corresponding RA and DEC derived from the distortion-corrected image headers. At 70 m, Gaussian centroiding was applied to a 44” squared region centered at the expected source position. In Figure 3 two sources (HD 141943 and HD 70573) are rather large outliers, 1/2 of the 70 m beam size, while two others (HD 206374 and HD 201219) are offset by 1/4 beam. The empirical 1 scatter in Figure 3 is 2”.47, roughly 10% higher than the minimum 2”.2 from above. We implement a cutoff of 2”.75 (2 sigma) to consider a 70 m detection as being coincident with the source seen at 24 m. We retain HD 201219, however, as its known companion, which has been subtracted for photometry purposes, still influences the 70 m image centroid. We also retain HD 206374 which is in the low signal-to-noise regime and thus a large offset is possible.
We also consider the probability of false association of the 70 m point source with the target even when there is apparent spatial coincidence with a 24 m point source that can be robustly associated itself with the intended target – both positionally and, in many cases, by having the expected photospheric flux density. We estimate the probability of a chance superposition with a background galaxy that dominates the flux at 70 m, adopting the methodology of Downes et al. (1986). For a surface density of objects having flux densities, , brighter than , the probability of finding one of these galaxies within radius of the target is given by the Poisson distribution . From Dole et al. (2004a), we expect , , and galaxies per sq. arcmin at 70 m flux density levels of 10, 50, and 100 mJy, respectively, or 2.1, 0.2, and 0.06 galaxies per MIPS 70 m mosaic (20 sq. arcmin after combining several individual 2’.6 x 5’.25 raster images). Considering the data set as a whole, approximately 1/3 of all (324 visually examined) 70 m mosaiced images have an obvious source somewhere in the field, with 1/3 of these 1/3 (or 40 sources) within 1/2-beam width of the image center, the expected position of the target. Among the near-coincident sources we observe 0, 18, and 26 sources at flux density levels 10, 50, and 100 mJy with 14 sources 100 mJy. (including those with the relatively large offsets noted above). Thus, the probability of a chance superposition of a galaxy within our search radius of 2”.75 emitting mJy is , , per object. This corresponds to a probability of 24%, 2% and 1% that one target is contaminated at the 10, 50, and 100 mJy levels respectively, for the whole sample of 328.
At 24 m, the faintest detection among our 328 targets is 1 mJy. The 24 m surface density due to extragalactic objects at 1 mJy is per sq. arcmin (Papovich et al. 2004), implying a maximum probability per star of for a faint galaxy within 2”.75 contributing to the measured 24 m flux density (using the radius appropriate to the agreement between the 24 m and 70 m positions; Figure 3). Despite having a higher potential than at 70 m for extragalactic contamination, our 24 m sources in most cases have flux densities consistent with expected photospheric emission; this argues that they indeed emanate from the intended target. For those with measured excesses at the mJy level, there is a 33 % chance that one source suffers extragalactic contamination among the sample as a whole.
3.3 Color-Color Diagrams
Color-color diagrams are an efficacious way to identify objects with unusually red colors due to circumstellar dust. In Figure 4 we show several different flux ratios involving the 70 m band observed with Spitzer. As mentioned above, the 70 m data are dominated by upper limits. For clarity, we therefore indicate separately the maxima and the measured colors involving 70 m photometry. Although we can not use exclusively these color-color diagrams to identify 70 m excess sources, we can employ them in a rudimentary assessment of the hot, warm, and cold dust components in the circumstellar environments of sources.
The top panels of Figure 4 show 4.5/3.6 m and 70/3.6 m flux density ratios; the abscissa is approximately photospheric for the great majority of stars while the ordinate is sensitive to cool dust. The few red outliers in the 4.5/3.6 m flux density ratio are also amongst the reddest objects in the 70/3.6 m flux density ratio, as expected if they have both hot inner and cool outer dust. These sources exhibit evidence for primordial (gas–rich) disks. In contrast to the narrow 4.5/3.6 m flux density ratio, there is a large range in the 70/3.6 m flux density ratio for those stars detected at 70 m (top right panel), but an equally large range in the distribution of color limits (top left panel). Notable is the admixture along the ordinate of the detections and upper limits. Even accounting for the fact that the limits are plotted at 1 levels (consistent with Figure 2) while the detections are all 2-3, the most stringent upper limits in the top left panel appear a factor of several lower compared to the detections reported in the top right panel. Such variation along the ordinate among the detected sources likely reflects real differences in debris disk properties. Recall, however, as argued above based on K-S statistics, that variation in source background may play a significant role in 70 m detection despite our attempts to observe the lowest background sources of given age and distance.
The middle and lower panels of Figure 4 illustrate 70/24 vs 24/8 m and 70/33 vs 33/24 m flux density ratios. Again, by comparing the left and right panels it can been seen that 70 m detections are interspersed in color with 70 m upper limits. Further, a subset of the stars is redder in the 24/8 m and/or 33/24 m flux density ratios compared to the bulk of the sample. These are “warm” excess sources. Some but not all such objects are also detected at 70 m, which enables better constraints on the bulk dust characteristics than in cases in which the excess is detected in only a single band.
Our focus in this paper is on the sub-set of objects with excesses detected at 70 m. Typically these sources are blue along the abscissae of Figure 4, implying that they are close to photospheric at wavelengths shorter than 24-33 m. Several of the brightest debris disks in our sample (specifically, HD 61005, HD 107146, HD 38207, HD 191089, HD 104860) can be distinguished in the color-color plots; however, additional analysis is needed to identify most debris disk candidates.
3.4 Excess Signal-to-Noise Histograms
The majority of sources detected at 70 m are dominated by the circumstellar contribution to the flux density. However, the photospheric contribution at 70 m is not negligible for all sources, and must be modeled accurately in order to characterize the excess. We employ a Kurucz model of the underlying stellar photosphere in order to more robustly identify individual objects with 70 m excess than is possible from color-color diagrams and to analyze the signal-to-noise in the excess.
As described in more detail by Carpenter et al. (2008b), available BV (Johnson, Tycho), (Stromgren), Hp (Hipparcos), RI (Cousins), and JHKs (2MASS) photometry data were used in combination with initial estimates of temperature, surface gravity, and metallicity based on spectroscopic data from the literature, to find a best-fit Kurucz model. Kurucz model flux densities were converted to magnitudes in each of the available optical/near-infrared filters via multiplication with the combined filter, atmospheric transmission, and detector response curves as in Cohen et al. (2003a,b and references therein). In general, surface gravity and metallicity were fixed at log g = 4.5 cm/s2 and [Fe/H]=0.0, and the effective temperature and normalization constant were the fitted parameters. The line-of-sight extinction was fixed to A for stars within 75 pc; beyond this distance AV was initially estimated from the literature but then varied as a free parameter in the fits for all stars not in clusters or with estimated ages younger than 30 Myr (which may suffer some obscuration). Best-fit was defined in a least-squared sense. The formal uncertainty in the resulting photospheric projection to the Spitzer bands is typically 2-3%.
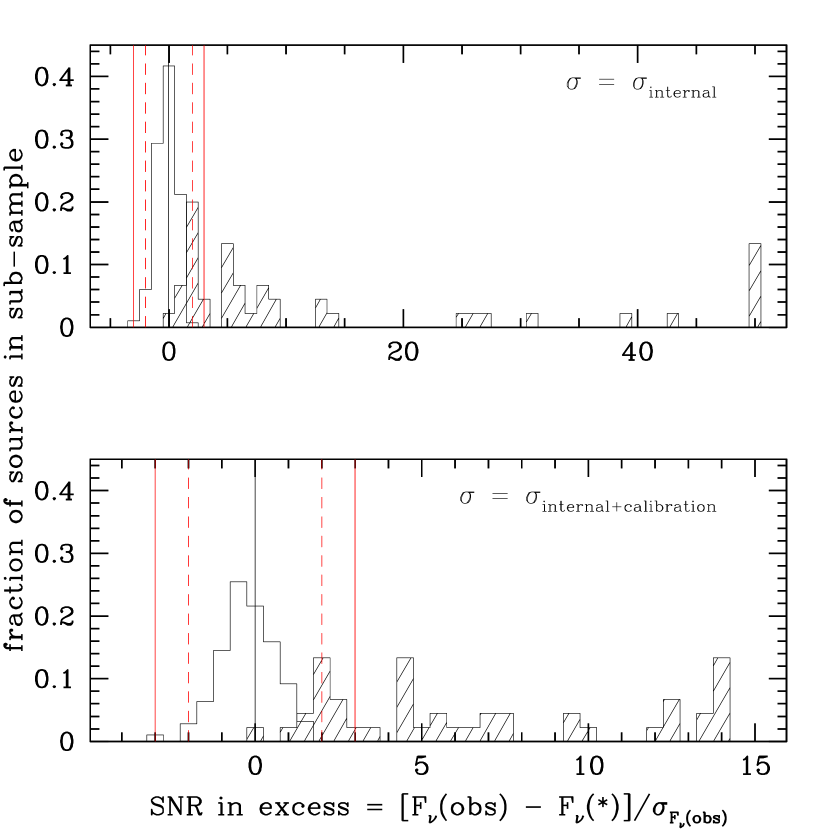
With a model of the expected photospheric flux, the excess above the photosphere is computed as the difference between the observed and Kurucz in-band flux densities. The signal-to-noise in the excess is defined as this difference divided by the root-sum-squared error in the observed flux densities and the photospheric projection. Figure 5 shows histograms of the resulting signal-to-noise in the excess at 70 m. The excess SNR distribution for the nondetections and indeed for the full sample is peaked near zero, suggesting the expected dominance by photometric noise at this wavelength. The median, mean and dispersion of the distribution are: -0.25, -0.22 and 0.84, in units of SNR. The 70 m excess sources have median, mean and dispersion of 6, 15, and 17 in units of SNR. Using only the internal uncertainty, the significance of the detected excesses can be as high as SNR=50, while using the total uncertainty (root-sum-squared of common calibration and individual internal uncertainty terms), no source has excess SNR10
We have defined a sample of 70 m excess sources as follows. The excess signal-to-noise distribution of Figure 5 is centered near (but not exactly at) zero with dispersion that is close to (but not exactly) the value of unity that would be expected from Gaussian noise (including the imposition of an additional 50% scale factor in the 70 m flux density uncertainties as discussed in §2). We therefore consider most robust those sources which have (formally 99.6% confidence) excesses at 70 m when they are apparent from both the internal–only and total uncertainty assessments. These are our “Tier 1” sources. Our “Tier 2” sources are those with excesses at 70 m. That the mean in Figure 5 is significantly (with respect to the error in the mean) negative suggests a systematic offset with respect to the Kurucz models, in the sense that we are somehow over-correcting for the photosphere. This may indicate that some of the 2-3 excess sources we have designated in Table 1 are in fact slightly more significant, by 0.22 sigma, than our estimates.
Note in Figure 5 that no sources have excess SNR -3 and seven have excess SNR between -3 and -2, while thirty-one sources have excess SNR 3 and six have excess SNR between 2 and 3. 333 We can compare these excess detection numbers (31 and 6) to the source detection numbers at these same significance levels (33 and 11, as reported in §3.1). The number of 2-3 significant excess sources is seemingly consistent with random noise, both empirically and from gaussian statistics. We note these sources with caution, and distinguish them clearly as “tier 2” objects in the remainder of this paper.
3.5 Summary and Spectral Energy Distributions
In summary, we find 31 primordial and debris disk targets with excess . Excess between 2 and 3 is measured for an additional 6 candidate debris excess objects. These sources meet, in addition to the flux density criteria, the point-like appearance and positional coincidence requirements stated earlier. In Table 1 we present the 70 m excess sources selected as described above, along with the stellar parameters (distance, spectral type, luminosity, and age as adopted by ). In Table 2 we present corresponding Spitzer photometry (measured flux densities, uncertainties) and in Table 3 the calculated excesses and significances above the adopted model stellar photospheres at 13, 24, 33, 70, and 160 m. Of the sources selected to have 70 m excess attributed to debris dust, more than half, less than half, and a single source also have significantly measured excesses at 33, 24, and 13 m respectively; none of the debris disk candidates has excess detected at 8 m. 444Carpenter et al. (2008a) discuss additional sources within our 70 m excess sample with low amplitude excesses at wavelengths 35 m which were not apparent from our analysis comparing to Kurucz models. The excess amplitudes at 70 m range from 1.6 to over 300 times the photosphere (median is 20 times photosphere), while at 33 m the median excess amplitude is equal to (100% of) the photosphere, at 24 m it is 40% of the photosphere, and at 13 m 17% of the photosphere.
Several sources deserve specific comment. First, some objects selected for the probe of disk gas evolution based on claimed IRAS- or ISO-based 60 and/or 90m excesses are not confirmed from this analysis with Spitzer. These include ScoPMS 214 555Carpenter et al. (2008a) find that this source has weak MIPS/24 m and IRS excess, HD 41700, HD 216803, and HD 134319, which were discussed in Pascucci et al. (2006). We include these 4 objects in Table 1 for completeness, but they do not appear in subsequent Tables or Figures. Second, there are additional sources selected for the gas experiment for which is not obtaining 70 m observations because the objects are part of GTO programs with MIPS (HD 216803, HD 202917, HD 17925, HD 72905). These objects exhibit excess emission based on Spitzer data and are included in Table 1 and our subsequent analysis.
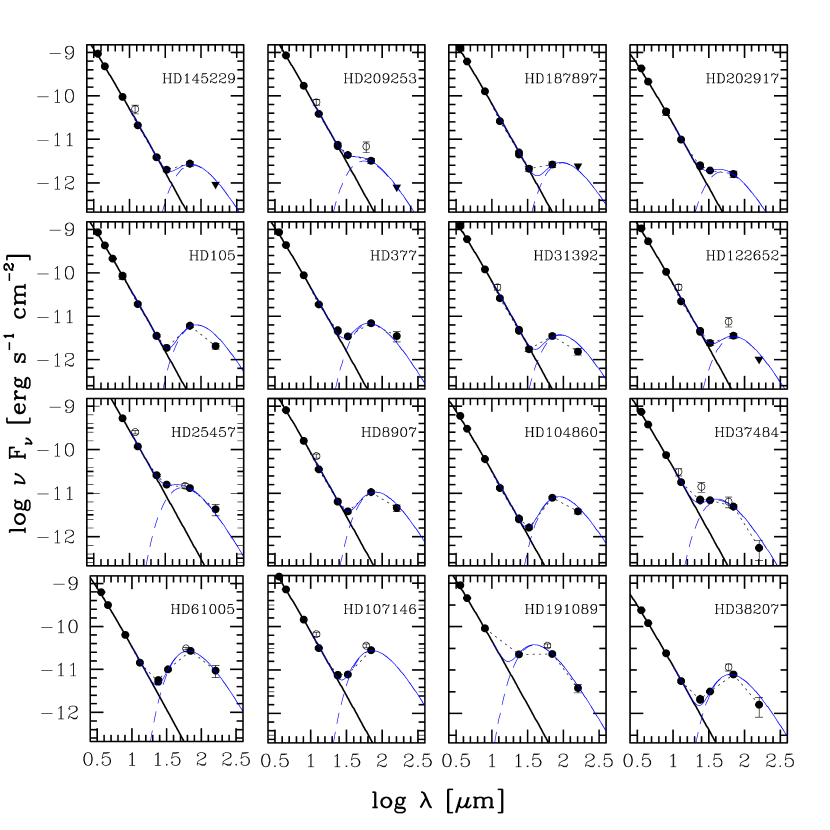
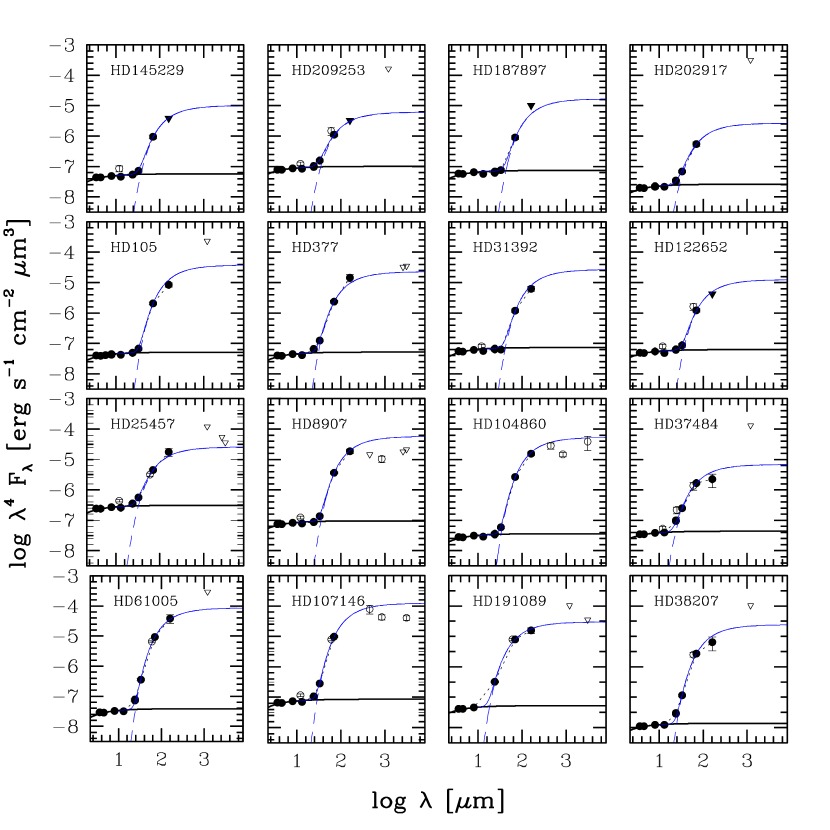
In Figures 6 and 7 we present spectral energy distributions for the 70 m excess sources. Included are ground-based data from Tycho and 2MASS along with newly presented Spitzer IRAC, IRS, and MIPS photometry and IRS spectrophotometry. Simple blackbody dust models as discussed in the next section (§4) are also overplotted.
There are six 70 m excess sources shown in Figure 6 with large excesses that are broad in wavelength and associated with some of the youngest stars in our sample. These are likely primordial disks (see Silverstone et al. 2006 and Bouwman et al. 2008). While the four strongest (in terms of monochromatic excess) of these six are in fact the largest 70 m excess sources amongst the entire sample, two of the six (PZ99 J161411.0-230536 and RX J1842.9-3532) are weaker at 70 m and have inferred lower than several (much) older debris disks.
There are 25 70 m excess sources shown in Figure 7 which are debris disk candidates having significance in the 70 m excess. A further 6 have but significance (see Table 1). The spectral energy distributions are photospheric over several octaves in wavelength with evidence of infrared excess only longward of 13 m. Of these 31 total sources, 7 were presented in various earlier papers and 10 in literature previous to that; thus 14 debris disks are newly announced here from . For this ensemble, detections and upper limits at sub-mm and mm wavelengths, where available from other investigations of targets (e.g. Williams et al. 2003; Carpenter et al. 2005, Najita et al. 2005), are included in Figure 8 which plots the energy distributions in units where the long wavelength Rayleigh–Jeans tail of the Planck function is flat.
4 Debris Disk Modeling
Having selected a sample of objects likely to be surrounded by cool dusty material, we proceed in this section to model the plausible radial distribution of the dust around these stars using basic assumptions. We take the simplest possible approach to modeling the data and add complexity only as warranted. We consider the scenario in which a dust grain of given size and composition is in thermal equilibrium with the stellar radiation field. We assume emission from optically thin ensembles of grains, which we justify post facto by the resulting low fractional excess luminosities (L).
First we consider single temperature blackbody fits, which have the minimum number of free parameters, to the observed excess emission (§4.1), then we explore multi-temperature models for selected sources (§4.2). In §4.3 we summarize results from more detailed modeling pursued elsewhere within the program using sophisticated radiative transfer dust models with many free parameters, including grain size distributions. In §4.4 we discuss upper limits on the amount of dust potentially located interior to our inferred inner disk annuli.
4.1 Single Temperature Models
The observed excesses are most prominent at wavelengths around 70 m, as illustrated in Figure 7. High precision Spitzer photometry at shorter wavelengths generally samples the Wien side of the blackbody function. data include IRS spectrophotometry which represent a higher resolution sampling of the spectral energy distribution from 5-35 m; these data allow accurate determination of the wavelength at which the departure from a photospheric model occurs as presented in Carpenter et al (2008a). Here, we use simple blackbody fitting to color temperatures (including synthetic IRS-13 and IRS-33 m bands). Many of the debris disk sources are detected at 160 m as well, providing information past the excess peak (Rayleigh-Jeans regime).
4.1.1 Dust Temperature
We calculate color temperatures , defined as the blackbody temperature required to fit the flux ratios in the excess above the photosphere, at 24-33, 33-70, and 70-160 m. We also tabulate 13-33 m color temperatures, which we choose over 13-24 m for two reasons: first, data from a single instrument are used, avoiding systematics due to calibration, and second, in practice the 13-33 m flux ratio provides a tighter upper limit on the maximum color temperature than the 13-24 m flux ratio. The color temperatures are considered measured values when the excess is at both the shorter and longer wavelengths, and limits when the excess is at one of the two wavelengths but at the other. For example, some stars have 33 m photometry consistent with purely photospheric emission; in calculating a 33-70 m color temperature we are assuming, therefore, that the infrared excess begins just longward of 33 m. In such cases we determine the maximum color temperature from the minimum wavelength of infrared excess onset. The significance values include total uncertainty on the photometry (internal measurement plus calibration error) and the formal uncertainty on the photosphere (2-3% is typical).
The various fits are given in Table 4, along with the values resulting from a fit of a blackbody having this temperature to the broader excess spectral energy distribution from 13-160 m; the number of data points used to calculate reduced is 4 or 5 in almost all cases. Mean (median) color temperatures for 24-33, 33-70, and 70-160 m are 101.6 (92.5)K, 73.1 (59)K, and 61.6 (56.5) K, respectively, including the limits, which implies that the mean (median) values above are also upper limits. As cited in the MIPS data Handbook (Table 3.11 in version 3.2), color corrections for source temperatures of 50-100K are in the range 2-11% depending on photometric band (24, 70, or 160 m). The color temperatures calculated for color-corrected photometry are different by only 0.5-3 K from those calculated without the inclusion of color terms; in most cases these are within or comparable to the formal errors on the color temperature as calculated from the photometric/photospheric uncertainties (see Table 4). As our blackbody analysis is meant to be illustrative of the dust properties characterizing our debris disk sample rather than definitive, we have not applied color corrections to individual sources. Given the systematic differences in color temperature across the spectral energy distribution of some of the excesses, this seems prudent.
As is evident from the Table, short wavelength excesses are rare among the sources with 70 m excess. None (among the debris disk sample) exhibit 8 m excess within our errors. Only HD 202917 exhibits possible 13 m excess at a level (just 2.2). All other 13-33 color temperatures in Table 4 are upper limits, and produce very poor values when used to fit the overall energy distribution as might thus be expected. At 24 m, approximately 1/2 of the 70 m excess sources are also in excess, while at 33 m approximately 2/3 of the 70 m excess sources are also in excess; thus about 1/2 of the 24-33 m and 1/3 of the 33-70 m color temperatures are upper limits.
In some cases the color temperatures derived from the flux ratios at different wavelengths agree quite well, for example HD 104860, HD 8907 and HD 209253. In other cases, such as HD 377, HD 38207 and HD 85301, the three color temperatures are very discrepant and none produces an adequate fit to the overall spectral energy distribution. The general trend among our sources is of cooler color temperatures inferred from the longer wavelength data and hotter temperatures derived from the shorter wavelength data. 666Of note is that the (modified) blackbody dust temperatures fitted by Carpenter et al. (2008a) to 5-35 m IRS spectrophotometry (as opposed to just the synthetic 13 and 33 m “photometry” points used here) are in every case intermediate between those of our 13-33 m and 24-33 m values. Furthermore, Carpenter et al. (2008a) find that the fits to 5-35 m IRS data underpredict the 70 m excess by for 3/4 of the sources for which data are available. The systematic discrepancies are suggestive of a physical effect rather than resulting from data errors; further, the phenomenon of inconsistent color temperatures is not due to the presence of prominent spectral features, as none are detected in our SNR spectra from IRS. It should also be noted that we would expect the same blackbody that fits the shorter wavelength points to also fit the longest wavelength 160 m point only if the grains are as large as 20 m; smaller grains that produce blackbody times emissivity (1) would underpredict this flux density.
We offer an explanation for the temperature discrepancies in terms of multi-temperature dust located over a range of radii, in the next section. In the remainder of this section we interpret the color temperatures derived from the 33-70 m flux ratio as the fiducial, characteristic, dust temperature (Tdust) that represents the bulk of the excess spectral energy distribution. In several cases noted in Table 4 (e.g. HD 22179, HD 35850, HD 37484, HD 85301, MML 17 in addition to HD 141943 and HD 209253) the values resulting from the (hotter) 24/33 color temperature models are 2 and are comparable to, or better in some cases, than those for the 33/70 color temperature models. In one case (HD 31392) we adopt the 70/160 color temperature model.
4.1.2 Dust Location and Luminosity
For the assumed blackbody case, simple radiative balance suggests
where is the radial distance of the dust from the star, is the dust temperature and is the stellar luminosity 777 Allowing for smaller, non-blackbody grains with emissivity ( is in the range 0.5-2 whereas for blackbody grains) would increase the grain temperature at a given distance from the star. This would mean that derived dust radii would increase relative to the blackbody case having for the same fitted dust temperature. Specifically, for graybody grains which are efficient absorbers and inefficient emitters and for those which are inefficient absorbers as well as inefficient emitters, as is the case for very small ISM-like grains, derived from formulae in Backman & Paresce (1993). . With from the Kurucz model and assumed to be the color temperature of the infrared excess as derived above, the dependent variable can be calculated. The dust luminosity, Ldust, is then estimated using Tdust, Rdust, and the Stefan-Boltzmann relation. For single temperature blackbody emission this is a more precise method than trapezoidal integration of the measured excess flux densities which results in only a minimum value for Ldust. Finally, , the fractional infrared excess, is derived.
Table 5 lists the inner radii corresponding to the assumption of large (relative to wavelength) grains along with corresponding values of fractional dust excess. Formal error propagation from the dust temperature and stellar luminosity uncertainties into those for the dust radii, Rdust, reveals uncertainties of 10-35% but we emphasize that these radii are only notional minimum values derived under the strong assumption of blackbody grains. They are lower limits as smaller grains would achieve the estimated temperatures at larger radii 888Specifically, for a typical source such as HD 105, the formal uncertainty in the fitted dust temperature (10%) corresponds to an uncertainty of 20% in the dust inner radius estimated under the assumption of blackbody emission from the equation above (with a best-fit value of 42 AU listed in Table 5). Under different assumptions regarding the nature of the emitting grains, this same temperature would correspond to much larger radii of 400 AU (efficient absorbers and inefficient emitters with a mean grain-size of 0.95 m) or 1000 AU for ISM-like grains smaller than the blowout size (0.59 m). . The uncertainties on dust luminosity, , are more complex to quantify.
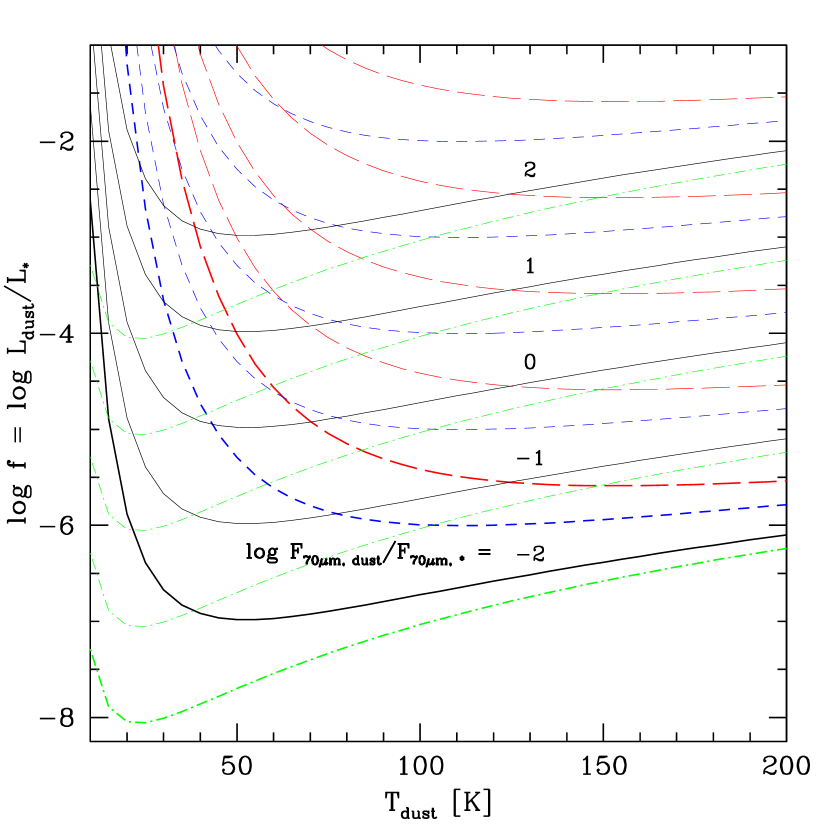
In the pure blackbody assumption, the maximum contribution at 70um (if in ) comes from dust at K. For a dust emission peak near 70 m, the factor in the blackbody flux density equation is constant and, from further consideration of the contrast with the Rayleigh-Jeans tail of the underlying stellar spectral energy distributions, one finds a minimum value for
For a dust excess peaking shortward or longward of 70 m, the resulting dust luminosity is higher for the same monochromatic excess; this is illustrated in Figure 9 which shows the run of with for constant values of the measured quantity . In many cases we have, rather than a measurement of , only a limit on . This leads to a limit on which is an upper or lower limit depending on the value and sign of the limit. For solar-luminosity stars, the dust temperature maxima that are much larger than 51.5 K result in inferred values that are likely upper limits while for dust temperature maxima smaller than 51.5 K the values are definitely lower limits, all in the blackbody situation.
In practice, the values of derived in the blackbody scenario from the inferred are in fact quite close to the minima for an assumed blackbody radiation peak at 70 m, within 0.1-0.2 dex in most cases.
Returning now to the case in which the grains are non-blackbody (i.e. smaller) and the dust inner radii () inferred via the blackbody assumption are thus lower limits, the dust cross-sectional areas () are then also lower limits. In other words, if the dust is actually smaller than the assumed blackbody size, in order to achive the same , the observed 70 micron flux density would require more total dust surface area by a factor m. Dust luminosity scales with but also with where for optically thin emission. In contrast to the pure blackbody case above, here K. Thus, dust temperature maxima larger than 51.5 K result in values that are larger than blackbody and the assumed blackbody case produces a lower limit on , while for dust temperature maxima smaller than 51.5 K, the values are smaller than blackbody and the assumed blackbody case is an upper limit on .
4.1.3 Dust Mass
The dust mass, Mdust, can be determined by assuming a grain material density and estimating an average grain size to compute the mass per particle, which is then multiplied by the number of particles. We consider 2.5 g/cm3 an appropriate average density for silicate dust, though acknowledge a 50% range in the values inferred among asteroids and asteroidal IDP’s. For the grain size there are several options depending on the dominant physical process that is controlling the removal of grains from the dust disk. We assume that the production of dust grains is through the collisional cascade of larger parent bodies, though this detail is not important just yet.
One option is to use a 10 m grain size. For efficient (i.e. blackbody) emission at a wavelength of 70 m, the radiative absorption and emission efficiency factors are close to unity, implying for , grains larger than am. Such large sizes are also consistent with, though not necessarily demanded by, a lack of observed spectral features in the shorter wavelength IRS data, which for our sources generally trace well the stellar photospheric or photosphere-plus-dust continuum levels (Bouwman et al. 2008; Carpenter et al. 2008a). Although the details of this argument depend on the temperature structure of the disk, emission from hot dust of any size, including small amounts of moderate sized (m) equilibrium silicates or very small (m) non-equlibrium grains/PAH’s, is not evident.
A second option is to estimate the average grain size from the minimum grain size expected to survive in a dust disk in which stellar radiation pressure removes grains not balanced by gravitational (and P-R drag) forces working to keep them in orbit about the star (i.e. ). Based on Burns et al. (1979) and Artymowicz et al. (1988), the minimum grain size in a (gas-poor) disk is
(which can be scaled as if an alternate is desired to the assumed 0.1 albedo of Solar System silicate dust). Smaller grains are blown out while bigger grains are retained and subject to collisions with other grains in a sufficiently dense disk. Among our sample stars, the range in the predicted is 0.3-2.5 m. The average grain size is close to the minimum grain size, 5/3 , for a distribution going as a power law with exponent -3.5 as is appropriate for either the interstellar distribution (Mathis et al. 1977, though extrapolated to larger sizes than typically populate the ISM) or to to a self-similar infinite collisional cascade 999 For collisionally dominated disks, such as we think dominate our sample, it can be argued that the number of small grains at the inner edge of the debris disk is actually higher than predicted by such a power law since those just below the blowout size are preferentially removed via radiation pressure and therefore not available to collide with those just above the blowout size, e.g. Krivov et al. (2000) leading to a “wavy” size distribution, e.g. Thébault et al. (2003, 2007), with more grains at about 1.5 and fewer grains at 10-50 , relative to the Dohnanyi distribution. We do not consider such complexity here. For P-R dominated disks, on the other hand, there may be fewer small grains at the inner edge and overall, since a shallower power law may be more appropriate as in the Solar System, where e.g. Fixsen & Dwek (2002). (Dohnanyi, 1969; Durda & Dermott 1997). In this case the typical grain size is thus a few m.
A third option would be to assume that corpuscular drag (due to the effects of stellar winds on orbiting dust particles, rather than to those of stellar radiation as in P-R drag) is responsible for grain removal. Neither P-R drag nor corpuscular drag effects appear to dominate in our disks however (see §5.3) and so we do not consider this case in detail.
Dust masses, Mdust, can be calculated from the assumed grain density, the grain size, and the total number of particles at that size, which we estimate by considering the fractional infrared luminosity () divided by the fractional solid angle intercepted by a single dust grain (). For simplicity, we consider only the average grain size . Because any smaller grains that are present provide more surface area, and hence opacity, we thus calculate minimum dust masses. The dust mass is thus
or
(see Backman et al. 1993 ; Jura et al. 1995).
The results of our simple modeling can be found in Table 5 where we have adopted from the above discussion a value of 10 m for . The uncertainty in the dust masses is significant, not only because of the linear scaling with assumed , but also because our values of are always lower limits in the blackbody assumption.
A separate point is that much mass can be hidden in larger grains, pebbles, and rocks that, given their ratio of surface area to mass, do not radiate strongly at even the longer Spitzer wavelengths. For an assumed grain size distribution going as , the mass in larger grains can be accounted for, yielding a total mass
(see Wyatt et al. 2006 for a more general formula for an arbitrary particle size distribution). Because generally is not known, we quote dust masses calculated for the average grain size only, which in our case is relatively close to .
4.2 Multi-Temperature Disk Models
For many of our 70 m excess detections, single temperature blackbody models fit to the excess emission do a poor job according to the values in Table 4, of reproducing the observed spectral energy distributions. We identify for further investigation those sources with in the 33-70 m color temperature fit. The probability that such high values are a good fit to the data is 25%. There are 12 systems in our excess sample, more than 1/3 of our excess sample, which we propose in Table 6 as having evidence for material with (at least) two different temperatures.
For these sources, we quantify the disparity in the color temperatures derived from the 24-33 m vs the 33-70 m excess flux density ratios in the second column of Table 6. We illustrate in Figure 10 the color temperatures for all sources in our 70 m-selected excess sample having 33 m and 24 m excesses as well. Regardless of the temperature, no single temperature model can fit simultaneously the measured 24, 33, and 70 m excesses for many (those listed in Table 6) of these sources. So-called modified blackbodies (or graybodies, having optical depth ; for a blackbody) that represent analytically the case of inefficient small, compared to the wavelength of observation, grain emission are also illustrated in Figure 10. Modified blackbody models are in even less agreement with the data, which suggests that other effects (perhaps dust geometry) trump any inaccuracies in our treatment of grain properties. Observatory calibration errors of a systematic nature could potentially improve the agreement in terms of fitting the mean of the distribution of points. However, such errors would have to be large, about 50% too high for either of MIPS-24 or MIPS-70 and about 30% too low for IRS, much larger than the current calibration precision. We emphasize based on Figure 10 and Table 6 that for any individual source the disagreement of the data and the single temperature blackbody is generally only a 1-2 effect and any conclusion would be marginal at best. However, we interpret the systematic trend as indicative of a real effect that characterizes the ensemble of stars.
We are thus motivated to consider multi-temperature dust models. While primordial gas and dust rich disks offer ample evidence for multi-temperature disks (e.g. Dullemond et al. 2007), it is unusual for debris disks to exhibit spectral energy distributions with emission at a wide range of temperatures.
Detailed discussion of the source HD 107146 can clarify the logic. Using the 1-sigma extremes on the photometry, the 24/33 micron color temperature is nominally 72 K but could be in the range 64 K to 81 K (72 K) while the 33/70 micron color temperature, nominally 52 K, could be in the range 50 to 54 K ( K). Those two temperature ranges are inconsistent at the 2-sigma level. Fitting the 24/33 color excess with the nominal color temperature that goes exactly through the data points requires a solid angle of dust sr; this model then predicts a 70 m flux density 10 below the observed data. If, instead, we fit the 33/70 color excess with the nominal color temperature we require sr or 11 times larger solid angle than for the hot dust source; this model predicts a 24 m excess which is low by 3.6. As a compromise one could consider an intermediate temperature set by fitting the 24/70 micron excess with a 58.5 K blackbody. To also fit the intermediate 33 m point then requires a source size and leads to under-predictions at both 24 m (by 2.6) and 70 m (by 5.7). For several other stars the 24 micron excess amplitude is higher than it is for this star, and the required color temperatures are even farther apart.
One could postulate under the blackbody assumption that the range of temperatures inferred for our debris disks is caused either by a range in grain locations, or a range in grain sizes. These location and/or size distributions may be distinct or continuous. In either scenario, if the different temperatures emanate from different components, with only a few flux density points measured in the excess we can not determine grain location or size as well as the temperature. A continuum of temperatures, indicating in the simple blackbody assumption material over a continuous set of distances from the star (a.k.a. a disk) or having a continuous distribution of sizes, encompass the case of two or more distinct temperature components and so we adopt this more general model in what follows.
The grain size scenario, in which a range of small grain sizes from the blowout size upward maintain different temperatures at the same physical distance from the star (due to the different absorption/radiation efficiencies), would result in the observed photometry reflecting a weighted mean of the emission. For dust sizes 1-10 m, a temperature dependency (§4.1.2 footnote) or even allowing for something as strong as from the grain absorption/emission efficiencies implies a factor of 1.5-3 range in temperature. In an idealized size distribution such as , the smaller 1 m grains absorb 3 times more starlight than the 10 m grains. These smaller grains will then dominate the (non-blackbody) emission but will have only 1/3 of their luminosity coming out in the longer wavelength tail we observe, which is emitted primarily by the larger cooler grains. Thus we consider more worthy of exploration the radial range scenario, in which there are multiple grain locations leading to the temperature ranges. In support of this interpretation, the evidence from debris disks detected in scattered light seems to be that multiple rings or extended structures indeed are present (e.g. Stapelfeldt et al. 2004), which is an existence theorem only that may or may not apply to our particular debris disks (though it does apply to at least two of them; see §5.1).
To model radially extended disks for the 12 candidate multi-temperature systems, we consider excesses in a photometric band as significant if they are , or if they are only when the excess in an adjacent band is and the inferred color temperatures are decreasing with increasing wavelength. We assume blackbody grains and a flat surface density distribution with radius, with . Although is thought most appropriate to radiation dominated disks and or perhaps more descriptive of collisionally dominated disks, the radial optical depth per logarithmic interval of goes as , so it is the dust at the inner radius which is responsible for most of the absorption and re-emission. Results for lower thus should be close to those for the uniform temperature ring. Further, Thébault & Augereau (2007, Figure 10) show specifically for a model initial distribution undergoing collisional evolution, that the micron to sub-mm grains quickly establish a flat density distribution, and it is only the larger bodies which retain the steeper distribution.
With the surface density exponent fixed, we step through a grid of and , calculating under the blackbody assumption the fractional surface density (a dimensionless quantity) at the disk inner edge that exactly matches the 70 m excess flux density. We then find the combination of the above 3 parameters that produces the lowest residuals when fit to the overall spectral energy distribution of the excess, letting the 70 m point be fit freely in this second stage. Our disk models certainly are non-unique, but they do allow estimates of disk parameters; can be constrained (minimum value) from the warm color excess while can be constrained (minimum value) by finding the smallest radius that satisfies the (F70μm - error) or (F160μm - error) constraints. We present our extended disk modeling results in Table 6. We list lower limits to the range of radii inferred from these (blackbody) temperature estimates, and refer the reader to section 4.1.2 for the caveats in interpreting these radii as physical constraints on the true location of the dust. Taken at face value, the values imply fractional disk widths of at least factors several. We emphasize that we are unable to constrain the dust outer radii very well as the sensitivity and wavelength coverage of our observations does not fully probe the coolest dust. However, we are quite confident in our general result of extended disks.
Returning to HD 107146, our results derived to match the overall spectral energy distribution indicate dust from 14 to at least 200 AU for (or 12 to 92 AU for ). One could truncate the disk at 130 AU to undershoot the 70 m flux density by 1. For comparision, the single-temperature model for this system predicts dust at 15.5 AU for the 72 K grain temperature and 30 AU for the 52 K grain temperature.
As an illustration of the limited application of our approach, we call attention to the case of HD 141943. Fitting the 24/33 color excess results in a nominal color temperature of 90 K while fitting the 33/70 color excess gives 81 K. Both temperatures produce an equally good fit to the overall spectral energy distribution (Table 4) and the hotter temperature leads to a derived inner disk radius of 15.7 AU while the cooler temperature gives 19.3 AU. An extended disk model, which is fitted for illustration rather than because of poor from the single temperature fit, spans 9–40 AU (Table 6) with better but also more free parameters in the model 101010 The reason an extended disk model leads to a smaller inner radius than the single temperature blackbody matched to the 24/33 color excess is because the former is a fit to the broader spectral energy distribution including errors, rather than a calculation specific to the exact 24/33 flux ratio. . An independently fit disk model using the more sophisticated methods referred to in §4.3 below also produces an extended structure, from 9.5-42 AU and having g/cm2, impressively close to the simple model though with the 1 confidence contour exceeding 50% of the nominal best fit values. Conversely, the only other source with similarly consistent single temperature blackbody fits to the 24/33 and 33/70 color temperatures is HD 209253, with derived temperatures of 77 and 70 K; a disk model fit to this source spans only 18.6 to 18.8 AU.
As evidenced from the results, small differences in color temperature with wavelength are probably consistent within the 2-3 errors. For the majority of sources not presented in Table 6, extended disk fits lead, as for HD 209253 mentioned above, to 1AU wide rings; exceptions are HD 145229 and HD 201219 to which 10 AU wide disks can be fitted (albeit with lower significance than for the sources in Table 6). We note that choosing a surface density exponent other than zero, either positive (e.g. a disk having low density warm and high density cold components) or negative (e.g. a disk having highest density at its inner edge), would lead to an increase in the number of disks with inferred broad radial ranges. For example, a large negative value of would place most of the particles (i.e. mass) near the inner edge of the disk and the spectral energy distribution would resemble a single temperature / narrow ring model. In summary, we interpret the larger, most significant color temperature differences with wavelength as the most compelling spectral energy distribution evidence for extended disks.
4.3 Potential for More Detailed Modelling
In most cases, our 70 m excess sources exhibit only a limited number of photometry points (sometimes just one) in excess, and simple blackbody models either with or without geometric complexity, are sufficient. More detailed modeling may be warranted in several cases, however. Candidates include HD 8907 (e.g. Kim et al. 2005), HD 104860, and HD 107146 which have multi-wavelength sub-mm photometry (see Figure 8), and HD 61005 and HD 107146 (again) which are both spatially resolved in scattered light at optical/infrared wavelengths (HD 107146 is resolved as well at sub-mm/mm wavelengths, measuring thermal emission). We can use any such more detailed modeling results to inform our strong assumptions made above in deriving values of dust temperature, location, luminosity, and mass.
As an example of what is possible, HD 38529 has been analyzed in some detail by Moro-Martín et al. (2007b). This source is of particular interest due to the presence of multiple planets detected via the radial velocity method. The characteristic dust temperature derived here from the ratio of 33 m to 70 m excess emission is 48 K, implying dust at 98 AU in the blackbody assumption (see Table 5). The temperature derived from fitting a photosphere plus a single temperature blackbody to the shorter wavelength IRS spectrum is 79 K, implying dust at 31 AU assuming blackbody emission (Carpenter et al., 2008a). As with the sources in section 4.2, this difference in HD 38529 dust temperatures derived for different wavelength ranges indicates that the dust probably is not confined to a narrow ring. Moro-Martín et al. (2007b) explored the complexity and degeneracy of debris disk spectral energy distribution modeling in the non-blackbody grain case using the radiative transfer code developed by Wolf & Hillenbrand (2003). They found for 10 m astronomical silicate grains in a dust annulus having free parameters Rinner, Router, Mdust, and a (initially assumed constant with radius) that the derived Rinner increases as: (1) Router decreases, because for a given dust mass, smaller Router means a larger , and hence more warm dust needs to be eliminated in order to be consistent with lack of 24 m-emitting dust in this particular source; (2) as becomes steeper (e.g. instead of constant); and (3) as smaller grains are considered. Because the outer radius of the disk, Router, can not be constrained with data currently available, it was found that a wide range of over-all disk properties (dust location, total mass, and luminosity) are consistent with the sparsely sampled spectral energy distribution.
Similar modeling of the other sources presented in this paper would have comparably uncertain results and we do not attempt it here. However, in the case of HD 38529, one can move beyond spectral energy distribution degeneracies by using dynamical simulations that take into account the role of mean motion and secular resonances of the two known planetary companions, to study the location of stable niches of potential dust-producing planetesimals. Moro-Martin et al. concluded from such dynamical modelling that the planetesimals responsible for most of the dust emission are likely located within the 20–50 AU region, one of the possible results from the spectral energy distribution modeling and consistent with the 100 AU inner dust edge in the simple blackbody scenario adopted here. Similar procedures may become possible for other targets if the planetary systems are discovered directly.
4.4 Inner Cleared Regions
Neither the spatially resolved imaging of inner disk holes nor the detection of planets that would enable inference of inner clearings based on dynamical analyis, are available yet for most of our sources. However, our simple modeling procedure has led to the result that the dust excess is dominated by a cold component which contributes prominently to the spectral energy distribution at 70 m and is typically located exterior to 10 AU. P-R radiation drag causes dust at large radii to spiral in towards the central star on time scales of only millions of years. Even in collisionally dominated disks such as we think dominate our sample (§5.3), some grains will avoid collisions and migrate to the inner disk.
We can ask the question of whether the inferred values of imply a lack of substantial amounts of warmer dust closer to the star, by testing how much mass could be hidden interior to without producing detectable radiation at the shorter Spitzer wavelengths. To do so, we adopt the same 10 m average grain size as above, such that the opacity scales only with surface density. We also assume the flat surface density profile () appropriate for the radiation-dominated, relatively cleared inner region that we postulate could extend from to an that corresponds to the dust sublimation temperature at 1500 K. We then find the corresponding dust mass such that the most stringently confining flux density not observed in excess among the 13, 24, and 33 m measurements, is not violated by more than 1; we note that it is usually the 24 m point that provides the best limit.
The resulting dust masses are small, roughly to and would decrease if we decreased the assumed grain size (§4.1). This corresponds to roughly a single asteroid mass pulverized into micron-sized grains. The surface density contrast between any such low mass inner dust disk and the outer dust disk that we in fact observe can be constrained by fitting a two-component model with surface density in the hypothetical inner P-R dominated disk and in the outer collision-dominated disk (recall the Thébault & Augereau 2007 result noted earlier regarding the quick establishment of a flat surface density profile for the dust even in a collisionally dominated disk). Resulting values of / range from 30 at the minimum to depending on model choices. For example, if we assume a very large (200 AU) outer disk it requires relatively little surface density to match the 70 m measurement, compared to a narrower disk or belt which would require substantially more (factor of ) surface density and hence produce larger outer/inner disk contrast than the minimum quoted above. Similarly, a declining surface density profile for the outer disk also requires more (factor of ) surface density relative to the flat surface density profile, and hence would also enhance the above minimum contrast numbers.
5 Physical Implications
5.1 Extended Dust Disks
Tables 5 and 6 show the characteristic location of the dust for single temperature blackbody models and for extended disk models, respectively. Of note is that for a number of systems with high , we have inferred the existence of dust disks of wide radial extent.
The best evidence for extended disks around other dusty stars has come from spatially resolved imaging in both scattered light at short wavelengths and thermal emission at longer wavelengths. Prominent nearby examples of non-narrow ring sources include the very young (10-20 Myr) debris disks AU Mic (M-type star) and Pic (A-type star) as well as the somewhat older systems Eri and HD 53143 (K-type stars), HD 32297 (G-type star), and Vega and 49 Ceti (A-type stars). The spatially resolved images indicate dust over a wide range of radii. In most cases the data are contrast-limited at the inner edges, implying widths 50 AU (Ardila et al. 2004, Kalas et al. 2006), roughly consistent with our understanding of the Solar System’s dust distribution having width 25-30 AU beginning outside 30 AU. From the spectral energy distributions, alone, one would not have inferred the presence of multi-temperature material for these particular sources. Indeed, it is rare to infer extended debris dust from spectral energy distributions.
There are two sources, both in our 70 m excess sample, which have been spatially resolved. HD 107146 (first discussed as an infrared excess object by Metchev et al. 2004 and Williams et al. 2004) is the first spatially resolved disk associated with a G-type star (Ardila et al. 2005, Carpenter et al. 2005, Metchev et al. 2008), and extends from 80-185 AU optically and 30-150 AU at sub-mm wavelengths. HD 61005 (first discussed as an excess object here) is spatially resolved in scattered light (Hines et al. 2007). Both objects also appear in our Table 6 of candidate extended disks. That we infer extended dust geometries based on spectral energy distributions for several additional sources indicates that they are prime targets for high spatial resolution, high contrast observations that might succeed in imaging the disks.
5.2 Steady State vs. Stochastic Collisions
The debris disk systems discussed here have dust at temperatures and locations roughly comparable to the inner regions of the Solar System’s own Kuiper Belt. However, the values that result from our simple blackbody modeling indicate much higher levels of dust: to compared to the inferred for the Kuiper Belt (Fixsen & Dwek 2002; Backman et al. 1995; Stern 1996a). Higher values of at the same location suggest that our disks contain more dust than our present day Solar System.
By experimental design, the FEPS sources typically are younger than our Solar System (only 6/328 are comparably aged or older according to our most recent age estimates). A more appropriate comparison of the dust luminosities and masses might be made, therefore, to models of the earlier dust content in the Solar System. Because the relevant processes is dissipative, we can not extrapolate backwards in time. However, we can use forward modelling that assumes (for a collision-dominated dust disk) or (for a radiation-dominated dust disk) scaling as may be appropriate during different stages of Solar System dust evolution (e.g. Dominik & Decin 2003). See §3.1 and Meyer et al. (2007) for brief discussion of such a model. Our data would thus be explained in the context of our solar system by a more massive planetesimal belt/s (e.g. Wyatt 2006).
Alternate to the more massive and perhaps younger debris disk scenario, we could be witnessing the effects of transient phases of high dust production due to recent massive collisional events in these particular 70 m-bright systems (e.g. Jura 2004). If all the observed disks were transient, our observations could be used to assess the duty cycle of such short-lived events given the rapid blowout times for small grains, once produced. If, for example, we are detecting 10% of systems in states that should disperse in 1% of the system lifetimes, and assuming that all stars go through this process, then we would be seeing a phenomenon that occurs 10 times in the lifetime of the system, rather than single, unique catastrophes.
To assess whether the observed dust could be produced by the steady grinding down of planetsimals or, on the contrary, if a transient event is required, we can compare the observed excess ratio, , to that corresponding to the maximum dust production rate that could be sustained for the age of the system, an (maximum). Following Wyatt et al. (2007) and using the same parameters for debris belt width (50%), planetesimal strength, maximum planetesimal size, and orbital parameters, we find that:
This equation represents equilibrium evolution of a standard grain size distribution with no grain growth or planetesimal accretion. Most of the FEPS 70 m-selected debris disks appear below the predicted line, by up to two orders of magnitude, though some are very close to it. Exceptions for which (maximum) are HD 206374 and HD 85301. The former is a marginal excess detection. The later is a factor of a few above the collisional prediction (which is notably the lowest (maximum) among our sample stars) and could therefore be a rare stochastic system. With (maximum) in general, the debris disks appear consistent with a steady grinding down of planetesimals. This is also the conclusion reached by Löhne et al. (2008) who find, unlike Wyatt (2007), a dependence of on initial disk mass and an evolutionary behavior of with shallower slope ( rather than ).
Another comparison that can be made is to the planetesimal formation and early debris “self-stirring” models of Kenyon & Bromley (2005) which predict a peak in between 10-100 Myr, rather than the monotonic steady decay of Dominik & Decin (2003), Wyatt et al. (2007) or Löhne et al. (2008). The data may be more consistent with this genre of collisional evolution at the young ages; see Carpenter et al. (2008a) for in-depth comparison to these particular models and discussion of the evolution of debris having a range of temperatures and locations (regardless of detectability at 70 m). That our highest- values occur roughly around 100 Myr (§6.1) may also be indicative of consistency with these models.
In summary, we find no strong evidence for transiently bright dust among our sample of 70 m selected disks. Rather, our brightest 70 m-selected debris systems seem consistent with massive, youthful debris disks undergoing collisional evolution.
5.3 Radiation-dominated vs. Collision-dominated Disks
To further evaluate the possibilities regarding the steady state evolution vs. stochastic event interpretation of debris around solar type stars, we address in this section whether our detected debris disks are collision-dominated or radiation-dominated. We consider the time scales for various processes (following Backman & Paresce 1993) and then evaluate their relation and appropriateness to our debris disks.
-
•
Collisional Lifetime: The time between collisions involving a single grain can be estimated simply as . Under the presumptions of circular orbits and completely destructive collisions between grains of the same size, this becomes
where is the face-on fractional surface density, in units of cm2 of grain cross section per cm2 of disk area, also termed radial optical depth; see below. For a constant surface density, , , with the inner disk boundary and the outer disk radius (e.g. Backman, 2004). Then in the case of a broad belt with , and is simply . Thébault & Augereau (2007) propose a significant modification to the above formula which accounts for the grain size distribution as a scaling factor of ; this lengthens the collision lifetime by up to a factor of 10 for grains very near the blowout size, and shortens it by up to a factor of 100 for grains less than 100 times the blowout size (maximally so for grains 10 times blowout size), and again lengthens the collision lifetime for even larger grains. Because we generally consider grains of several times the blowout size, we note that from the simple formula above the derived collision times are likely overestimates, i.e. the true collision time scales for average grains in our disks are even shorter than the values we calculate, roughly to years.
-
•
Radiative Blowout Lifetime: For very small grains, the relevant time scale is the travel time for removal from the disk under the influence of radiation pressure. This occurs when the radiative force exceeds the gravitational force. The time it takes for a grain to go from Rinner to say 4Rinner where, under the blackbody assumption, the grain temperature is reduced by half so that the grain no longer contributes significantly to the flux density measured at Rinner, is given by
The so-called blowout time is generally many orders of magnitude smaller than the other time scales, roughly to years.
-
•
P-R Lifetime: For grains larger than the blowout size (formula given in §4.1.3), the time it takes for a dust grain to spiral inward under the effect of P-R drag from a distance all the way to the star is given by
To estimate the time it would take for a grain to drift from a distance to a distance we substitute by (). Replacing by () gives the time scale for a particle to move through the entire debris belt, which can be compared to the time for particles in the belt to collide, as given above. For our disks we calculate radiative drift times ranging from to years.
-
•
Corpuscular Drag Lifetime: The effect of stellar wind (or corpuscular) drag scales with the P-R lifetime as
assuming comparable coupling efficiencies or Q’s for wind and P-R drag (Jura 2004). While less important for relatively old stars like the Sun, for which and hence , wind drag may be relevant for young stars such as FEPS targets which may have much higher mass loss rates at the same or only slightly higher stellar luminosity L∗. There is still significant uncertainty in the appropriate values, however (c.f. Wood et al. 2005, Matt et al. 2007) and so we do not consider further the details of this potentially relevant dust removal mechanism.
At issue is whether the dust grains we observe will disappear by moving outward from the planetesimal belt (which would be the case in a collision-dominated systems where dust particles erode and fragments blow out), or whether they spiral inward towards the star producing a zodiacal-like dust cloud located between the inner edge of the planetesimal belt () and the star (like would happen in a P-R dominated system such as the inner solar system). As the processes are statistical in nature, the question can be partially addressed by comparing the collisional lifetime to the time it takes a grain to migrate. In the above equations, when the surface density profile exponent = 0, increases as and increases as ; thus if at then this condition will hold thoughout the disk, at all points . In an = -1 disk, increases as and, if as above, , but now at Router then this condition will hold towards the inner disk, at all points . In what follows we demonstrate that the disks are collisionally dominated at (and therefore throughout, if ) as well as at an assumed (and therefore throughout, if ).
We can consider migration between a characteristic point in the middle of the belt () and either or . Those reaching from the interior are lost from the system and it is assumed that all grains small enough to undergo blowout are thus quickly removed. Those reaching from original locations between and would create a zodiacal cloud and be able to drift past before colliding. A reasonable value for is , and in this case the P-R drift time scale is numerically equal to the P-R lifetime derived above for R = . Alternately, Moro-Martín et al. (2007b) calculate the time it takes grains to fill the inner gap as , where is a percentage scaling (assumed to be 10%) of over which the dust density decreases.
The disk optical depth is roughly , with vertical optical depth radial optical depth, that in the disk plane, which above was called the dimensionless face-on surface density; see also Backman 2004. For small values of the fractional infrared luminosity (i.e. optical depth) , the primary effects on the dust population are radiative (e.g. P-R drag and blowout) and/or mechanical (e.g. stellar wind). When dust removal is dominated by these mechanisms, the radial distribution of the existing dust is expected to extend over a larger radial range than the location of the parent bodies generating the dust (such as may be the case for Vega; Su et al. 2005 and Eri; Backman et al. 2008). Conversely, for large values of , such as we report here, the disks are expected to be collisionally dominated (e.g. Krivov et al. 2000) with larger grains cascading into smaller grains on time scales shorter than they are affected by the above-mentioned grain removal processes. In this case, the radial distribution of the dust is expected to mimic that of the parent bodies colliding to produce the dust, and to undergo further collisions in situ.
In Figure 11 we compare the collisional and radiative removal time scales with both the and Mdust values as computed in §5.3. In Table 5 we consider both situations described above, the disk evaluated at the inferred from the assumed blackbody scenario as given in Table 5, and the disk evaluated at an which is unconstrained by the observations but assumed to be 200 AU for purposes of illustration. In the former case, and so the 10-30% uncertainties in are not a large effect. Our calculations consider only a single grain size, 10 m, with (Wyatt 2005). We conclude that for the debris disks discussed in this paper, the observed fractional infrared luminosities, imply in the range near the inner edge of the disk, i.e., the dynamics of the dust particles in these disks are indeed dominated by collisions. Similar analysis by Dominik & Decin (2003) and Wyatt (2005) of previously known bright debris disks has led to similar conclusions: that they are all collision-dominated. Even for our evaluation at a fabricated outer disk radius of 200 AU and a falling surface density profile, the values of are an order of magnitude higher than at and a flat surface density profile, but generally less than unity; a few cases have ratios higher than unity by factors of several. Among our sample, HD 38529 stands out with the highest ratio of (in either scenario) suggesting a long collision time scale likely because of the large inner radius of the disk; hence P-R effects may play a more prominent role for this particular system relative to the others.
Although the small grains produced in collisionally dominated disks are blown out by radiation pressure, grains larger than the blowout size cascade into smaller grains before they have time to migrate far from the dust-producing planetesimals under the effect of P-R drag. Even in collisionally dominated disks in which each collision preserves say roughly 1/e of the grains, some small percentage (5% of grains survive 3 collisions while 1% of grains survive 5 collisions) of the dust particles may survive long enough to have a chance to undergo P-R drag and thus permeate the inner disk. The debris disks around 49 Ceti (Wahhaj et al. 2007) and Eri (Backman et al. 2008), with small grains in the inner disk contributing to spatially resolved mid-infrared emission and little to the spectral energy distribution, but large grains in the outer disk contributing most of the excess in the spectral energy distribution, may be examples of exactly this phenomenon. In §4.4 we reported in dust within the inner cleared regions of our debris systems.
5.4 Location of the Dust-Producing Planetesimals and Potential Planets
We concluded above from examination of the time scales involved in different dust production and dust removal mechanisms, that the disks we observe are collisional. Hence, the dust and the parent bodies are expected to be co-located.
We consider now as a general question whether the wide radial extent inferred for the dust implies a similarly wide planetesimal belt. When dust particles are released from their parent planetesimals, their semimajor axes increase due to the effect of radiation pressure, instantaneously from to (Burns, 1979), where is the dimensionless ratio between radiation pressure force and gravitational force and is the radius of the dust release point. For 10 m silicate grains with optical constants from Weingartner & Draine (2001) and assuming as in the Solar System, . Other combinations of larger values (0.05, 0.2, and 0.4) which imply smaller grains for the same radiation field (4.5, 1.3, and 0.7 m, respectively) lead to . The increase in semimajor axis is therefore small for the big grains that we expect dominate the 70 m emission, but can be large as the blowout size is approached, consistent with intuition. Assuming the large grain case, if the planetesimals were located in just a narrow ring, they therefore can not account for the large difference between found between Rinner and Router in the dust modeling. This suggests that our disks likely harbor wide planetesimal belts roughly comparable in size to their wide dust belts.
Separately, the strong depletion of warm dust, inferred from lack of short wavelength excess emission, also has implications if it can be argued that the inner edge of the dust distribution betrays an inner edge to the planetesimal distribution. Possible processes that would create such inner edges are the presence at early times of large (1000 km) planetesimals that could have stirred up and ground away the inner region of the planetesimal disk, or the existence today of gravitational perturbations due to one or more planetary companions on the planetesimals, as argued for HD 38529 by Moro-Martín et al. (2007b).
For radiation-dominated disks, an inner cleared disk geometry is often used to suggest the presence of a planet that is sufficiently massive to not only stir the exterior planetesimals, increasing their velocity dispersion such that dust-producing collisions occur, but also then either eject efficiently any dust particles that cross its orbit as they spiral in due to P-R drag (80% of the particles are ejected by a 1–10 MJup mass planet in a circular orbit at 1–30 AU; Moro-Martín & Malhotra 2002, 2003, 2005), or/and trap them into temporary resonances as they migrate inward (e.g. Ozernoy et al. 2000). Such scenarios prevent or at least impede material from reaching radii much smaller than those where the dust is in fact detected.
For collision-dominated disks, such as we infer here, the location of the planetesimal-stirring planets is less obvious, and requires detailed modeling of individual systems once they can be spatially resolved.
6 Cool Dust Trends with Stellar Parameters
Overall, finds 37/328 stars with 70m excess. Six of these are young primordial disks with excess emission extending from m to m. Removing these 6 results in an overall incidence of 70 m excess indicative of cool debris, of 10% within . Further accounting for the fact that 14 of the sources were chosen for the program based on previous suspicion of having infrared excess (only 12 of which are confirmed as such) yields a 6% excess fraction at 70 m. We consider these percentages lower limits due to the sensitivity-limited observations.
The majority of the 70 m excess sources also have 33 m excess and/or 24 m excess indicating that the dust is within 5-30 AU. Meyer et al. (2008) and Carpenter et al. (2008a) present a more complete picture of excess vs wavelength and vs age/mass. Here, in Figure 12, we present detected and 3-sigma upper limits to fractional excess luminosities based on our 70 m data analysis, compared to both stellar age and stellar temperature/luminosity. The values are determined as above for the 70 m detections and as 3-sigma maxima to (the minimum) for the 70 m upper limits assuming a hypothetical dust spectral energy distribution that peaks at 70 m (using the formula in §4.1.2). Note that these values could be factors of several higher for hotter dust or orders of magnitude higher for cooler dust not peaking at 70 m; see Figure 9. Note also that these values are still upper limits because the flux densities are upper limits.
6.1 Stellar Age
The primary goal of the FEPS Legacy survey is to trace the time evolution of dusty debris around solar type stars. Proper assessment requires consideration of the full spectral energy distribution. This would allow physical parameters such as Tdust and Rdust to drive the discussion rather than empirical or wavelength driven constraints, such as are imposed here. However, mindful of the observational biases which render the great majority of FEPS 70 m observations upper limits and the 70 m detections almost all excess objects, we summarize a first analysis of cold debris disk evolution with age. Stellar age determinations for the FEPS sample are discussed in detail by Hillenbrand et al. (2008). In brief, a variety of age indicators such as coronal activity, chromospheric activity, stellar rotation, lithium abundance, and the Hertzsprung-Russell diagram are calibrated to open clusters and used to assess stellar ages between 3 Myr and 3 Gyr. Rough ages for the sample of 70-m excess sources are provided in Table 1.
In Figure 12, there is no apparent trend in 70 m dust detection frequency with stellar age, other than a dearth of strong debris type excesses in our youngest age bins 3-10 Myr 111111There are 6 primordial disk excesses in this age range but the remainder of this young sample is undetected at 70 m. . Further, comparison of the age distribution for the detected (using either 2 or 3 threshold) and the non-detected objects is insignificant using the K-S test, suggesting that we can not distinguish them. The excess amplitude at 70 m does, however, appear to decline with age, most obviously in the upper bound; this could be significant when coupled with an invariant excess frequency with age. Analysis of a more physical quantity like Ldust/L∗, as illustrated, reveals that the average value and the upper bound (including measured as well as upper limits on Ldust/L∗) decrease with age. Given the large scatter in Ldust/L∗ values (both measured and upper limit) at all ages, and the intermingling of detections and non-detections in , we do not draw any strong conclusions regarding the physical implications of this trend.
Of interest is that the four highest values of among our debris disk sample (HD 61005, HD 38207, HD 191089, and HD 101746) all occur within the narrow age range 80-200 Myr. Note that each of these high debris systems is suggested in Table 6 as a radially extended disk. There are no trends in either the evidence for an extended disk, or in the derived values among the extended disks, with stellar age. For the entire debris sample detected at 70 m, there are no apparent trends in derived Tdust, Rdust, or Mdust with age. An outlier object in such scatter plots is HD 38529 with a very large inferred inner dust radius, perhaps driven by its larger than average stellar luminosity or the presence of a sculpting planet.
6.2 Stellar Mass
In addition to the lack of Tdust, Rdust or Mdust dependence with age among our detections, there are, similarly, no trends of these parameters (nor of ) with T∗ or L∗. Note that because our sample spans a range of ages from 3 Myr to 3 Gyr there is not a 1:1 correlation between T∗ and L∗ as would be true for a purely main sequence sample lacking young objects; thus we show both in Figure 12. In contrast to the situation for stellar ages where we found a trend in with age, but no evidence for a trend in detection frequency with age, here for masses we do not find any correlation with (or other parameters) but we do find a trend in the dust detection frequency at 70 m.
Among our sample of 70 m debris disks, 10 are F stars, 20 are G stars, and just 2 are K stars. The relative search samples in the total program are 42, 181, and 77 stars with spectral types F, G, and early K, corresponding to detection percentages of 24%, 10% and 3%, respectively. Only 3 of the excess G stars are G5 and later, rendering the above percentages 24%, 12%, 7%, and 3% for F, G0-G4, G5-G8, and early K types. Finally, excluding those sources with 70 m excesses that were known from previous work with IRAS and ISO (see Table 1) leaves among F stars: 3/35 ( 9%), G stars: 16/178, ( 9%) and early K stars: 1/76 ( 1%) detected. The trend of less frequently detected debris dust around the later type stars is very clear when detection frequency is correlated directly with the inferred T∗ (see Figure 12, noting only the points below 6400 K where the sample is not biased by excess objects chosen for the probe of disk gas evolution. We emphasize that the trend is not driven by any trend in debris frequency with L∗, which is flat for the bulk of our sample even at fixed T∗.
These findings are consistent with the relative detection frequencies of debris among A star samples, FGK samples and M star samples having a wide range of ages (e.g. Rieke et al. 2005, Meyer et al. 2008, Gautier et al. 2007). For example, Beichman et al. (2006) claim that they did not detect in their more limited survey any debris disks around 23 stars later than K1, “a result that is bolstered by a lack of excess around any of the 38 K1-M6 stars in two companion surveys.” The sample shows similar behavior for stars typically younger the Beichman sample. However, it is not yet clear whether all relevant variables – observational (including selection effects) as well as astrophysical – have been normalized properly among the various samples, as would be required before such claims can be validated.
To assess the significance of the apparent trend reported here amongst our FGK sample, we consider again our lack of sensitivity at 70 m to stellar photospheres. First, the distance range of the sample is peaked at d50 pc for all spectral types, with a long tail in the distance distribution out to 180 pc. The F star sample contains no objects at distances between 70 and 120 pc but the 10 excess F stars include objects with both d70 and d120 pc. The G and K star samples cover the full distance range 10-180 pc with the two excess K stars both nearby (26 and 10 pc). We conclude that distance effects do not bias the apparent trend with spectral type. A second consideration is the relative age distributions. The K star sample peaks at younger age than the F and G samples, but there are similar numbers of F, G, and K stars at all ages older than 100 Myr. Thus age effects (which we have not claimed for the sample as a whole) also do not seem to bias the results on debris vs stellar temperature/mass since, if anything, the younger K stars might be expected to have a higher incidence of detectable disks rather than a lower incidence.
A final consideration is whether we can reach the same value of for later type (generally less luminous and cooler) as for earlier type stars. A monochromatic debris detection trend with mass such as we report might be expected if it is driven by temperature or luminosity effects given that hot/luminous stars are capable of illuminating the same amount of dust to produce higher dust luminosity relative to cooler and less luminous stars in a flux-limited survey. There are no trends either in the limits or in the observed (detected) values of , with either or . Again, we stress the several orders of magnitude spread in and the intermingling of detections and upper limits over this range. It is only the frequency of detection which varies with the stellar temperature but not the luminosity. We conclude, though admittedly have not proven, that decreasing detection frequency towards cooler, less luminous, and typically less massive stars is not a result of varying sensitivity limits or luminosity effects. We believe that this again confirms our earlier assertion (recall discussion in §3.1 and §3.2) that the dominant sensitivity limitation for 70 m observations is primarily infrared background.
7 Comparison to the Solar System and Context Relative to other Work
We have identified 25 secure (Tier 1) and 6 candidate (Tier 2) debris disks in the sample. Considering their 33-70 m color temperatures, approximately 25% of the systems have cold “Kuiper Belt-like” temperatures, K, AU. Another 45% of the systems have “Jovian-like” temperatures, 60 K 120 K, R in the range AU. About 30% of our sample have characteristic temperatures 50-60 K, which would be analagous to “Uranus-Neptune-zone” temperatures at 20-30 AU. Interestingly, there are no planetesimals in this region of the Solar System, due to the earlier migration of the outer planets (in particular Neptune, e.g. Morbidelli et al. 2007). Only a small percentage (5-10%) of our 70 m-selected sources have evidence at shorter wavelengths for “Asteroidal” belts with temperatures above 125 K, roughly corresponding to dust at 5 AU.
In 1/3 of the debris objects, disk models having broad temperature/radius ranges rather than single temperature/radius models can be fitted. For these 12 objects (see Table 6) the data typically indicate material lying across more than a factor of 2-5 in radius.
The wide belts can be compared to the Solar System’s 2-4 AU asteroid belt having = (2 AU)/3 AU = 66% or the 40-65 AU (estimated) Kuiper belt with = (25 AU)/50 AU = 50%. These relatively narrow belts or rings in our Solar System and elsewhere would be well-described by a single temperature blackbody model, in contrast to the subset of debris disks we propose as extended disk candidates. Assuming small grains instead of blackbody grains would move both the inner and the outer radii of the wide disks to larger values but would not change the fundamental result of disk breadth.
Although the dust temperatures and radii that we have derived from our debris disk modeling compare well to those characterizing the cold outer dust in our own Solar System, there is an important difference. At 70 m the signal from our Kuiper Belt would be a few percent of the stellar photosphere while that from our Asteroid belt would be less than 0.1% of the stellar photosphere. The dust luminosities inferred for our FEPS sources are several orders of magnitude above these levels. We have argued based on the age distribution of our sample that some of these systems may be younger analogs of our own cold outer dust distribution, but the majority appear to have higher dust levels relative to our evolving solar system.
We can compare our work to analyses of solar-type stars previously detected in the IRAS survey and/or in ISO pointed observations (e.g. the systematic studies by Mannings & Barlow 1998, Silverstone 2000, Decin et al. 2003, or the modern re-analyses of data from both space observatories by e.g. Moor et al. 2006, Rhee et al. 2007 121212These two papers reach conflicting results on the debris disk status of at least 10 stars.). Comparative plots of vs and vs show that is finding somewhat warmer, closer in, and slightly lower luminosity disks relative to previous work. Numbering only a few tens before Spitzer, the sample of debris disks surrounding solar type field stars has increased by more than 4-fold, collating results from various Spitzer programs. Approximately 45 of these new debris disk detections come from the FEPS survey of 328 young FGK stars using IRAC, IRS, and MIPS data, as summarized in Carpenter et al. (2008a).
Another large debris disk survey is the MIPS GTO FGK Survey, designed to search for excesses around 150 stars using IRS and MIPS. These targets are generally older and located at smaller distances relative to the FEPS targets. Results presented in Bryden et al. (2006) and Beichman et al. (2006, 2007) indicate a 133% detection rate of 3- confidence level emission at 70 m (derived from 12/88 stars detected plus accounting for the stars with large excesses intentionally left out of the survey). Of the 12 stars with 70 m excess, most have longer wavelength IRS spectra rising above the photosphere at the red end and 4 also show weak 24 m excess, indicating that the dust is located beyond 5–10 AU. We can compare the above with the 6-10% detection rate of 70 m excess from the younger but typically more distant (and hence more limited by sensitivity) sources. There are additional long wavelength Spitzer results within the younger age range of stars (e.g. Low et al. 2005, Smith et al. 2006, Padgett et al. 2006, Cieza et al. 2007). A complete analysis of dust temperature/location and luminosity vs stellar age may soon be possible.
8 Concluding Remarks
In the present work we have identified 25 likely and 6 possible debris disk systems plus 6 primordial disks based on 70 m excesses observed with Spitzer. In addition to confirming previously known/suspected debris systems, we have newly discovered 14 systems (see Table 1).
Rather than the selection of 70 m excess sources resulting in physically similar dust belts, we find from simple blackbody modelling of the debris systems, factors of more than several in the dynamic range of the physical parameters. Tdust ranges from 45 to 100 K, Rdust,inner from 7-90 AU, from , and Mdust(minimum) . We also place limits on the amount of dust in the relatively cleared regions interior to our derived Rdust,inner, finding . We argue for approximately 1/3 of our systems that extended disk models are more appropriate than single ring models. Such models imply disks with inferred (but poorly constrained) Rdust,outer values ranging from 35 to beyond 200. The debris disks are thus factors of several to tens wide in , compared to the Solar System’s two debris belts which are each only about 50-75% wide.
The above characteristics suggest that the massive disks we see are collisionally dominated and thus potentially earlier analogs of the present-day Solar System’s dusty debris system (in which the dynamics are controlled by radiation and mechanical wind effects rather than by collisions, and in which there are massive planets located in the debris-free zones). The large radial extent of the dust implies either wide planetesimal disks as well, or multiple narrow planetesimal belts, given the collisional nature of the debris. From our survey of 328 solar type stars ranging in age from 0.003-3 Gyr, at least 6-10% of solar-type stars appear to have cold debris. We direct the reader to Carpenter et al. (2008a) for discussion of the complete set of cold, warm, and hot debris disks from the program.
Future investigations of the debris systems identified here will include high spatial resolution imaging in scattered light and thermal emission, in order to determine the dust geometry, particle size distribution, and temperature structure, as well as the application of various planet detection techniques, in order to detect directly the large bodies responsible for inducing the collisional cascade and leading to the dust that we infer from Spitzer data. One of our debris systems, HD 38529, is known already to harbor such a planetary system.
Spitzer in general and in particular is dramatically increasing the sample of nearby cold debris disks. Indeed, this is a “sweet spot” for the Spitzer Space Telescope. The new objects are typically fainter in terms of fractional infrared luminosity than those found from studies with previous generation satellites such as IRAS and ISO. True analogs to our inner Solar System debris, with its asteroid belt that is controlled dynamically by massive Jupiter, remain elusive; we are still several orders of magnitude above required observational sensitivity and precision for detection of the current or even earlier (higher) inferred dust levels (including with the state-of-the-art Spitzer telescope). However, we have approached the observational sensitivity needed to detect current outer Solar System dust values, found in the Kuiper Belt region which is sculpted by Neptune.
Probing effectively the formation and evolution of solar systems within this Spitzer Legacy Program, we are even more sensitive to extrapolations backwards in time to a younger version of our Solar System’s cold dust. Based on the architecture of our own Solar System, we would not expect to see as much dust at cool temperatures (corresponding to location between the Kuiper Belt and Asteroid Belt) at any point, even allowing for various planetary orbital migration scenarios (e.g. Bottke et al. 2005, Levison & Morbidelli 2003). That we see a range of dust temperatures and dust luminosities/masses in other debris disk systems may not be too surprising given the diversity of proto-planetary disk properties as well as planetary architectures found amongst the known exo-solar planet population.
References
- (1) Ardila, D. R., Golimowski, D. A., Krist, J. E. et al. 2004, ApJL, 617
- (2) Artymowicz, P. 1988, ApJ, 335, L79
- (3) Backman, D. & Paresce, F. 1993, in Protostars and Planets III ed. E.H. Levy & J.I. Lunine (Tucson: Univ. Arizona Press), p 1253
- (4) Backman, D., Dasgupta, A., & Stencel, R. E. 1995, ApJL, 450, 35
- (5) Backman, D. 2004, in ASP Conf. Ser 324, Debris Disks and the Formation of Planets: A Symposium in Memory of Fred Gillett (ed. L. Caroff, L.J. Moon, D. Backman, and E. Praton), p 9
- (6) Backman, D. et al. 2008, in preparation
- (7) Beichman, C. A., Bryden, G., Stapelfeldt, K. R., Gautier, T. N., Grogan, K., et al. 2006, ApJ, 652,1674
- (8) Beichman et al. 2007, Protostars and Planets V, B. Reipurth, D. Jewitt, and K. Keil (eds.), University of Arizona Press, Tucson, 951
- (9) Bottke, W.F., Durda, D.D., Nesvorny, D., Jedicke, R., Morbidelli, A., et al. 2005, Icarus, 179, 63
- (10) Bouwman et al. 2008, ApJ, accepted
- (11) Bryden, G., Beichman, C., Trilling, D., Rieke, G., Holmes, E., et al. 2006, ApJ, 636, 1098
- (12) Burns, J.A., Lamy, P.L., & Soter, S. 1979, Icarus, 40, 1
- (13) Carpenter, J. M., Wolf, S., Schreyer, K., Launhardt, R., & Henning, T. 2005, AJ, 129, 1049
- (14) Carpenter et al. 2008a, (omnibus disks paper) in preparation
- (15) Carpenter et al. 2008b, (data paper) in preparation
- (16) Cieza, L., Padgett, D. L., Stapelfeldt, K. R., Augereau, J.-C., Harvey, P., et al. 2007, ApJ, 667, 308
- (17) Cohen, M., Megeath, S. T., Hammersley, P. L., Martiín-Luis, F., & Stauffer, J. 2003a, AJ, 125, 2645
- (18) Cohen, M., Wheaton, W., & Megeath, S. T. 2003b, AJ, 126, 1090
- (19) Cortes, S., et al., 2008, in preparation.
- (20) Cutri, R. M., Skrutskie, M. F., van Dyk, S., Beichman, C. A., Carpenter, J. M., et al. 2003
- (21) Decin, G., Dominik, C., Malfait, K., Mayor, M., & Waelkens, C. 2000, A&A, 357, 533
- (22) Decin, G., Dominik, C., Waters, L. B. F. M., & Waelkens, C. 2003, ApJ, 598, 636
- (23) Dohnanyi, J.W., 1969, J.G.R., 74, 2531
- Dole et al. (2004a) Dole, H., et al. 2004a, ApJS, 154, 87
- Dole et al. (2004b) Dole, H., et al. 2004b, ApJS, 154, 93
- (26) Dominik, C. & Decin, G., 2003, ApJ, 598, 626
- Downes et al. (1986) Downes, A. J. B., Peacock, J. A., Savage, A., & Carrie, D. R. 1986, MNRAS, 218, 31
- (28) Durda, D. D., & Dermott, S. F. 1997, Icarus, 130, 140
- (29) Fajardo-Acosta, S. B., Stencel, R. E., Backman, D. E., & Thakur, N. 1999, ApJ, 520, 215
- (30) Fixsen, D. J., & Dwek, E. 2002, ApJ, 578, 1009
- (31) Frayer, D.T. et al., 2006 AJ, 131, 250
- (32) Gautier, T. N., Rieke, G. H., Stansberry, J., Bryden, G. C., Stapelfeldt, K. R., et al. 2007, ApJ, 667, 527
- (33) Gladman, B., Kavelaars, J.J., Petit, J.M., Morbidelli, A., Holman, M.J., Loredo, Y. 2001, AJ, 122, 1051
- (34) Gordon, K. et al. 2005, PASP, 117, 503
- (35) Gregorio-Hetem, J., Lepine, J. R. D., Quast, G. R., Torres, C. A. O., de La Reza, R., 1992, AJ, 103, 549
- (36) Habing, H. J, Dominik, C., Jourdain d. M., Laureijs, R. J., et al. 2001, A&A, 365, 545
- (37) Hillenbrand et al. 2008 in preparation
- (38) Hines, D. C., Backmanm D, E, Bouwman, J., et al. 2006, ApJ, 638, 1070
- (39) Hines, D. C., Schneider, G., Hollenbach, D. et al. 2007, ApJ (Letters), in press
- (40) Hollenbach, D., Gorti, U., Meyer, M., et al. 2005, ApJ, 631, 1180
- (41) Jura, M. 2004, ApJ, 603, 729
- (42) Jura, M., Ghez, A.M., White, R.J., McCarthy, D.W., Smith, R.C., Martin, P.G. 2005, ApJ, 445, 451
- (43) Kalas, P., Graham, J.R., Clampin, M.C., Fitzgerald, M.P. 2006, ApJL, 637, 57
- (44) Kenyon, S. J., & Bromley, B. C. 2002, ApJ, 577, L35
- (45) Kenyon, S. J. & Bromley, B. C. 2005, AJ, 130, 269
- (46) Kim, J.S., Hines, D., Backman, D., Hillenbrand, L., Meyer, M., et al. 2005, ApJ, 632, 659
- (47) Kim et al. 2008, in prep.
- (48) Krivov, A.V., Mann, I., & Krivova, N.A. 2000, AA, 362, 1127
- (49) Landgraf, M., Liou, J.-C., Zook, H., & Grun, E. 2002, AJ, 123, 2857
- (50) Levison, H. F. & Morbidelli, A. 2003, Nature, 426, 419
- (51) Löhne, Torsten; Krivov, Alexander V.; Rodmann, Jens, ApJ, in press (arXiv0710.4294)
- (52) Low, F.J., Smith, P.S., Werner, M., Chen, C., Krause, V. et al. 2005, ApJ, 631, 1170
- (53) Mamajek, E.E., Meyer, M.R.; Hinz, P.M.; Hoffmann, W.F.; Cohen, M., Hora, J.L., 2004, ApJ, 612, 496
- (54) Mannings, V. & Barlow, M. J. 1998, ApJ, 497, 330
- (55) Matt, S. & Pudritz, R. E. 2007, (arXiv0707.0306) To appear in proceedings of IAU Symposium No. 243: Star-Disk Interaction in Young Stars
- (56) Metchev, S. A., Hillenbrand, L. A., & Meyer, M. R. 2004, ApJ, 600, 435
- (57) Metchev, S. et al. 2008, in preparation
- (58) Meyer, M.R., Backman, D.E., Weinberger, A.J., & Wyatt, M.C. 2007, in Protostars and Planets V, B. Reipurth, D. Jewitt, and K. Keil (eds.), University of Arizona Press, Tucson
- (59) Meyer, M. R., Carpenter, J. C., Mamajek, E. E., et al. 2008, ApJL, submitted
- (60) Meyer, M. R., Hillenbrand, L. A., Backman, D. E., et al. 2004, ApJS, 154, 422
- (61) Meyer, M.R. et al. 2006, PASP, December issue
- (62) Moór, A., Ábrahám, P., Derekas, A., Kiss, Cs., Kiss, L. L., Apai, D., Grady, C., &Henning, Th. 2006, ApJ, 644, 525
- (63) Morbidelli, A., Tsiganis, K., Crida, A., Levison, H.F., Gomes, R., 2007, AJ (astro-ph/0706.1713)
- (64) Moro-Martín, A. & Malhotra, R. 2002, AJ, 124, 2305
- (65) Moro-Martín, A.& Malhotra, R. 2003, AJ, 125, 2255
- (66) Moro-Martín, A., Carpenter, J.M., Meyer, M.R., Hillenbrand, L.A. et al. 2007a, ApJ, 658, 1312
- (67) Moro-Martín, A. Malhotra, R., Carpenter, J.M., Hillenbrand, L.A., Wolf, S., Meyer, M.R., Hollenbach, D., Najita, J., Henning, Th., 2007b, ApJ, 668, 1165
- (68) Najita, J. & Williams, J. P. 2005, ApJ, 635, 625
- (69) Najita, J. et al. 2008, in preparation
- (70) Neuhäuser, R., Walter, F. M., Covino, E., Alcalá, J. M., Wolk, S. J., et al. 2000. A&AS, 146, 323
- (71) Ozernoy, L.M., Gorkavyi, N.N., Mather, J.C. & Taidakova, T.A. 2000, ApJL, 537, 147
- (72) Padgett, D. L., Cieza, L., Stapelfeldt, K. R., Evans, N. J., II, Koerner, D., et al. 2006, ApJ, 645, 1283
- (73) Pascucci, I., Gorti, U., Hollenbach, D., et al. 2006, ApJ, 651, 1177
- (74) Pascucci, I., Hollenbach, D., Najita, J., et al. 2007, ApJ, 663, 383
- (75) Papovich, C., et al. 2004, ApJS, 154, 70
- (76) Patten, B. M. & Wilson, L. A. 1991, AJ, 102, 323
- (77) Rhee, J.H., Song, I., Zuckerman, B., & McElwain, M., 2007, ApJ, 660, 1556
- (78) Rieke, G. H., et al. 2004, ApJS, 154, 25
- (79) Rieke, G. H., Su, K. Y. L., Stansberry, J. A., Trilling, D., Bryden, G. et al. 2005, ApJ, 620, 1010
- (80) Silverstone, M.D. 2000, Ph. D. Thesis, University of California, Los Angeles
- (81) Silverstone, M., Meyer, M., Mamajek, E., Hines, D., Hillenbrand, L., et al. 2006, ApJ, 639, 1138
- (82) Smith, P. S., Hines, D. C., Low, F. J., Gehrz, R. D., Polomski, E. F., & Woodward, C. E. 2006, ApJL, 644, 125
- (83) Spangler, C., Sargent, A. I., Silverstone, M. D., Becklin, E. E., & Zuckerman, B. 2001, ApJ, 555, 923
- (84) Stapelfeldt, K.R., Holmes, E.K., Chen, C. et al. 2004, ApJS, 154, 458
- (85) Stauffer, J. R., Rebull, L. M., Carpenter, J. M., et al. 2005, 130, 1834
- (86) Stern, S.A., 1996a, AA, 310, 999
- (87) Stern, S.A., 1996b, AJ, 112, 1203
- (88) Stern, S.A. & Colwell, J. 1997, ApJ, 490, 879
- (89) Su, K. Y. L., Rieke, G. H., Misselt, K. A., Stansberry, J. A., Moro-Martín, A., et al. 2005, ApJ, 628, 487
- (90) Su, K. Y. L., et al. 2006, ApJ, 653, 675
- (91) Sylvester, R. J., Skinner, C. J., Barlow, M. J., & Mannings, V. 1996, MNRAS, 279, 915
- (92) Sylvester, R. J. & Mannings, V. 2000, MNRAS, 313, 73
- (93) Teplitz, V., Stern,S., Anderson, J., Rosenbaum, D., Scalise, R., & Wentzler, P. 1999, ApJ, 516, 425
- (94) Thébault, P., Augereau, J. C., & Beust, H. 2003, A&A, 408, 775
- (95) Thébault, P. & Augereau, J.-C. 2007, A&A, submitted
- (96) Wahhaj, Z., Koerner, D.W., & Sargent, A.I. 2007, ApJ, 661, 368
- (97) Weingartner, J. C. & Draine, B. T. 2001, ApJ, 548, 296
- (98) Williams, J. P., Najita, J., Liu, M. C., Bottinelli, S., Carpenter, J. M., Hillenbrand, L. A., Meyer, M. R., & Soderblom, D. R. 2004, ApJ, 604, 414
- (99) Wolf, S., & Hillenbrand, L. A. 2003, ApJ, 596, 603
- (100) Wood, B. E., Muller, H.-R., Zank, G. P., Linsky, J. L., & Redfield, S. 2005, ApJL, 628, 143
- (101) Wyatt, M. C. 2006, ApJ, 639, 1153
- (102) Wyatt, M. C., Smith, R., Su, K. Y. L., et al. 2007, APJ, 663, 365
| Source | d/pc | log Age/yr | SpT | Teff/K | log L/L⊙ | Previous Discussion of Mid-Infrared Excess | Comment |
|---|---|---|---|---|---|---|---|
| Tier 1 debris disks (excess SNR) | |||||||
| HD 105 | 40 | 7.5 | G0V | 5948 | 0.12 | Silverstone 2000; Meyer et al. 2004 | |
| HD 377 | 40 | 7.5 | G2V | 5852 | 0.09 | this paper | excess discovery |
| HD 6963 | 27 | 9.0 | G7V | 5517 | -0.26 | Kim et al. 2005 | excess discovery |
| HD 8907aa Previously known/suspected excess source placed on program for purpose of gas detection experiment. | 34 | 8.5 | F8 | 6250 | 0.32 | Silverstone 2000; Kim et al. 2005 | |
| HD 22179 | 100 | 8.0 | G5IV | 5986 | 0.36 | this paper | excess discovery |
| HD 25457aa Previously known/suspected excess source placed on program for purpose of gas detection experiment. | 19 | 8.0 | F7V | 6172 | 0.32 | Silverstone 2000 | |
| HD 31392 | 26 | 9.0 | K0V | 5357 | -0.26 | this paper | excess discovery |
| HD 35850aa Previously known/suspected excess source placed on program for purpose of gas detection experiment. | 27 | 7.5 | F7/8V | 6047 | 0.25 | Silverstone 2000 | |
| HD 37484aa Previously known/suspected excess source placed on program for purpose of gas detection experiment. | 60 | 8.0 | F3V | 6656 | 0.55 | Patten & Willson 1991; Spangler et al. 2001 | |
| HD 38207aa Previously known/suspected excess source placed on program for purpose of gas detection experiment. | 127 | 8.0 | F2V | 6769 | 0.72 | Silverstone 2000 | |
| HD 38529 | 42 | 9.5 | G8III/IV | 5361 | 0.82 | this paper; Moro-Martin et al. 2007b | excess discovery |
| HD 61005 | 35 | 8.0 | G3/5V | 5456 | -0.25 | this paper | excess discovery |
| HD 72905a,ba,bfootnotemark: | 14 | 8.0 | G1.5 | 5831 | -0.04 | Spangler et al. 2001 | |
| HD 85301 | 32 | 9.0 | G5 | 5605 | -0.15 | this paper | excess discovery |
| HD 104860 | 48 | 7.5 | F8 | 5950 | 0.12 | this paper | excess discovery |
| HD 107146 | 29 | 8.0 | G2V | 5859 | 0.04 | Metchev et al. 2004; Williams et al. 2004 | precursor work |
| HD 122652 | 37 | 9.5 | F8 | 6157 | 0.18 | Kim et al. 2005 | excess discovery |
| HD 145229 | 33 | 9.0 | G0 | 5893 | -0.02 | Kim et al. 2005 | excess discovery |
| HD 150706 | 27 | 9.0 | G3(V) | 5883 | -0.02 | Meyer et al. 2004 | excess discovery |
| HD 187897 | 33 | 9.0 | G5 | 5875 | 0.10 | this paper | excess discovery |
| HD 191089aa Previously known/suspected excess source placed on program for purpose of gas detection experiment. | 54 | 8.5 | F5V | 6441 | 0.50 | Sylvester & Mannings 2000 | |
| HD 201219cc See Carpenter et al. 2007a for caveats regarding Spitzer 70 m photometry of this source. | 36 | 9.0 | G5 | 5604 | -0.16 | this paper | excess discovery; small positional offset |
| HD 202917a,ba,bfootnotemark: | 46 | 7.5 | G5 | 5553 | -0.18 | Silverstone 2000 | |
| HD 209253aa Previously known/suspected excess source placed on program for purpose of gas detection experiment. | 30 | 8.0 | F6/7V | 6217 | 0.21 | Silverstone 2000 | |
| HD 219498 | 150 | 8.5 | G5 | 5671 | 0.69 | this paper | excess discovery |
| Tier 2 debris disks (excess SNR) | |||||||
| HD 17925a,ba,bfootnotemark: | 10 | 8.0 | K1V | 5118 | -0.43 | Habing et al 2001 | |
| HD 70573 | 46 | 8.0 | G1/2V | 5841 | -0.23 | this paper | moderate positional offset |
| HD 141943 | 67 | 7.5 | G0/2V | 5805 | 0.43 | this paper | moderate positional offset; excess detected with IRS |
| HD 204277 | 34 | 8.5 | F8 | 6190 | 0.29 | this paper | small positional offset |
| HD 206374 | 27 | 9.0 | G6.5 | 5580 | -0.17 | Kim et al. 2005, | excess discovery; moderate positional offset |
| MML 17 | 124 | 7.0 | G0IV | 6000 | 0.43 | this paper | some concern upon visual inspection |
| Primordial Disks | |||||||
| HD 143006aa Previously known/suspected excess source placed on program for purpose of gas detection experiment. | 145 | 6.5 | G6/8 | 5884 | 0.39 | Sylvester et al. 1996 | |
| PDS 66 | 86 | 7.0 | K1IVe | 5228 | 0.10 | Gregorio-Hetem et al. 1992 | |
| PZ99 J161411.0-230536 | 145 | 6.5 | K0 | 4963 | 0.50 | Mamajek et al. 2004 | |
| RX J1111.7-7620cc See Carpenter et al. 2007a for caveats regarding Spitzer 70 m photometry of this source. | 153 | 6.5 | K1 | 4621 | 0.21 | Spangler et al. 2001 | |
| RX J1842.9-3532 | 130 | 6.5 | K2 | 4995 | -0.01 | Neuhäuser et al. 2000 | |
| RX J1852.3-3700 | 130 | 6.5 | K3 | 4759 | -0.23 | Neuhäuser et al. 2000 | |
| Unconfirmed debris disks suggested in previous literature | |||||||
| HD 41700aa Previously known/suspected excess source placed on program for purpose of gas detection experiment. | 27 | 8.0 | F8/G0V | 6140 | 0.24 | Decin et al. 2000 | undetected by but 2.9 70um source in GO-2 program |
| HD 104467cc See Carpenter et al. 2007a for caveats regarding Spitzer 70 m photometry of this source. | 118 | 6.5 | G5III/IV | 5690 | 0.75 | candidate in this work | 70 m source is offset by 12.8” and likely unassociated |
| HD 134319aa Previously known/suspected excess source placed on program for purpose of gas detection experiment. | 44 | 8.0 | G5 | 5656 | -0.14 | Silverstone 2000 | |
| HD 216803a,ba,bfootnotemark: | 7.6 | 8.5 | K4 | 4625 | -0.71 | Fajardo-Acosta 1999 | |
| ScoPMS 214 | 145 | 6.5 | K0IV | 5318 | 0.26 | Spangler et al 2001 | possible excess at IRS but not detected at MIPS-70 |
| Source | 3.6 m | 4.5 m | 8.0 m | 13 mbb 70um and some other data for this target derives from a GTO program; see §2 in text. | 24 m | 33 mbb13 and 33 m synthetic photometry is derived from IRS low resolution spectra. For HD 206374 the 33 m spectrum has significant noise features appearing within the synthetic passband, resulting in low signal-to-noise. | 70 m | 160 m |
|---|---|---|---|---|---|---|---|---|
| Tier 1 debris disks (excess SNR) | ||||||||
| HD 105 | 1022.7 22.0 | 645.4 14.8 | 230.7 4.9 | 83.3 5.1 | 28.3 1.2 | 20.5 1.6 | 141.2 14.3 | 110.1 16.7 |
| HD 377cc160 m photometry is from a GO-2 or GO-3 program following up the 70 m detections reported here. Integration times are longer than standard observing procedures; see §2 in text. | 1029.1 22.1 | 648.6 14.9 | 234.7 5.0 | 81.6 5.0 | 36.6 1.5 | 37.8 2.7 | 162.0 16.9 | 187.5 50.4 |
| HD 6963 | 1211.3 26.0 | 752.9 17.3 | 271.5 5.8 | 91.2 5.6 | 32.5 1.3 | 21.8 2.0 | 44.0 8.6 | 61.1 29.1 |
| HD 8907cc160 m photometry is from a GO-2 or GO-3 program following up the 70 m detections reported here. Integration times are longer than standard observing procedures; see §2 in text. | 1918.2 41.2 | 1223.7 28.1 | 427.3 9.1 | 154.1 9.4 | 51.3 2.1 | 41.8 3.5 | 247.4 19.7 | 243.8 42.3 |
| HD 22179 | 311.7 6.7 | 196.2 4.5 | 71.0 1.5 | 26.7 1.7 | 11.1 0.5 | 10.8 0.8 | 35.9 10.6 | |
| HD 25457 | 6259.7 134.4 | 3956.3 90.8 | 1412.3 30.1 | 513.4 31.2 | 205.8 8.4 | 173.5 10.8 | 307.2 23.4 | 229.4 67.5 |
| HD 31392 | 1431.9 30.7 | 891.7 20.5 | 321.8 6.9 | 112.4 6.8 | 36.9 1.5 | 19.1 2.2 | 81.6 10.1 | 82.0 14.4 |
| HD 35850 | 3030.3 65.0 | 1917.9 44.0 | 690.7 14.7 | 246.6 15.0 | 83.5 3.4 | 54.6 4.2 | 40.3 8.0 | |
| HD 37484 | 893.7 19.2 | 568.1 13.4 | 202.2 4.4 | 77.8 4.7 | 54.6 2.2 | 76.2 4.7 | 114.4 11.2 | 29.3 14.0 |
| HD 38207 | 287.0 6.2 | 181.3 4.2 | 64.6 1.4 | 24.16 1.5 | 16.5 0.7 | 35.2 2.1 | 184.6 13.8 | 84.8 40.7 |
| HD 38529 | 5893.1 126.5 | 3634.0 83.4 | 1340.0 28.6 | 467.3 28.4 | 149.6 6.1 | 85.7 5.4 | 75.3 12.4 | 84.8 176.3 |
| HD 61005 | 753.5 16.2 | 472.3 10.8 | 169.2 3.6 | 62.3 3.8 | 41.5 1.7 | 110.0 6.7 | 628.7 45.4 | 502.6 160.1 |
| HD 72905dd13 and 33 m synthetic photometry is derived from IRS high resolution rather than low resolution spectrum. | 6226.5 133.6 | 3915.2 89.9 | 1411.5 30.1 | 163.5 6.7 | 44.5 6.3 | |||
| HD 85301 | 1050.8 22.6 | 652.1 15.0 | 234.2 5.3 | 86.6 5.3 | 36.8 1.5 | 28.5 2.2 | 38.5 7.5 | -2.6 15.8 |
| HD 104860 | 724.8 15.6 | 455.3 10.5 | 162.5 3.5 | 57.3 3.5 | 19.9 0.8 | 17.8 1.8 | 183.1 14.8 | 202.7 27.0 |
| HD 107146 | 1711.3 36.7 | 1074.8 24.7 | 384.4 8.2 | 138.9 8.5 | 59.8 2.5 | 86.7 5.7 | 669.1 47.8 | |
| HD 122652 | 1260.6 27.1 | 795.3 18.3 | 283.1 6.0 | 96.1 5.8 | 35.2 1.4 | 26.7 3.5 | 83.1 10.8 | 35.3 27.3 |
| HD 145229 | 1128.8 24.2 | 717.4 16.5 | 254.0 5.4 | 91.7 5.6 | 31.0 1.3 | 22.1 1.9 | 64.4 8.6 | 33.9 24.7 |
| HD 150706 | 1715.1 36.8 | 1077.0 24.7 | 388.1 8.3 | 135.7 8.3 | 44.9 1.8 | 28.0 2.7 | 41.3 8.5 | -28.7 19.9 |
| HD 187897 | 1495.5 32.1 | 934.1 21.4 | 338.7 7.2 | 113.5 6.9 | 39.8 1.6 | 23.2 3.2 | 61.6 9.3 | -40.2 65.3 |
| HD 191089c,dc,dfootnotemark: | 1071.7 23.0 | 678.4 15.6 | 242.2 5.2 | 185.6 7.6 | 544.3 40.1 | 204.6 44.6 | ||
| HD 201219 | 816.4 17.5 | 508.5 11.7 | 181.3 3.9 | 62.3 3.8 | 22.0 0.9 | 15.0 1.6 | 42.4 7.8 | 89.9 42.2 |
| HD 202917 | 519.2 11.1 | 320.8 7.4 | 117.3 2.8 | 43.0 2.6 | 19.2 0.8 | 21.1 1.5 | 37.1 6.5 | |
| HD 209253 | 2008.4 43.1 | 1285.3 29.5 | 454.5 9.7 | 167.6 10.2 | 55.9 2.3 | 48.1 3.8 | 75.0 10.6 | 17.6 21.4 |
| HD 219498 | 313.2 6.7 | 196.1 4.5 | 70.5 1.5 | 25.5 1.8 | 10.5 0.4 | 9.5 0.8 | 22.8 4.0 | -16.7 50.7 |
| Tier 2 debris disks (excess SNR) | ||||||||
| HD 17925dd13 and 33 m synthetic photometry is derived from IRS high resolution rather than low resolution spectrum. | 7280.6 156.3 | 4520.6 103.8 | 1644.6 35.1 | 624.0 38.0 | 193.6 7.9 | 134.7 8.2 | 57.0 12.3 | |
| HD 70573 | 381.6 8.2 | 239.7 5.5 | 86.4 1.8 | 32.7 2.1 | 10.4 0.4 | 5.8 0.8 | 14.8 5.8 | 29.7 30.0 |
| HD 141943 | 849.1 18.2 | 541.0 12.4 | 193.1 4.2 | 68.4 4.2 | 27.3 1.1 | 27.9 2.0 | 37.6 15.3 | |
| HD 204277 | 1847.5 39.7 | 1172.2 26.9 | 415.8 8.9 | 143.8 8.8 | 48.9 2.0 | 27.3 3.1 | 29.6 10.8 | |
| HD 206374 | 1389.1 29.8 | 871.1 20.0 | 312.1 6.7 | 106.5 6.5 | 35.2 1.4 | 54.1 67.4 | 18.1 6.8 | -1.3 30.8 |
| MML 17 | 228.1 4.9 | 145.0 3.3 | 52.2 1.1 | 19.2 1.2 | 9.8 0.4 | 9.5 0.8 | 18.0 7.7 | -11.7 85.7 |
| Primordial disks | ||||||||
| HD 143006 | 1069.4 23.0 | 929.9 21.4 | 792.1 16.9 | 737.7 44.9 | 2130.0 136.0 | 4111.6 250.1 | 3795.1 267.7 | 3228.1 400.2 |
| PDS 66cc160 m photometry is from a GO-2 or GO-3 program following up the 70 m detections reported here. Integration times are longer than standard observing procedures; see §2 in text. | 656.8 14.1 | 521.4 12.0 | 470.6 10.0 | 720.9 43.9 | 1874.0 120.0 | 1779.2 108.2 | 1672.0 118.0 | 2138.4 290.4 |
| PZ99 J161411.0-230536cc160 m photometry is from a GO-2 or GO-3 program following up the 70 m detections reported here. Integration times are longer than standard observing procedures; see §2 in text. | 498.3 10.7 | 401.9 9.2 | 363.5 7.8 | 349.1 21.2 | 304.0 12.5 | 209.3 12.7 | 91.1 13.3 | 43.1 100.4 |
| RX J1111.7-7620cc160 m photometry is from a GO-2 or GO-3 program following up the 70 m detections reported here. Integration times are longer than standard observing procedures; see §2 in text. | 447.9 9.6 | 363.5 8.3 | 198.7 4.4 | 160.9 9.8 | 229.6 9.4 | 217.5 13.2 | 224.3 17.8 | 445.4 183.6 |
| RX J1842.9-3532cc160 m photometry is from a GO-2 or GO-3 program following up the 70 m detections reported here. Integration times are longer than standard observing procedures; see §2 in text. | 269.5 5.8 | 216.2 5.0 | 157.3 3.4 | 100.7 6.1 | 358.9 14.7 | 429.4 26.1 | 942.6 67.4 | 844.0 114.8 |
| RX J1852.3-3700cc160 m photometry is from a GO-2 or GO-3 program following up the 70 m detections reported here. Integration times are longer than standard observing procedures; see §2 in text. | 88.6 1.9 | 58.5 2.3 | 33.6 1.2 | 35.0 2.1 | 472.2 19.4 | 749.4 45.6 | 1367.0 96.8 | 1490.1 195.7 |
| Source | 13m | 24 m | 33 m | 70 m | 160m | |||||
|---|---|---|---|---|---|---|---|---|---|---|
| Fexcess/F∗ | F aaExcess signal to noise ratio is calculated using total uncertainty on the photometry. | Fexcess/F∗ | F a,ba,bfootnotemark: | Fexcess/F∗ | F a,ba,bfootnotemark: | Fexcess/F∗ | F aaExcess signal to noise ratio is calculated using total uncertainty on the photometry. | Fexcess/F∗ | F aaExcess signal to noise ratio is calculated using total uncertainty on the photometry. | |
| Tier 1 debris disks (excess SNR) | ||||||||||
| HD 105 | 0.06 | 0.8 | 0.13 | 2.4 | 0.55 | 4.5 | 49.34 | 9.7 | 194.6 | 6.6 |
| HD 377 | 0.00 | 0.0 | 0.41 | 6.5 | 1.75 | 8.8 | 54.77 | 9.4 | 320.6 | 3.7 |
| HD 6963 | -0.06 | -0.9 | 0.05 | 0.9 | 0.33 | 2.6 | 11.73 | 4.7 | 87.00 | 2.1 |
| HD 8907 | 0.01 | 0.1 | 0.05 | 0.9 | 0.63 | 4.5 | 44.57 | 12.3 | 222.4 | 5.7 |
| HD 22179 | 0.09 | 1.2 | 0.42 | 6.1 | 1.62 | 7.9 | 40.12 | 3.3 | – | – |
| HD 25457 | 0.04 | 0.6 | 0.31 | 4.6 | 1.10 | 8.0 | 16.54 | 12.4 | 64.18 | 3.3 |
| HD 31392 | -0.003 | -0.1 | 0.02 | 0.4 | 0.01 | 0.1 | 19.27 | 7.7 | 100.3 | 5.6 |
| HD 35850 | 0.07 | 1.1 | 0.14 | 2.6 | 0.41 | 3.7 | 3.94 | 4.0 | – | – |
| HD 37484 | 0.10 | 1.3 | 1.43 | 13.6 | 5.43 | 13.5 | 44.67 | 10.0 | 57.2 | 2.1 |
| HD 38207 | 0.08 | 1.0 | 1.31 | 13.0 | 8.36 | 14.7 | 231.5 | 13.4 | 532.1 | 2.1 |
| HD 38529 | -0.04 | -0.5 | -0.04 | -0.6 | 0.04 | 0.5 | 3.33 | 4.7 | 23.29 | 0.5 |
| HD 61005 | 0.07 | 1.0 | 1.24 | 12.6 | 10.24 | 14.9 | 302.6 | 13.8 | 1207 | 3.1 |
| HD 72905 | – | – | -0.16 | -2.3 | – | – | 1.68 | 4.4 | – | – |
| HD 85301 | 0.02 | 0.3 | 0.36 | 5.8 | 1.00 | 6.4 | 11.73 | 4.7 | -5.21 | -0.2 |
| HD 104860 | 0.01 | 0.2 | 0.10 | 1.9 | 0.87 | 4.6 | 89.83 | 12.2 | 499.6 | 7.5 |
| HD 107146 | 0.03 | 0.5 | 0.40 | 6.3 | 2.84 | 11.2 | 139.0 | 13.9 | – | – |
| HD 122652 | -0.05 | -0.8 | 0.08 | 1.5 | 0.57 | 2.7 | 22.56 | 7.4 | 48.82 | 1.3 |
| HD 145229 | 0.02 | 0.3 | 0.09 | 1.6 | 0.46 | 3.7 | 19.19 | 7.2 | 51.86 | 1.3 |
| HD 150706 | 0.02 | 0.2 | 0.05 | 1.0 | 0.24 | 2.0 | 7.69 | 4.3 | -31.01 | -1.5 |
| HD 187897 | -0.06 | -0.9 | 0.03 | 0.6 | 0.14 | 0.9 | 13.29 | 6.2 | -47.42 | -0.6 |
| HD 191089 | – | – | 5.94 | 20.8 | – | – | 181.7 | 13.5 | 340.6 | 4.6 |
| HD 201219 | -0.03 | -0.4 | 0.07 | 1.4 | 0.39 | 2.7 | 17.56 | 5.2 | 194.9 | 2.1 |
| HD 202917 | 0.16 | 2.2 | 0.63 | 8.8 | 2.39 | 9.9 | 27.19 | 5.5 | – | – |
| HD 209253 | 0.09 | 1.2 | 0.14 | 2.4 | 0.86 | 5.7 | 12.69 | 6.5 | 14.96 | 0.8 |
| HD 219498 | -0.005 | -0.1 | 0.29 | 4.4 | 1.19 | 6.2 | 23.95 | 5.4 | -91.78 | -0.3 |
| Tier 2 debris disks (excess SNR) | ||||||||||
| HD 17925 | 0.07 | 1.0 | -0.21 | -4.2 | 0.37 | 4.2 | 1.74 | 2.9 | – | – |
| HD 70573 | 0.10 | 1.2 | 0.09 | 1.8 | 0.15 | 0.9 | 12.95 | 2.4 | 138.3 | 1.0 |
| HD 141943 | 0.08 | 1.1 | 0.35 | 5.6 | 1.61 | 8.6 | 15.66 | 2.3 | – | – |
| HD 204277 | -0.05 | -0.7 | 0.02 | 0.3 | 0.08 | 0.6 | 4.53 | 2.3 | – | – |
| HD 206374 | -0.05 | -0.8 | -0.03 | -0.7 | 1.86 | 0.5 | 3.61 | 2.1 | -2.71 | -0.1 |
| MML 17 | 0.07 | 0.9 | 0.72 | 8.6 | 2.13 | 8.1 | 27.17 | 2.3 | -92.5 | -0.1 |
| Source | Tcolor(13/33m) | Tcolor(24/33m) | (13-160m) | Tcolor(33/70m) | (13-160m) | Tcolor(70/160m) | (13-160m) |
|---|---|---|---|---|---|---|---|
| Tier 1 debris disks (excess SNR) | |||||||
| HD 105 | 212 | 93 | 23.9 | 46 | 2.97 | 57 | 13.0 |
| HD 377 | 69 | 93 | 13.2 | 58 | 3.92 | 46 | 14.0 |
| HD 6963 | – | 76 | 2.76 | 56 | 0.36 | 42 | 1.13 |
| HD 8907 | 123 | 59 | 14.0 | 48 | 0.08 | 50 | 0.24 |
| HD 22179 | 175 | 100 | 1.92 | 61 | 4.14 | – | – |
| HD 25457 | 157 | 106 | 15.0 | 70 | 1.41 | 58 | 6.67 |
| HD 31392 | – | – | – | 47 | 0.80 | 49 | 1.02 |
| HD 35850 | 265 | 120 | 1.59 | 82 | 0.65 | – | – |
| HD 37484 | 149 | 101 | 2.19 | 86 | 2.87 | 291 | 100 |
| HD 38207 | 133 | 76 | 12.5 | 59 | 7.9 | 88 | 100 |
| HD 38529 | – | – | – | 48 | 0.10 | 27 | 3.41 |
| HD 61005 | 111 | 68 | 7.7 | 58 | 3.93 | 57 | 7.32 |
| HD 72905 | – | – | – | 103cc For HD 191089, HD 72905, and HD 206374 the quoted color temperature between 33-70 m is actually from 24-70 m due to lack of or poor quality IRS data at 33 m. The quoted values are considered upper limits to the 33/70 color temperature, but are upper limits to the measured 24-70 m color temperature only in the case of HD 206374. | – | – | – |
| HD 85301 | 139 | 127 | 2.17 | 76 | 2.57 | 53 | 10.4 |
| HD 104860 | 124 | 67 | 29.6 | 45 | 0.55 | 47 | 0.58 |
| HD 107146 | 122 | 72 | 25.1 | 52 | 3.34 | – | – |
| HD 122652 | – | 71 | 4.50 | 55 | 0.53 | 63 | 1.61 |
| HD 145229 | 169 | 82 | 6.41 | 54 | 0.37 | 56 | 1.52 |
| HD 150706 | 181 | 91 | 2.78 | 58 | 0.12 | 48 | 0.42 |
| HD 187897 | – | 92 | 8.40 | 45 | 0.28 | 36 | 0.33 |
| HD 191089 | – | – | – | 92cc For HD 191089, HD 72905, and HD 206374 the quoted color temperature between 33-70 m is actually from 24-70 m due to lack of or poor quality IRS data at 33 m. The quoted values are considered upper limits to the 33/70 color temperature, but are upper limits to the measured 24-70 m color temperature only in the case of HD 206374. | 0.41 | 113 | 100 |
| HD 201219 | – | 83 | 4.24 | 53 | 0.53 | 36 | 1.56 |
| HD 202917 | 185 | 101 | 2.99 | 77 | 4.18 | – | – |
| HD 209253 | 211 | 77 | 0.86 | 70 | 0.59 | 68 | 7.05 |
| HD 219498 | – | 95 | 3.44 | 65 | 1.44 | 29 | 11.4 |
| Tier 2 debris disks (excess SNR) | |||||||
| HD 17925 | – | – | – | 110 | 0.32 | – | – |
| HD 70573 | – | – | – | 47 | 0.88 | 29 | 1.38 |
| HD 141943 | 167 | 90 | 0.35 | 81 | 0.58 | – | – |
| HD 204277 | – | – | – | 50 | 0.14 | – | – |
| HD 206374 | – | – | – | 74cc For HD 191089, HD 72905, and HD 206374 the quoted color temperature between 33-70 m is actually from 24-70 m due to lack of or poor quality IRS data at 33 m. The quoted values are considered upper limits to the 33/70 color temperature, but are upper limits to the measured 24-70 m color temperature only in the case of HD 206374. | 0.46 | 29 | 0.20 |
| MML 17 | 153 | 120 | 0.70 | 74 | 6.23 | 24 | 28.3 |
| Source | aaAdopted Tdust from among values in Table 4, typically the 33/70 color temperature, but other cases as footnoted. | log | log | |||
|---|---|---|---|---|---|---|
| assuming | assuming | |||||
| at | at 200 AU | |||||
| Tier 1 debris disks (excess SNR) | ||||||
| HD 105 | 46 | 42 | -3.5 | -3.1 | 0.004 | 0.4 |
| HD 377 | 58 | 23 | -3.4 | -3.4 | 0.004 | 0.3 |
| HD 6963 | 56 | 18 | -4.0 | -4.3 | 0.010 | 0.6 |
| HD 8907 | 48 | 49 | -3.6 | -3.1 | 0.008 | 0.9 |
| HD 22179 | 61eeWhile the adopted Tdust is from the 33/70 flux ratio, the hotter 24/33 value produces a lower to the overall SED; see Table 4. In these cases, contrary to situation of Tablenote , the Rinner, , and may be lower than we quote while may be higher, all in the blackbody assumption. | 31 | -3.6 | -3.4 | 0.010 | 0.8 |
| HD 25457 | 70 | 23 | -4.0 | -4.1 | 0.027 | 1.8 |
| HD 31392 | 49ddAdopted Tdust is from the 70/160 flux ratio rather than 33/70. | 24 | -3.8 | -3.8 | 0.005 | 0.3 |
| HD 35850 | 82 | 15 | -4.5 | -4.9 | 0.086 | 4.8 |
| HD 37484 | 86eeWhile the adopted Tdust is from the 33/70 flux ratio, the hotter 24/33 value produces a lower to the overall SED; see Table 4. In these cases, contrary to situation of Tablenote , the Rinner, , and may be lower than we quote while may be higher, all in the blackbody assumption. | 20 | -3.5 | -3.7 | 0.018 | 1.2 |
| HD 38207 | 59 | 51 | -3.0 | -2.4 | 0.005 | 0.5 |
| HD 38529 | 48bbIn the cases of temperature upper limits, Rinner , and are all minimum values while are maxima. | 86 | -4.6 | -3.5 | 0.150 | 30.7 |
| HD 61005 | 58 | 17 | -2.6 | -2.9 | 0.001 | 0.1 |
| HD 72905 | 103 | 7 | -4.7 | -5.8 | 0.110 | 4.2 |
| HD 85301 | 76eeWhile the adopted Tdust is from the 33/70 flux ratio, the hotter 24/33 value produces a lower to the overall SED; see Table 4. In these cases, contrary to situation of Tablenote , the Rinner, , and may be lower than we quote while may be higher, all in the blackbody assumption. | 11 | -3.9 | -4.6 | 0.012 | 0.6 |
| HD 104860 | 46ccAdopted Tdust is an average of consistent values from Table 4 | 42 | -3.2 | -2.8 | 0.002 | 0.2 |
| HD 107146 | 52 | 30 | -3.1 | -2.9 | 0.001 | 0.1 |
| HD 122652 | 55 | 31 | -3.9 | -3.7 | 0.014 | 1.1 |
| HD 145229 | 54 | 26 | -3.9 | -3.9 | 0.010 | 0.8 |
| HD 150706 | 58 | 23 | -4.3 | -4.4 | 0.027 | 1.9 |
| HD 187897 | 45bbIn the cases of temperature upper limits, Rinner , and are all minimum values while are maxima. | 43 | -4.0 | -3.6 | 0.014 | 1.4 |
| HD 191089 | 92 | 16 | -2.8 | -3.2 | 0.004 | 0.2 |
| HD 201219 | 53 | 23 | -3.9 | -4.0 | 0.007 | 0.5 |
| HD 202917 | 77eeWhile the adopted Tdust is from the 33/70 flux ratio, the hotter 24/33 value produces a lower to the overall SED; see Table 4. In these cases, contrary to situation of Tablenote , the Rinner, , and may be lower than we quote while may be higher, all in the blackbody assumption. | 11 | -3.6 | -4.3 | 0.005 | 0.3 |
| HD 209253 | 70 | 20 | -4.1 | -4.3 | 0.030 | 1.9 |
| HD 219498 | 65 | 41 | -3.7 | -3.3 | 0.027 | 2.5 |
| Tier 2 debris disks (excess SNR) | ||||||
| HD 17925 | 110 | 4 | -4.4 | -6.0 | 0.036 | 1.0 |
| HD 70573 | 41ccAdopted Tdust is an average of consistent values from Table 4 | 35 | -4.0 | -3.7 | 0.007 | 0.6 |
| HD 141943 | 85ccAdopted Tdust is an average of consistent values from Table 4 | 18 | -3.8 | -4.1 | 0.014 | 1.7 |
| HD 204277 | 50bbIn the cases of temperature upper limits, Rinner , and are all minimum values while are maxima. | 43 | -4.6 | -4.1 | 0.074 | 7.2 |
| HD 206374 | 74bbIn the cases of temperature upper limits, Rinner , and are all minimum values while are maxima. | 12 | -4.5 | -5.1 | 0.042 | 2.0 |
| MML 17 | 74eeWhile the adopted Tdust is from the 33/70 flux ratio, the hotter 24/33 value produces a lower to the overall SED; see Table 4. In these cases, contrary to situation of Tablenote , the Rinner, , and may be lower than we quote while may be higher, all in the blackbody assumption. | 23 | -3.7 | -3.7 | 0.018 | 1.2 |
| Source | /K bb is the difference between the 24/33 and 33/70 m color temperatures in Table 4, i.e. the temperature range that must be explained in the extended disk model. Quoted error is the root-sum-squared of the individual color temperature errors, ignoring the covariance term suggested by the appearance of the 33 m flux density in both color temperatures; asymmetric errors have been simply averaged. | cc is the inferred inner disk radius. | dd is the inferred outer disk radius. A value of 200 means that the outer boundary is indeterminate, even for = 0 models; for the fits it is held constant and only and are varied. | ee is the inferred surface density at , constant with radius in these models. The units of are dimensionless, in cm2 of grain cross section per cm2 of disk area, distinguished from the usual definition of which is in per cm2 of disk area. Note that high values are required in the narrower disk cases. | RMS Deviation ff RMS deviation of the spectral energy distribution from the constant surface density blackbody disk having , , and . This is the square root of the summed squared deviations divided by number of points (usually 4 from 24-160 m). |
|---|---|---|---|---|---|
| HD 85301 | 51 | 0.7 | 200 | 6.63 | 0.12 |
| HD 105 | 47 | 36.8 | 38 | 2.80 | 1.27 |
| MML 17 | 47 | 1.9 | 200 | 1.24 | 0.15 |
| HD 22179 | 39 | 6.4 | 200 | 1.66 | 0.66 |
| HD 377 | 36 | 8.5 | 137 | 3.15 | 1.05 |
| HD 25457 | 36 | 5.0 | 92 | 8.50 | 0.44 |
| HD 219498 | 31 | 11.6 | 200 | 1.57 | 0.40 |
| HD 202917 | 24 | 2.5 | 40 | 2.08 | 0.07 |
| HD 107146 | 20 | 13.6 | 200 | 9.52 | 0.93 |
| HD 38207 | 17 | 21.2 | 130 | 1.15 | 1.22 |
| HD 37484 | 15 | 8.2 | 34 | 4.35 | 0.87 |
| HD 61005 | 10 | 8.6 | 41 | 3.35 | 0.35 |
| HD 141943 | 9 | 8.6 | 40 | 1.95 | 0.01 |