Asymptotic Giant Branch Stars in the Phoenix Dwarf Galaxy
Abstract
near-infrared photometry of stars in the Phoenix dwarf galaxy is presented and discussed. Combining these data with the optical photometry of Massey et al. allows a rather clean separation of field stars from Phoenix members. The discovery of a Mira variable (P = 425 days), which is almost certainly a carbon star, leads to an estimate of the distance modulus of that is consistent with other estimates and indicates the existence of a significant population of age Gyr. The two carbon stars of Da Costa have and are consistent with belonging to a population of similar age; some other possible members of such a population are identified. A Da Costa non-carbon star is mag brighter than these two carbon stars. It may be an AGB star of the dominant old population. The nature of other stars lying close to it in the diagram needs studying.
keywords:
galaxies:dwarf - galaxies:stellar content - stars:AGB and post-AGB - stars: carbon1 Introduction
The present investigation of the Phoenix dwarf galaxy is part of a programme to study local group galaxies using the Japanese - South African 1.4m Infrared Survey Facility (IRSF) and sirius three-channel camera (Nagashima et al. 1999, Nagayama et al. 2003) at SAAO Sutherland.
Phoenix is a member of the Local Group and the most distant of the Milky Way’s satellite galaxies (e.g. Grebel (1999) fig. 3). It was discovered by Schuster & West (1976) who originally suggested it might be a globular cluster; Canterna & Flower (1977) established that it was a galaxy. Though its overall properties are consistent with a classification as a dwarf spheroidal, it also contains a relatively small young component and is thus often referred to as a dIrr/dSph (e.g. Mateo 1998). It is associated with an off-centre Hi cloud (Oosterloo, Da Costa & Staveley-Smith 1996; Young & Lo 1997; St-Germain et al. 1999). The origin of this cloud is not clear, although it may be formed from supernovae winds associated with the most recent epoch of star formation in the galaxy (Young et al. 2007). Though there have been a number of optical studies of Phoenix, this seems to be the first to describe observations.
2 Observations
Images centred on Phoenix were obtained over a period of about 3 years. A single observation comprises 10 dithered 30-s exposures which were reduced by means of the standard sirius pipeline (Nakajima private communication). Normally, three such sets of frames were combined to give an effective 900-s exposure in each of and ; when the seeing was poor, we combined six sets for an 1800-s exposure. Standard stars from Persson et al. (1998) were observed on each night and the results presented here are on the natural system of the sirius camera, but with the zero-point of the Persson et al. standards. These magnitudes are expected to be close to those on the 2MASS system (Kato et al. 2007). The field of view is arcmin, but this is reduced to arcmin during the course of the reductions. The scale is 0.45 arcsec . According to Canterna & Flower (1977) the optical size of Phoenix is arcmin. Thus our observations cover most of the galaxy.
Table 1 contains our results for all single stars measured on the images of Phoenix obtained for this investigation, together with positions allowing cross-identifications to the optical photometry of Massey et al. (2007; henceforth M2007), our identification number (N) which will be used in the text, and, in the last column, the magnitude derived from M2007. Mean magnitudes from all frames in each colour were used in compiling the table. The limiting magnitude is about 17.65 in where the typical internal error is 0.04 mag; typical errors in and are 0.03 mag or less. Table 3 contains individual observations and dates of the two red variables found in our work, which are discussed in section 4.
The and frames were compared visually to check for possible very red AGB stars, but none was found redder than the Mira (see section 4), down to mag.
| RA | Dec | N | J-H | H-Ks | J-Ks | I | |
|---|---|---|---|---|---|---|---|
| (J2000.0) | |||||||
| 27.70577 | -44.47683 | 50 | 16.93 | 0.65 | 0.04 | 0.68 | 18.34 |
| 27.70883 | -44.43503 | 122 | 17.54 | 0.71 | 0.08 | 0.78 | 19.16 |
| 27.71133 | -44.42600 | 129 | 17.46 | 0.69 | 0.07 | 0.76 | 19.11 |
| 27.71861 | -44.50923 | 8 | 15.36 | 0.71 | 0.17 | 0.88 | 17.24 |
| 27.72032 | -44.48024 | 49 | 16.69 | 0.36 | -0.07 | 0.29 | 17.37 |
| 27.72356 | -44.46934 | 88 | 17.11 | 0.76 | 0.11 | 0.87 | 18.98 |
| 27.72534 | -44.49939 | 26 | 15.79 | 0.36 | 0.02 | 0.39 | |
| 27.73110 | -44.44578 | 107 | 17.36 | 0.82 | 0.06 | 0.88 | 19.21 |
| 27.73291 | -44.41672 | 13 | 15.19 | 0.64 | 0.07 | 0.70 | 16.69 |
| 27.73303 | -44.42099 | 131 | 17.55 | 0.75 | 0.04 | 0.80 | 19.26 |
| 27.73541 | -44.43295 | 123 | 17.39 | 0.81 | 0.13 | 0.94 | 19.26 |
| 27.73560 | -44.48583 | 81 | 17.03 | 0.59 | 0.18 | 0.77 | 19.26 |
| 27.73603 | -44.47464 | 31 | 15.69 | 0.65 | 0.17 | 0.82 | 17.73 |
| 27.73785 | -44.43591 | 121 | 17.28 | 0.57 | 0.22 | 0.79 | |
| 27.74408 | -44.41630 | 134 | 17.31 | 0.78 | 0.16 | 0.93 | 19.17 |
| 27.74641 | -44.44115 | 3 | 13.15 | 0.64 | 0.04 | 0.69 | |
| 27.74851 | -44.48817 | 46 | 16.52 | 0.88 | 0.11 | 0.98 | 18.64 |
| 27.75006 | -44.44932 | 2 | 13.11 | 0.50 | 0.01 | 0.51 | 80.00 |
| 27.75215 | -44.42229 | 130 | 17.12 | 0.75 | 0.09 | 0.84 | 18.88 |
| 27.75259 | -44.46943 | 52 | 16.59 | 0.85 | 0.09 | 0.94 | 18.61 |
| 27.75265 | -44.44532 | 108 | 17.46 | 0.66 | 0.03 | 0.69 | 18.89 |
| 27.75280 | -44.44059 | 120 | 17.44 | 0.81 | 0.12 | 0.93 | 19.52 |
| 27.75411 | -44.47115 | 51 | 15.03 | 1.19 | 0.89 | 2.08 | |
| 27.75417 | -44.44467 | 112 | 17.32 | 0.66 | 0.03 | 0.70 | 18.78 |
| 27.75427 | -44.45249 | 12 | 15.39 | 0.83 | 0.12 | 0.95 | 17.42 |
| 27.75427 | -44.45694 | 7 | 14.49 | 0.44 | -0.01 | 0.43 | |
| 27.75441 | -44.44759 | 32 | 15.88 | 0.72 | 0.09 | 0.81 | 17.54 |
| 27.75442 | -44.44666 | 105 | 17.68 | 0.42 | 0.01 | 0.42 | 18.23 |
| 27.75659 | -44.40777 | 136 | 17.56 | 0.67 | 0.05 | 0.71 | 19.16 |
| 27.75774 | -44.45494 | 97 | 17.33 | 0.83 | 0.11 | 0.94 | 19.25 |
| 27.75827 | -44.44532 | 56 | 16.54 | 0.86 | 0.13 | 0.99 | 18.64 |
| 27.76108 | -44.41770 | 133 | 17.34 | 0.75 | 0.10 | 0.85 | 19.18 |
| 27.76173 | -44.44854 | 55 | 16.49 | 0.75 | 0.07 | 0.82 | 18.18 |
| 27.76268 | -44.44494 | 110 | 17.47 | 0.82 | 0.07 | 0.89 | 19.23 |
| 27.76659 | -44.48769 | 47 | 16.58 | 0.67 | 0.10 | 0.77 | 18.22 |
| 27.76702 | -44.44343 | 114 | 17.65 | 0.59 | 0.07 | 0.66 | 19.00 |
| 27.76729 | -44.45500 | 96 | 17.44 | 0.75 | 0.10 | 0.84 | 19.24 |
| 27.76815 | -44.45673 | 94 | 17.60 | 0.80 | 0.12 | 0.92 | 19.40 |
| 27.76831 | -44.48687 | 48 | 16.64 | 0.62 | 0.17 | 0.79 | 18.38 |
| 27.76916 | -44.42640 | 5 | 13.95 | 0.38 | -0.00 | 0.38 | |
| 27.76964 | -44.45859 | 6 | 14.32 | 0.59 | 0.17 | 0.76 | 16.11 |
| 27.77019 | -44.48075 | 83 | 17.20 | 0.74 | 0.10 | 0.84 | 19.00 |
| 27.77352 | -44.48684 | 80 | 17.30 | 0.82 | 0.13 | 0.94 | 19.13 |
| 27.77360 | -44.43816 | 33 | 15.94 | 0.87 | 0.27 | 1.14 | 18.24 |
| 27.77402 | -44.49752 | 10 | 15.47 | 0.36 | -0.00 | 0.36 | 16.24 |
| 27.77405 | -44.45512 | 53 | 16.24 | 0.68 | 0.14 | 0.82 | 18.05 |
| 27.77557 | -44.43107 | 125 | 17.56 | 0.81 | 0.12 | 0.93 | 19.43 |
| 27.77731 | -44.44379 | 113 | 17.46 | 0.75 | 0.10 | 0.85 | 19.23 |
| 27.77740 | -44.43351 | 60 | 16.73 | 0.82 | 0.14 | 0.96 | 18.69 |
| 27.77798 | -44.45670 | 93 | 17.43 | 0.80 | 0.13 | 0.93 | 19.36 |
| 27.77821 | -44.50607 | 71 | 17.22 | 0.78 | 0.15 | 0.92 | 19.08 |
| 27.77984 | -44.44510 | 109 | 17.48 | 0.82 | 0.10 | 0.91 | 19.36 |
| 27.78000 | -44.45448 | 98 | 17.38 | 0.83 | 0.13 | 0.96 | 19.29 |
| 27.78031 | -44.44961 | 104 | 17.05 | 0.74 | 0.08 | 0.83 | 18.82 |
| 27.78081 | -44.44227 | 116 | 16.83 | 0.87 | 0.36 | 1.23 | |
| 27.78131 | -44.45070 | 103 | 17.50 | 0.74 | 0.14 | 0.88 | 19.25 |
| 27.78158 | -44.48930 | 78 | 17.09 | 0.67 | 0.11 | 0.78 | 18.60 |
| 27.78170 | -44.45373 | 99 | 17.62 | 0.84 | 0.10 | 0.94 | 19.51 |
| 27.78273 | -44.41102 | 14 | 14.72 | 0.41 | 0.03 | 0.44 | 15.25 |
| 27.78391 | -44.45143 | 101 | 17.29 | 0.83 | 0.09 | 0.92 | 19.20 |
| 27.78412 | -44.47465 | 86 | 17.46 | 0.77 | 0.09 | 0.86 | 19.26 |
| 27.78465 | -44.47567 | 84 | 17.53 | 0.76 | 0.12 | 0.88 | 19.39 |
| RA | Dec | N | J-H | H-Ks | J-Ks | I | |
|---|---|---|---|---|---|---|---|
| (J2000.0) | |||||||
| 27.78534 | -44.50643 | 41 | 16.59 | 0.82 | 0.17 | 1.00 | 18.68 |
| 27.78607 | -44.45109 | 54 | 16.80 | 0.68 | 0.08 | 0.76 | 18.35 |
| 27.78643 | -44.42723 | 128 | 17.48 | 0.69 | 0.23 | 0.91 | 19.48 |
| 27.78651 | -44.43156 | 124 | 17.29 | 0.81 | 0.11 | 0.93 | 19.23 |
| 27.78669 | -44.44216 | 117 | 17.75 | 0.72 | -0.00 | 0.72 | 19.33 |
| 27.78671 | -44.42488 | 34 | 15.25 | 1.05 | 0.53 | 1.57 | 19.48 |
| 27.78732 | -44.47034 | 87 | 16.90 | 0.81 | 0.15 | 0.96 | 19.00 |
| 27.78837 | -44.48860 | 4 | 13.30 | 0.45 | 0.01 | 0.46 | |
| 27.79029 | -44.47513 | 85 | 17.37 | 0.83 | 0.13 | 0.96 | 19.29 |
| 27.79328 | -44.42856 | 126 | 17.02 | 0.79 | 0.12 | 0.91 | 19.00 |
| 27.79454 | -44.51225 | 40 | 16.26 | 0.69 | 0.17 | 0.86 | 17.92 |
| 27.79501 | -44.41957 | 61 | 16.76 | 0.65 | 0.06 | 0.71 | 18.29 |
| 27.79895 | -44.45101 | 102 | 16.85 | 0.67 | 0.14 | 0.81 | 18.55 |
| 27.80202 | -44.45618 | 95 | 17.54 | 0.77 | 0.10 | 0.87 | 19.32 |
| 27.80302 | -44.40294 | 35 | 16.01 | 0.58 | 0.09 | 0.67 | 17.49 |
| 27.80355 | -44.40904 | 135 | 17.53 | 0.76 | 0.13 | 0.89 | 19.41 |
| 27.80573 | -44.46179 | 91 | 17.43 | 0.78 | 0.02 | 0.81 | 19.13 |
| 27.80617 | -44.50018 | 72 | 17.55 | 0.67 | 0.07 | 0.74 | 19.67 |
| 27.80866 | -44.46093 | 92 | 17.57 | 0.83 | 0.11 | 0.93 | 19.43 |
| 27.80904 | -44.44226 | 57 | 16.56 | 0.87 | 0.16 | 1.04 | 18.78 |
| 27.81347 | -44.50706 | 70 | 17.43 | 0.78 | 0.14 | 0.91 | 19.27 |
| 27.81846 | -44.40759 | 137 | 17.36 | 0.74 | 0.04 | 0.79 | 19.19 |
| 27.81927 | -44.51210 | 69 | 17.33 | 0.67 | 0.17 | 0.83 | 18.95 |
| 27.82514 | -44.39088 | 62 | 16.63 | 0.56 | 0.23 | 0.79 | |
| 27.82563 | -44.45501 | 11 | 15.37 | 0.68 | 0.12 | 0.81 | 17.15 |
| 27.82798 | -44.46254 | 90 | 17.55 | 0.78 | 0.08 | 0.85 | 19.33 |
| 27.83021 | -44.44322 | 115 | 17.63 | 0.71 | 0.05 | 0.76 | 19.28 |
| 27.83413 | -44.39202 | 141 | 17.55 | 0.59 | 0.25 | 0.84 | 19.45 |
| 27.83445 | -44.48040 | 30 | 15.66 | 0.71 | 0.07 | 0.78 | 17.28 |
| 27.83794 | -44.44127 | 118 | 17.53 | 0.79 | 0.14 | 0.93 | 19.38 |
| 27.83868 | -44.46736 | 89 | 17.25 | 0.61 | 0.18 | 0.79 | 18.97 |
| 27.84202 | -44.45187 | 100 | 17.59 | 0.40 | 0.12 | 0.52 | 18.15 |
| 27.84331 | -44.42792 | 127 | 17.60 | 0.77 | 0.19 | 0.95 | 19.48 |
3 Colour-Magnitude and Colour-Colour Diagrams
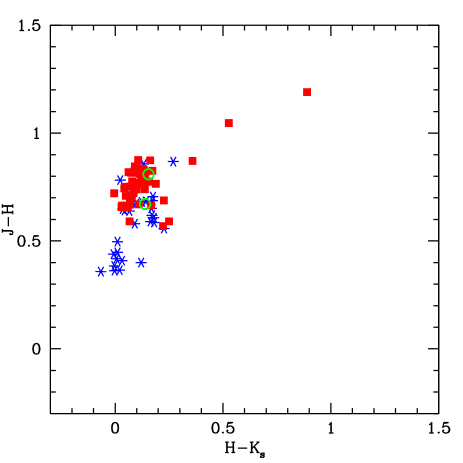
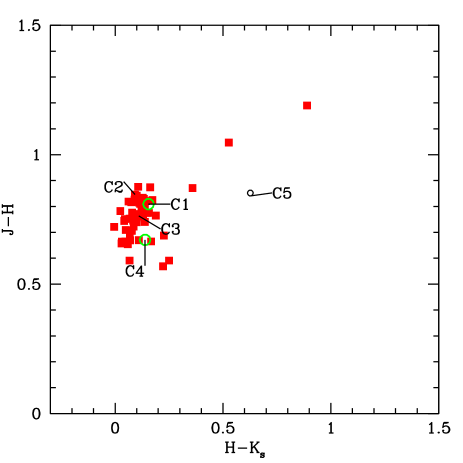
Fig. 1 shows the diagram and Fig. 2 the diagram for all single stars measured on the images centred on Phoenix that were obtained for this investigation. The photometry reduction program considered another five objects as double, and these were not plotted as the individual magnitudes were too uncertain. In discussing these figures we assume a distance modulus of 23.1 mag for Phoenix (see section 4). The blue stars in a vertical sequence with in Fig. 1 are almost certainly field stars. This can be seen, for instance, by comparing with the similar figures in Menzies et al. (2002; henceforth JWM2002) for Leo I, obtained with the same instrumental arrangement. There are somewhat fewer of these stars in the Phoenix field. This is probably due to the higher galactic latitude ( (Phoenix); (Leo I)). Other stars which are likely to be field stars (see below) are also marked as asterisk-shaped symbols. In Fig 2. the clear separation of many of the likely field stars from the members is apparent. There is some similarity of the distribution of points in this diagram with that for Leo I (JWM2002); there is a clump of stars with as in Leo I, and a few redder ones that in Leo I are all carbon stars and mostly variable. A comparison between Phoenix and Leo I is made below (see section 3). The two carbon stars discovered by Da Costa (1994) are also marked on these figures.
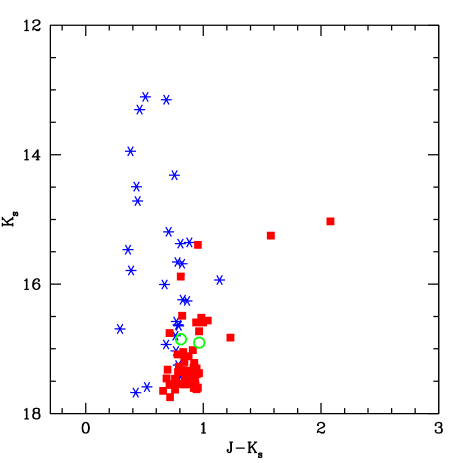
The interpretation of the colour-magnitude diagram and the elimination of likely foreground stars is helped considerably by combining our data with the optical photometry of Massey et al. (2007). This is particularly important in establishing the AGB population of the galaxy. Held et al. (1999) have suggested (see their fig. 11) that there is a significant population of AGB stars in Phoenix with and , but the separation from field stars is difficult (cf. Martinez-Delgado et al. 1999).
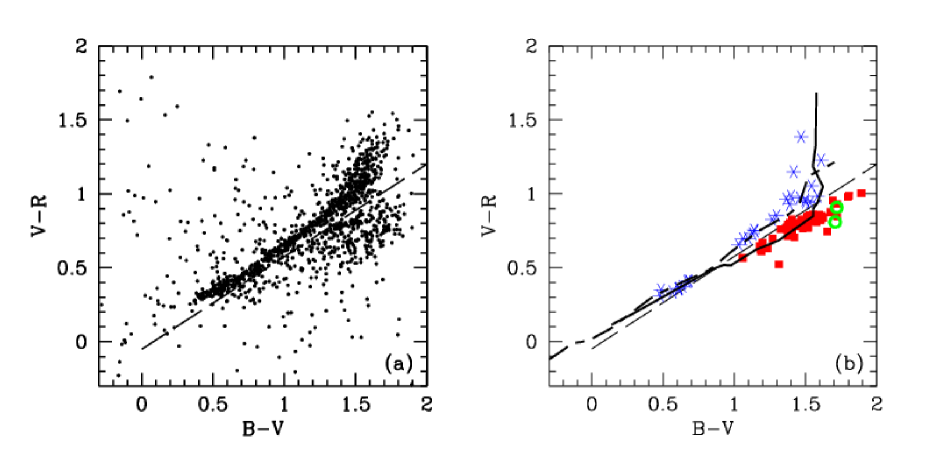
Fig 3(a) is a diagram for objects with and quoted uncertainties in both co-ordinates less than 0.1 mag from the observations of M2007. These cover an area of 34 x 34 arcmin centred on Phoenix. Since this area is much larger than the galaxy itself, the bulk of the stars plotted are field objects. In particular, the heavily populated areas in this diagram are likely to contain a high proportion of field stars. Especially at the redder colours the stars in this diagram divide rather clearly into two groups (presumably giants and dwarfs). The dashed line, extrapolated to bluer colours, approximately marks this division.
| DaCosta | vdRDK | This | Spectroscopy |
|---|---|---|---|
| C1 | 481 | 87 | carbon |
| C2 | 52 | not carbon | |
| C3 | 391? | 88 | not carbon |
| C4 | 166 | 102 | carbon |
| C5 | 106 | not carbon |
Note: Stars originally selected by M Irwin. vdRDK: van de Rydt et al. (1991),
In Fig 3(b) the dashed line from Fig 3(a) is repeated and stars in common between out survey and M2007 are plotted. The curves show the loci of normal giants and dwarfs. Using the division into two sequences and the density of the M2007 points in Fig 3(a), we divide our stars into probable field stars (asterisks) and probable Phoenix members (squares). The differing distribution of the stars in the whole M2007 sample and those in common with our survey, strongly suggests that the stars below the dashed line (the likely giant region) have a high probability of being Phoenix members and we have taken them as such. Note particularly the concentration of stars in common, below the dotted line and with , strongly indicating membership. The Bahcall-Soneira model (Bahcall & Soneira 1980) predicts 24 field stars with for a field of our size at and 32 at , (Phoenix has , ). In view of the small number statistics the number of stars rejected here (35) seems to be of the correct order. Fig. 4 is an diagram of stars in common with M2007 with field stars and members distinguished. The distribution of probable field stars in this figure supports their classification as such.
There is a sparse population of young, blue, stars in Phoenix. This has an upper brightness limit of about (M2007 fig. 20). Since the colours of these stars must be within a few tenths of a magnitude of zero, they will be too faint to be in our survey.
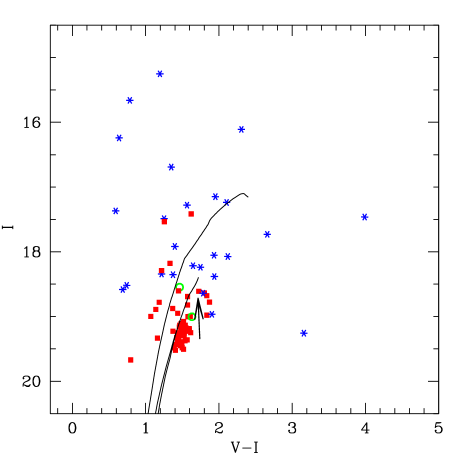
Figs. 5 and 6 are and plots for Phoenix with the likely field stars removed. In Figs. 4 and 5 we show isochrones (RGB and AGB) for z = 0.001, age 14 Gyr and z = 0.002, age 1 Gyr from Girardi et al. (2000, 2002). The RGB tip (TRGB) for the 14 Gyr model occurs at and (i.e. very close to the values observed, as will be discussed below), while that for the 1 Gyr model is at and 111As will be discussed in section 4, the reddening of the Phoenix stars is small enough to be neglected in these comparisons with iscochrones.. Note that the isochrones provide only a qualitative illustration of the populations which might be present and they suggest that the members of the dwarf galaxy are on the RGB and AGB of a population with a large range of ages. These late stages of stellar evolution are not well understood and models by different authors provide significantly different tracks, e.g. AGB isochrones from Pietrinferni et al. (2004) terminate several magnitudes fainter than those illustrated. Furthermore, there are as yet no examples of AGB models which provide a good fit to observations over a range of wavelengths.
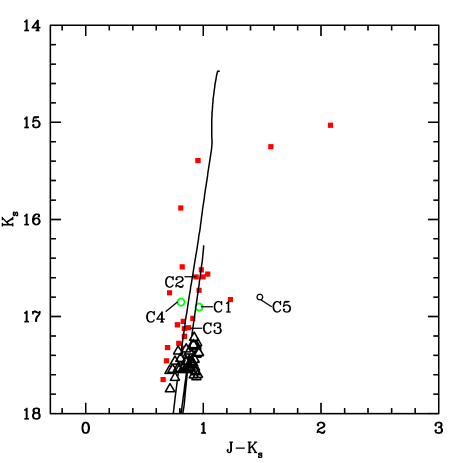
M2007 suggest that Phoenix may contain a population of yellow supergiants, though they recognize that it is difficult in their work to distinguish galaxy members from foreground stars. Since their yellow supergiant sequence extends up to of about 15 mag and since may well be significant (1 or greater), it seems possible that the bright star in Fig. 5 with of about 0.9 and of about 15.3 may be such a star.
The absolute magnitude of the TRGB in depends on metallicity and age. Estimates of the metallicity of the old population of Phoenix ranging from –1.37 to –1.8 have been given (Gallart et al. 2004; Holtzman et al. 2000; Held et al. 1999). If the main population of Phoenix is of globular cluster age and has a metallicity of we would expect the TRGB to be at (Salaris & Girardi 2005), corresponding to in Phoenix. We would then identify the near vertical, sequence of stars with and fainter than as mainly due to this population. Such a population will not produce normal, intrinsic, carbon stars, which are expected to belong to an intermediate age population. The possibility that these objects are extrinsic carbon stars seems remote, especially since they lie above the TRGB of even the old population (see section 4).
Our identification of the TRGB of the main population at is entirely consistent with data at other wavelengths. The presence of a TRGB in the range to 19.00 was clearly established in the work of van de Rydt et al. (1991), Martinez-Delgado et al. (1999), Held et al. (1999), and Holtzman et al. (2000). Table A1 of our appendix shows that all our probable AGB stars have magnitudes brighter than this. (The only one close to the tip is one of the carbon stars). A TRGB near is also evident in Fig. 4 and the stars there are those showing a tip at in Fig. 5. One can also compare the results for Phoenix with RGB predictions. The recent review by Bellazzini (2007), his fig. 5, leads to a predicted TRGB at for a colour at the tip of as in our case and for our adopted distance modulus. As regards , his fig. 4 (or his eq. 2, corrected for errors in sign) leads to a TRGB of at our adopted distance and with at the tip (Held et al. 1999). Evidently there is good consistency between the results from the TRGB at and that at .
In addition to finding two carbon stars, Da Costa (1994) obtained spectra of three other stars in which he found no evidence of carbon-star features; we presume these to be oxygen-rich. They are listed in Table 3 with their identifications from van de Rydt et al. (1991) and our numbers. The non-carbon stars are also marked in Figs. 5 and 6. C5 is a double, possibly of field dwarfs. C2 and C3 are among our presumed members. The position of C3 in Fig. 5, immediately below the two C stars, suggests that it may be an intermediate age star marking a lower limit to carbon star formation or it may be a member of the old population and near its TRGB.
In Fig. 5 there are a number of stars fainter than which are plotted as squares because they have magnitudes brighter than the TRGB (they are mainly in the range to 19.0. In both Figs. 4 and 5 these stars lie to the blue of the main concentrations. The most likely explanation of these stars is that they are AGB stars of an intermediate age population and may well be coeval with the carbon stars.
The seven stars immediately above the two carbon stars (and slightly redder) in Fig. 5 constitute an interesting problem. Table A1 in the appendix lists optical and infrared data for these stars and for the two spectroscopic carbon stars. Evidently the seven stars have colours rather similar to the known carbon stars and on these grounds would be strong C star candidates. This, together with their position immediately above the C stars in Fig. 6, would be entirely in accord with expectation (see for instance the distribution of C stars in the Leo I diagram (JWM2002). However, one of these stars, Da Costa C2, our No. 52, is not a spectroscopic carbon star. The nature of this star and possibly of the other six stars in this group remains to be determined.
Table A2 in the appendix lists standard infrared sequences for giants and dwarfs from Bessell & Brett (1988) that have been converted to the 2MASS system (which is close to the IRSF system) using the relations in Carpenter (2001). Table A3 contains optical data for extreme subdwarfs listed by Gizis (1997) together with 2MASS data for these stars. Comparison of these tables with the data for our seven stars shows the following: their and are too red for them to be normal dwarfs. From their optical colours some, or all, of them (including C2 = 52) could be extreme subdwarfs (compare their positions in a plot such as fig. 9 of Gizis). However, their infrared colours are too red for such an assignment, being reasonably similar to those of late type giants. On the other hand, several have suspiciously red values both for normal giants and for metal-poor (globular cluster type) giants. Furthermore, as late-type giants they would be very distant (extragalactic) and thus strong Phoenix candidates. Comparison with the isochrones shown in Figs. 4 and 5 suggests that C2 is best interpreted as an AGB star of the very old population. Evidently, spectral type and radial velocity data are required for the other stars in this group to determine whether or not they are similar to C2 or whether they are carbon stars.
A comparison of Figs. 5 and 6 with the and diagrams of the dwarf spheroidal Leo I (JWM2002) is of interest. The reddening of both galaxies is small and the distance modulus of Phoenix is mag greater than that of Leo I. The faintest known carbon stars in Leo I are at and are thus intrinsically brighter by mag than the Da Costa (1994) carbon stars in Phoenix. The two very red and variable stars in Phoenix (see section 4) have whilst there are red variables in Leo I with in the range 13.8-14.5 and so roughly equivalent. However, there is a marked difference in the AGB between the two galaxies. In Leo I there is a well populated sequence of carbon stars extending from about 15.5, 0.9 to 13.9, 1.7. In Phoenix, whilst the low-amplitude variable (star 34) lies near the upper end of such a sequence at and there are no stars in this sequence between it and the small clump of stars containing C2. The difference between Phoenix and Leo I is even more marked, if, as discussed above the stars in this clump are not C stars. These differences are most likely related to the different star formation histories of these dwarf galaxies.
4 Variable Stars and Distance
As Figs. 1 and 2 show there are two outstanding red stars in Phoenix. We find both stars to be variable. The observations are listed in Table 3 with the Julian Dates for the observations. Star number 34 is a low amplitude variable. No convincing period is evident in our measures though it varies on a time scale of 200 to 300 days. The measurements for this star in Table 1 are simply the means of the individual values in Table 3.
| JD | ||||||
|---|---|---|---|---|---|---|
| Star 51 | ||||||
| 2507.11817 | 17.979 | 0.024 | 16.610 | 0.014 | 15.562 | 0.013 |
| 2813.14560 | 16.961 | 0.008 | 15.717 | 0.004 | 14.860 | 0.005 |
| 2881.02012 | 17.652 | 0.014 | 16.237 | 0.007 | 15.190 | 0.005 |
| 2962.85237 | 18.070 | 0.030 | 16.655 | 0.009 | 15.498 | 0.008 |
| 3010.80022 | 18.051 | 0.039 | 16.618 | 0.010 | 15.410 | 0.008 |
| 3173.12370 | 16.577 | 0.009 | 15.479 | 0.008 | 14.718 | 0.009 |
| 3256.06266 | 16.981 | 0.010 | 15.763 | 0.010 | 14.848 | 0.010 |
| 3260.06350 | 16.993 | 0.009 | 15.798 | 0.009 | 14.879 | 0.005 |
| 3292.92197 | 17.271 | 0.014 | 16.020 | 0.010 | 15.059 | 0.010 |
| 3349.86790 | 17.565 | 0.020 | 16.315 | 0.009 | 15.242 | 0.011 |
| 3352.82444 | 17.579 | 0.017 | 16.308 | 0.009 | 15.302 | 0.009 |
| 3440.73494 | 17.204 | 0.026 | 16.044 | 0.016 | 15.143 | 0.014 |
| 3531.16565 | 16.284 | 0.009 | 15.351 | 0.007 | 14.711 | 0.008 |
| 3612.08834 | 16.372 | 0.015 | 15.308 | 0.010 | 14.692 | 0.020 |
| 3615.01896 | 16.412 | 0.010 | 15.361 | 0.009 | 14.684 | 0.009 |
| Star 34 | ||||||
| 2507.11817 | 16.881 | 0.010 | 15.819 | 0.008 | 15.286 | 0.011 |
| 2813.14560 | 17.033 | 0.012 | 15.942 | 0.004 | 15.345 | 0.005 |
| 2881.02012 | 16.887 | 0.010 | 15.846 | 0.005 | 15.265 | 0.006 |
| 2962.85237 | 16.823 | 0.010 | 15.807 | 0.007 | 15.259 | 0.009 |
| 3010.80022 | 16.805 | 0.014 | 15.749 | 0.007 | 15.221 | 0.008 |
| 3173.12370 | 16.916 | 0.012 | 15.839 | 0.009 | 15.272 | 0.009 |
| 3256.06266 | 16.833 | 0.010 | 15.777 | 0.008 | 15.269 | 0.009 |
| 3260.06350 | 16.822 | 0.009 | 15.782 | 0.010 | 15.255 | 0.007 |
| 3292.92197 | 16.720 | 0.009 | 15.698 | 0.009 | 15.173 | 0.009 |
| 3349.86790 | 16.757 | 0.009 | 15.738 | 0.008 | 15.205 | 0.013 |
| 3352.82444 | 16.800 | 0.010 | 15.721 | 0.007 | 15.202 | 0.009 |
| 3440.73494 | 16.889 | 0.019 | 15.816 | 0.014 | 15.287 | 0.015 |
| 3531.16565 | 16.617 | 0.013 | 15.653 | 0.010 | 15.162 | 0.010 |
| 3612.08834 | 16.814 | 0.020 | 15.769 | 0.015 | 15.214 | 0.026 |
| 3615.01896 | 16.699 | 0.009 | 15.673 | 0.009 | 15.199 | 0.009 |
Star 51 is a large amplitude (Mira) variable with P = days, Fourier mean magnitudes of and . Light curves are shown in Fig. 7. The light curve clearly shows that the star was brightening on a long time scale during the time of our observations. This is typical behaviour for a carbon Mira (e.g. Whitelock et al. 2006). Such stars are obscured from time to time owing to the ejection of material into the line of sight.

Previous authors (van de Rydt et al. 1991, Martinez-Delgado et al. 1999, Held et al. 1999, Holtzman et al. 2000) have adopted a reddening of mag from the work of Burstein & Heiles (1982) and we adopt this value. Whilst there is undoubtedly some uncertainty in this, the reddening at the galactic latitude of Phoenix () must be small and any reasonable change will have little or no effect on our discussion. Then, converting the photometry to the SAAO system using the relations of Carpenter (2001) we obtain for the Mira (star 51) and . Here the bolometric correction to was derived from the relation given by Whitelock et al. (2006, their equation 10), which is derived for carbon stars. We assume both this star and the other variable are carbon stars in view of their red colours and the presence of other carbon stars in the galaxy.
The Mira (star 51) is the candidate long period variable ID 11263 of Gallart et al. (2004). For this star their mean results are . It is the reddest likely member in their diagram. Since it lies on a reasonable extension of the RGB/AGB and not fainter as it would be if it suffered from strong circumstellar extinction, the very red must be mainly intrinsic to the star and is consistent with its being a carbon star rather than a highly reddened oxygen-rich Mira. Comparison with figs. 7 and 8 of Whitelock et al. (2006) shows that in diagrams the two Phoenix variables lie close to Galactic and LMC carbon-rich Miras and SR variables. In an diagram (Whitelock et al. 2006, fig. 11) the Phoenix Mira lies in the region occupied by Galactic carbon Miras and bluer than the known LMC carbon Miras, except for two LMC stars believed to be undergoing hot-bottom burning (HBB). It is unlikely that it is an HBB star (see below). Whether this difference from the LMC carbon stars is significant or not depends at least partly on whether Phoenix contains redder (i.e. more dust enshrouded) stars which might be below our detectable brightness limit.
Of the six candidate LPVs identified by Gallart et al. (2004) only three fall in the area we surveyed. One of these is the Mira discussed above the other two are our numbers 88 (their ID 11200) and 102 (their ID 8563). The photometry of these two stars has marginally larger standard deviations in all colours than stars of corresponding brightness, but there is no clear periodicity in either. Note that star 102 is a Carbon star (C4 of Da Costa) and the star 88 is NOT a Carbon star (C3 of Da Costa). No other stars brighter than show any convincing evidence of variability with amplitude greater than 0.1mag.
An estimate of the distance modulus of Phoenix can be made using absolute magnitudes in either or derived from period luminosity relations. In the case of we use the relation:
| (1) |
The slope of this relation was derived from carbon Miras in the LMC by Feast et al. (1989), and we have assumed an LMC distance modulus of (van Leeuwen et al. 2007). For we adopt
| (2) |
again from LMC carbon Miras but now including some heavily dust-enshrouded members (Whitelock et al. 2006) and the same distance modulus. It should be noted that a Galactic zero-point for this relation ( (Feast et al. 2006)) is close to the value used.
With these absolute magnitudes we derive distance moduli of from and from where the uncertainties take into account both the scatter about the PL relations and the uncertainty in the distance modulus of the LMC. Held et al. (1999) quote moduli of from the horizontal branch (HB) at and from the TRGB at . Martinez-Delgado (1999) also used the latter method to obtain a modulus of . Holtzman et al. (2000) obtained 23.1 from the TRGB and 23.3 from an assumed absolute magnitude of the HB. These estimates all agree well and we adopt 23.1 for the galaxy.
M2007 find a reddening of from
a study of the young population of Phoenix. Adopting such a reddening
would decrease the modulus derived from the Mira
by only about 0.04 mag.
But the
Held et al. (1999) values would be considerably affected; the moduli from the HB
and from the TRGB would both become 22.81. However,
the M2007 reddening is likely to apply only to the small young population
in Phoenix. Note that if the Phoenix Mira
were an HBB star (as discussed above) it would be expected to be brighter
than the PL relations used here suggest. So the agreement with other
distance moduli noted in the previous paragraph is an indication that
it is not an HBB star.
5 Conclusions
By combining our own observations with the optical photometry of Massey et al. (2007) it has been possible to make a rather clean separation of Phoenix members from field stars. A clear RGB of an old population is found together with a few highly evolved stars. A Mira variable, almost certainly a carbon star, with a period of 425 days is present in the galaxy and leads to an estimate of for the distance modulus in agreement with other estimates. The kinematics of carbon Miras in our Galaxy (Feast et al. 2006) suggest an age of Gyr for this star. Since Miras are relatively short-lived objects this implies a significant population of this age.
The two Da Costa carbon stars have or (based on an estimate of the bolometric correction from the work of Frogel et al.(1980)). These luminosities are consistent with an age to a few Gyr (see e.g. the luminosities of carbon stars in LMC clusters (Frogel et al. 1990)). Whilst most of the stars fainter than are found to be members of an old RGB population, a significant number of them are identified as probably AGB stars of intermediate age. They are likely to belong to the same population as the carbon stars. In this connection, we note that a feature in the colour-magnitude diagram of Holtzman et al. (2000) (their fig. 2), starting at or of , and sloping to higher luminosities and redder colours may be a subgiant branch of intermediate age stars. It is reasonably well fitted by a 1 Gyr isochrone (z = 0.002) from Girardi et al. (2002).
The status of the non-carbon star Da Costa C2 which is mag brighter than the two carbon stars at is uncertain. It seems most likely to be an AGB star of an old population. Whether other stars of about the same luminosity and colour to C2 are also old AGB stars or carbon stars of an intermediate age population requires further spectroscopic work.
Acknowledgments
We are grateful to the IRSF/SIRIUS team, based in Nagoya University, Kyoto University the National Astronomical Observatory of Japan, for their support during our observations. We also acknowledge our Japanese colleagues, T. Tanabé, Y. Ita, S. Nishiyama, R. Kadowaki, A. Ishihara, Y. Haba and J. Hashimoto, for obtaining for us some of the images of Phoenix that were used in this investigation. Dr P. Massey very kindly sent us the Phoenix observations obtained by himself and his colleagues in advance of publication.
References
- [] Aaronson M., Blanco V. M., Cook K. H., Schechter P. L., 1989, ApJS, 70, 637
- [] Bahcall J. N., Soneira R. M., 1980, ApJS, 44, 73
- [] Bellazzini M., 2007, arXiv:0711.2016
- [] Bessell M. S., 1990, PASP, 102, 1181
- [] Bessell M. S., Brett J. M., 1988, PASP, 100, 1134
- [] Burstein D., Heiles C., 1982, AJ, 87, 1165
- [] Canterna R., Flower, P. J., 1977, ApJ, 212, 57L
- [] Carpenter J. M., 2001, AJ, 121, 2851
- [] Da Costa G. S. 1994, in: ESO Conf. Workshop Proc. 49, Dwarf Galaxies: Proc. ESO/OHP Workshop, eds. G. Meylan & P. Prugniel (Garching: ESO), 221
- [] Feast M. W., Whitelock P. A., Menzies J.W., 2006, MNRAS, 369, 791
- [] Frogel J. A., Persson S. E., Cohen J. G., 1980, ApJ, 239, 495
- [] Frogel J. A., Mould J., Blanco V. M., 1990, ApJ, 352, 96
- [] Gallart C., Aparicio A., Freedman W. L., Madore B. F., Martínez-Delgado, D., Stetson P. B., 2004, AJ, 127, 1486
- [] Girardi L., Bressan A., Bertelli G., Chiosi C., 2000, A&ASup, 141, 371
- [] Girardi L., et al., 2002 http://stev.oapd.inaf.it/l̃girardi/cgi-bin/cmd
- [] Gizis J. E., 1997, AJ, 113, 806
- [] Grebel E., 1999, in: (eds.) Whitelock P. & Cannon R., The stellar Content of Local group Galaxies, IAU Sym. 192, ASP, p. 17
- [] Held E. V., Saviane I., Momany Y., 1999, A&A, 345, 747
- [] Holtzman J. A., Smith G. H., Grillmair C., 2000, AJ, 120, 3060
- [] Martinez-Delgado D., Gallart C., Aparicio A., 1999, AJ, 118, 862
- [] Massey P., Olsen K. A. G., Hodge P. W., Jacoby G. H., McNeill R. T., Smith R. C., Strong S. B., 2007, AJ, 133, 2393 (M2007)
- [] Mateo M., 1998, ARA&A, 36, 435
- [] Menzies J., Feast M., Tanabé T., Whitelock P.A., Nakada Y., 2002, MNRAS, 335, 923 (JWM2002)
- [] Nagashima C. et al., 1999, in Star Formation 1999, ed. T. Nakamoto (Nobeyama: Nobeyama Radio Observatory) 397
- [] Nagayama T. et al., 2003, Proc. SPIE 4841, 459
- [] Oosterloo T., Da Costa G. S., Staveley-Smith L., 1996, AJ, 112, 1969
- [] Persson S. E., Murphy D. C., Krzeminski W., Roth M., Rieke M. J., 1998, AJ, 116, 2457
- [] Pietrinferni A., Cassisi S., Salaris M., Castelli F., 2004, ApJ, 612, 168
- [] Salaris M., Girardi L., 2005, MNRAS, 357, 669
- [] Schuster H. E., West R. M., 1976, A&A, 49, 129
- [] St-Germain J., Carignan C., Côte S., Oosterloo T., 1999, AJ, 118, 1235
- [] van de Rydt F., Demers S., Kunkel W. E., 1991, AJ, 102, 130
- [] Whitelock P. A., Feast M. W., Marang F., Groenewegen M. A. T., 2006, MNRAS, 369, 751
- [] Young L. M., Lo, K. Y., 1997, ApJ, 490, 710
- [] Young L. M., Skillman E. D., Weisz D. R., Dolphin A. E., 2007, ApJ, 659, 331
- []
Appendix
| No. | |||||||||||
|---|---|---|---|---|---|---|---|---|---|---|---|
| 52 (C2) | 16.59 | 0.85 | 0.09 | 0.94 | 20.335 | 1.720 | 0.929 | 0.796 | 1.725 | 3.75 | 18.610 |
| 56 | 16.54 | 0.86 | 0.13 | 0.99 | 20.423 | 1.532 | 0.940 | 0.844 | 1.784 | 3.88 | 18.639 |
| 55 | 16.49 | 0.75 | 0.07 | 0.82 | 19.512 | 1.422 | 0.706 | 0.626 | 1.332 | 3.02 | 18.180 |
| 60 | 16.73 | 0.82 | 0.14 | 0.96 | 29.266 | 1.510 | 0.843 | 0.730 | 1.573 | 3.54 | 18.693 |
| 41 | 16.59 | 0.82 | 0.17 | 1.00 | 20.514 | 1.797 | 0.978 | 0.857 | 1.835 | 3.92 | 18.679 |
| 61 | 16.76 | 0.65 | 0.06 | 0.71 | 19.507 | 1.177 | 0.645 | 0.572 | 1.217 | 2.75 | 18.290 |
| 57 | 16.56 | 0.87 | 0.16 | 1.04 | 20.649 | 1.892 | 1.003 | 0.868 | 1.871 | 4.09 | 18.778 |
| Carbon stars | |||||||||||
| 87 | 16.90 | 0.81 | 0.15 | 0.96 | 20.636 | 1.718 | 0.907 | 0.725 | 1.632 | 3.74 | 19.004 |
| 102 | 16.85 | 0.66 | 0.14 | 0.81 | 20.010 | 1.707 | 0.808 | 0.655 | 1.463 | 3.16 | 18.547 |
| Sp | ||||||||
|---|---|---|---|---|---|---|---|---|
| Dwarfs | Giants | |||||||
| K0 | 2.35 | 0.48 | 0.12 | 0.60 | ||||
| K1 | 2.54 | 0.52 | 0.13 | 0.65 | ||||
| K2 | 2.74 | 0.57 | 0.14 | 0.71 | ||||
| K3 | 3.04 | 0.62 | 0.17 | 0.79 | ||||
| K4 | 2.67 | 0.52 | 0.13 | 0.65 | 3.30 | 0.67 | 0.18 | 0.85 |
| K5 | 2.89 | 0.55 | 0.14 | 0.69 | 3.64 | 0.73 | 0.19 | 0.92 |
| K7 | 3.20 | 0.60 | 0.16 | 0.76 | ||||
| M0 | 3.69 | 0.64 | 0.19 | 0.83 | 3.89 | 0.77 | 0.22 | 0.99 |
| M1 | 3.91 | 0.62 | 0.23 | 0.85 | 4.09 | 0.79 | 0.23 | 1.02 |
| M2 | 4.15 | 0.61 | 0.24 | 0.85 | 4.34 | 0.81 | 0.24 | 1.05 |
| M3 | 4.60 | 0.56 | 0.28 | 0.84 | 4.68 | 0.84 | 0.26 | 1.10 |
| M4 | 5.30 | 0.54 | 0.30 | 0.84 | 5.14 | 0.87 | 0.27 | 1.14 |
| M5 | 6.16 | 0.56 | 0.35 | 0.91 | 6.00 | 0.89 | 0.31 | 1.20 |
| M6 | 7.34 | 0.60 | 0.40 | 1.00 | 6.88 | 0.90 | 0.33 | 1.23 |
| M7 | 7.84 | 0.90 | 0.34 | 1.24 | ||||
| LHS | ||||||||||
|---|---|---|---|---|---|---|---|---|---|---|
| 104 | 10.412 | 0.525 | 0.154 | 0.679 | 13.78 | 3.37 | 1.34 | 0.81 | 0.91 | 1.72 |
| 161 | 10.995 | 0.516 | 0.203 | 0.719 | 14.75 | 3.75 | 1.55 | 1.01 | 0.96 | 1.98 |
| 169 | 10.819 | 0.474 | 0.193 | 0.667 | 14.13 | 3.31 | 1.45 | 0.91 | 0.76 | 1.72 |
| 182 | 10.519 | 0.428 | 0.150 | 0.578 | 13.42 | 2.90 | 1.57 | |||
| 185 | 11.517 | 0.618 | 0.221 | 0.839 | 15.30 | 3.78 | 1.79 | 0.98 | 0.85 | 1.83 |
| 364 | 10.860 | 0.451 | 0.155 | 0.606 | 14.61 | 3.75 | 1.71 | 1.03 | 0.92 | 1.95 |
| 375 | 11.507 | 0.476 | 0.167 | 0.643 | 15.68 | 4.17 | 1.87 | 1.08 | 1.12 | 2.20 |
| 489 | 11.852 | 0.474 | 0.205 | 0.679 | 15.48 | 3.63 | 1.69 | 0.91 | 0.86 | 1.77 |
| 522 | 10.927 | 0.480 | 0.177 | 0.657 | 14.15 | 3.22 | 1.41 | 0.84 | 0.78 | 1.62 |
| 1970 | 13.875 | 0.581 | 0.124 | 0.705 | 17.76 | 3.88 | 1.68 | 2.09 | ||
| 3382 | 13.197 | 0.520 | 0.147 | 0.667 | 17.02 | 3.82 | 1.99 | 1.03 | 1.06 | 2.09 |