Entropy-driven phase transition in a system of long rods on a square lattice
Abstract
The isotropic-nematic (I-N) phase transition in a system of long straight rigid rods of length on square lattices is studied by combining Monte Carlo simulations and theoretical analysis. The process is analyzed by comparing the configurational entropy of the system with the corresponding to a fully aligned system, whose calculation reduces to the 1D case. The results obtained allow to estimate the minimum value of which leads to the formation of a nematic phase and provide an interesting interpretation of this critical value; provide numerical evidence on the existence of a second phase transition (from a nematic to a non-nematic state) occurring at density close to and allow to test the predictions of the main theoretical models developed to treat the polymers adsorption problem.
pacs:
05.50.+q, 64.70.Md, 75.40.Mg1 Introduction
The study of systems of hard non-spherical colloidal particles has been an attractive and important topic in statistical physics for a long time. In the years 1941-1961, several papers contributed greatly to our understanding of this field [1, 2, 3, 4, 5, 6, 7, 8]. Among them, Onsager [5] predicted that very long and thin rods interacting with only excluded volume interaction can lead to long-range orientational (nematic) order. This nematic phase, characterized by a big domain of parallel molecules, is separated from an isotropic state by a phase transition occurring at a finite critical density. Flory [1] studied a lattice model of long rod-like molecules, and based on a mean-field approximation, argued that the lattice model would also show an isotropic-nematic (I-N) phase transition as a function of density. Later, DiMarzio [8] gave an answer to the question of how many ways we can pack together linear polymers in sites, given a definite distribution of shapes for the molecules and a definite distribution (continuous or discrete) of orientations of each shape. The detailed knowledge of the orientations of the molecules allowed to identify the various types (nematic, smetic, and cholestic) of liquid crystals. Refs. [1, 2, 4, 8] will be discussed in more detail in Section 4.
The phase properties of systems with purely steric interactions are important from a statistical mechanical perspective because the potential energy, , of a steric system is, by definition, constant. Consequently, the Helmholtz free energy is controlled by entropy () alone and all phase transitions are entropy driven. The problem proposed by Onsager is a clear example of an entropy-driven phase transition. Other examples, corresponding to phase transitions in hard sphere systems, can be found in Refs. [9, 10].
Despite of the physical relevance of such issues, rigorous results are still very limited. An interesting overview of this topic can be found in the work by Ioffe et al. [11] and references therein. In this paper, the authors studied a system of rods on with hard-core exclusion, each rod having a length between and . The existence of a I-N phase transition was rigorously proved for sufficiently large and suitable fugacity.
On the other hand, numerous experimental and numerical studies have been recently devoted to the analysis of phase transitions in systems of non-spherical particles [12, 13, 14, 15, 16, 17]. Of special interest are those studies dealing with lattice versions of this problem, where the situation is much less clear. In this sense, a system of straight rigid rods of length on a square lattice, with two allowed orientations, was studied in the excellent paper by Ghosh and Dhar [16]. The authors found strong numerical evidence that the system shows nematic order at intermediate densities for and provided a qualitative description of a second phase transition (from a nematic order to a non-nematic state) occurring at a density close to (figure 1 in Ref. [16] shows a schematic representation of the different phases corresponding to a system of long rigid rods on a square lattice). As it was recently confirmed [17], the low-density I-N phase transition of rigid rods on square lattices, with two allowed orientations, belongs to the 2D Ising universality class.
Similar results have been obtained in previous work [11, 18, 19, 20], which indicate the universal behavior of these models. In the case of the system discussed in Ref. [11] (see third paragraph), the authors studied the problem of infinite (which can be mapped onto a 2D Ising model), and showed that the case of finite (but large) can be seen as a perturbation of the latter. It is then reasonable to expect that the finite case belongs to the same universality class as the . An Ising-like phase transition was also found in a lattice system of semiflexible living polymers [18, 19, 20].
Even though the universality class of a system of straight rigid rods of length on a square lattice (with two allowed orientations) has been resolved [17], other aspects of the problem remain still poorly understood. Among them, the minimum value of (), which allows the formation of a nematic phase, has been estimated from the behavior of a geometric order parameter, without any theoretical justification and the second phase transition predicted by Ghosh and Dhar [16] has not been rigorously proved yet. In this context, the objectives of the present work are to shed light on the underlying physics of the observed dependence of the I-N phase transition, and to contribute to the discussion on the existence or non-existence of a second phase transition in the system. For this purpose, the configurational entropy of a system of rigid rods deposited on a square lattice is calculated by Monte Carlo (MC) simulations and thermodynamic integration method [21]. The numerical data are compared with the corresponding ones obtained from a fully aligned system (nematic phase), whose calculation reduces to the one-dimensional case [22]. The study allows to calculate , corroborating the previous result in Ref. [16], and provides an interesting interpretation of this value of . The results obtained provide also numerical evidence on the existence of a second phase transition occurring at high density.
Finally, the transition is studied from the main theoretical models developed to treat the polymers adsorption problem [23, 1, 2, 4, 8, 24, 25]. Three theories have been compared with the Monte Carlo data: the first is the well-known Flory-Huggins (FH) approximation [23, 1, 2]; the second is the Guggenheim-DiMarzio (GD) approach for rigid rod molecules [4, 8]; and the third is the recently developed Semiempirical Model for Adsorption of Polyatomics (SE), which is a combination of exact 1D calculations and GD approximation [24, 25]. The comparison indicates that the SE model leads to an approximation significantly better than the other existing approaches.
2 Model and Monte Carlo method
We address the general case of adsorbates assumed to be linear rigid particles containing identical units (-mers), with each one occupying a lattice site. Small adsorbates with spherical symmetry would correspond to the monomer limit (). The distance between -mer units is assumed to be equal to the lattice constant; hence exactly sites are occupied by a -mer when adsorbed. The only interaction between different rods is hard-core exclusion: no site can be occupied by more than one -mer. The surface is represented as an array of adsorptive sites in a square lattice arrangement, where denotes the linear size of the array.
Configurational entropy was calculated by using MC simulations and thermodynamic integration method [21, 26, 27, 28, 29, 30]. The method in the grand canonical ensemble relies upon integration of the chemical potential on coverage along a reversible path between an arbitrary reference state and the desired state of the system. This calculation also requires the knowledge of the total energy for each obtained coverage. Thus, for a system made of particles on lattice sites, we have:
| (1) |
In our case and the determination of the entropy in the reference state, , is trivial [ for ]. Note that the reference state, , is obtained for . Then,
| (2) |
where is the configurational entropy per site, is the surface coverage (or density) and is the Boltzmann constant.
In order to obtain the curve of vs , a typical adsorption-desorption algorithm in grand canonical ensemble has been used [24, 31, 32, 33, 34]. The MC procedure is as follows. Once the value of is set, a linear -uple of nearest-neighbor sites is chosen at random. Then, if the sites are empty, an attempt is made to deposit a rod with probability ; if the sites are occupied by units belonging to the same -mer, an attempt is made to desorb this -mer with probability ; and otherwise, the attempt is rejected. In addition, displacement (diffusional relaxation) of adparticles to nearest-neighbor positions, by either jumps along the -mer axis or reptation by rotation around the -mer end, must be allowed in order to reach equilibrium in a reasonable time. A MC step (MCs) is achieved when -uples of sites have been tested to change its occupancy state. Typically, the equilibrium state can be well reproduced after discarding the first MCs. Then, the next MCs are used to compute averages.
In our MC simulations, we varied the chemical potential and monitored the density , which can be calculated as a simple average over the MC simulation runs. All calculations were carried out using the parallel cluster BACO of Universidad Nacional de San Luis, Argentina. This facility consists of 60 PCs each with 3.0 GHz Pentium-4 processors.
3 Numerical results
Computational simulations have been developed for a system of straight rigid rods of length () on a lattice. The surface was represented as an array of adsorptive sites in a square arrangement with , and periodic boundary conditions. As we will show in figure 1, finite-size effects are small for the coverage dependence of the chemical potential with this lattice size.
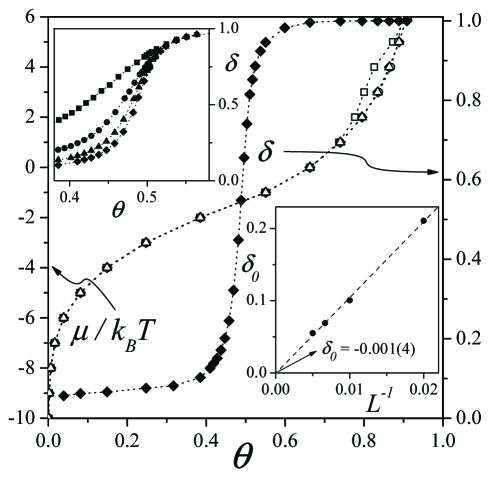
The calculation of through eq. (2) is straightforward and computationally simple, since the coverage dependence of is evaluated following the standard procedure of MC simulation described in previous section. Then, is spline-fitted and numerically integrated. Typical curves of vs , obtained for and different values of (, open squares; , open circles; , open triangles; and , open diamonds), are depicted in figure 1. In all cases, a smooth coverage dependence is observed as result of the large number of averaged configurations. The data collapse in a single curve for small and intermediate values of the coverage (); however, the disagreement turns out to be significantly large for larger ’s. This difference diminishes when is increased, being negligible for .
Figure 1 also shows the nematic order parameter [35] as a function of the coverage (full diamonds). In this case, the data correspond to and . When the system is disordered (, being the critical coverage characterizing the I-N phase transition at intermediate densities), all orientations are equivalents and tends to zero. As the density is increased above , the -mers align along one direction and is different from zero. The behavior of is a clear evidence of the existence of a I-N phase transition in the system [16, 17]. As a difference with respect to the behavior of vs , important finite-size effects are observed in (see inset in the upper-left corner of the figure, where is plotted for different values of : , squares; , circles; , triangles; and , diamonds). This is the reason for which the order parameter does not vanish at low coverage. In order to clarify this point, a simple finite-size scaling analysis is presented in the lower-right inset of the figure. In this study, the limit value of the order parameter in the isotropic phase, , is plotted as a function of . This limit value was obtained for . As it can be observed, as .
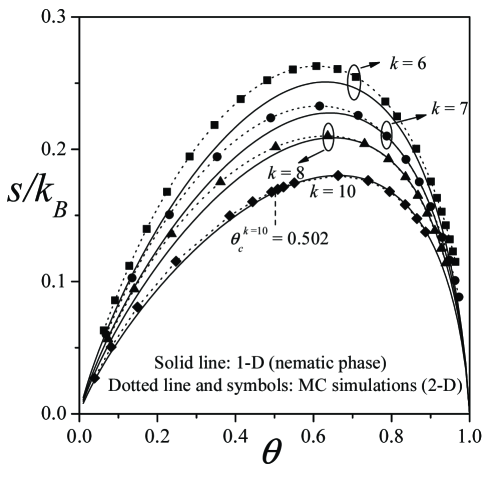
Results of thermodynamic integration are shown in figure 2 for straight rigid rods of different sizes (, squares; , circles; , triangles and , diamonds) on square lattices. Other sizes are not shown for clarity. The general features of the coverage dependence of the entropy per site are the following: in the limit the entropy tends to zero. For very low densities, is an increasing function of , reaches a maximum at , then decreases monotonically to a finite value for . The position of shifts to higher coverage as gets larger. The overall effect of the adsorbate size is to decrease the entropy for all coverage.
For , being the critical coverage characterizing the second phase transition (from a nematic order to a non-nematic state) occurring at a density close to , the system is characterized by a big domain of parallel -mers. The calculation of the entropy of this fully aligned state having density reduces to the calculation of a one-dimensional problem [22]
| (3) |
Results from eq. (3) for different adsorbate sizes are shown in figure 2 (solid lines). Interesting conclusions can be drawn from the figure. Namely, for , the 1D results present a smaller than the 2D simulation data over all the range of . For , there exists a range of coverage for which the difference between the 1D value and the true 2D value is very small. In other words, for and intermediate densities, it is more favorable for the rods to align spontaneously, since the resulting loss of orientational entropy is by far compensated by the gain of translational entropy. These results corroborate the previous results in Ref. [16], and provides a physical interpretation of this critical value of . In addition, the technique supply an alternative method of determining the critical coverage characterizing the I-N phase transition. In fact, can be calculated from the minimum value of for which occurs the near superposition of the 1D and 2D results. As an example, the curves for lead to in good agreement with the recently reported value of [17]. Thus, the simulation scheme presented here appears as a simple method to approximate without any special requirement and time consuming computation. However, it is important to emphasize that the calculation of the entropy of the nematic phase from the 1D model is an approximation (especially at the moderate densities, where the phase is not completely aligned). Consequently, a precise determination of should require an extensive work of MC simulation and finite-size scaling techniques [17].
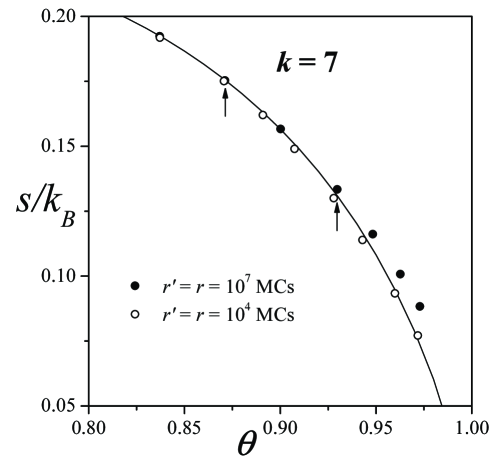
On the other hand, the results in figure 2 provide valuable information about the second phase transition predicted in Ref. [16]. In fact, figure 3 shows the behavior of one of the curves in figure 2 (that corresponding to ) at density close to . As it can be observed, the configurational entropy of the 2D system (solid circles) differs from the corresponding one to the nematic phase (solid line). The exact density where the two curves separate should be indicative of . Even though the determination of this point is out of the scope of the present paper, it is clear that in this case varies between and (as indicated with arrows).
As it was mentioned in Ref. [16], the relaxation time increases very fast as the density increases. Consequently, MC simulations at high density are very time consuming and may produce artifacts related to non-accurate equilibrium states. In order to discard this possibility, we study the effect of the number of MCs used in the calculations on the behavior of at high density. For this purpose, the curve obtained for equilibration times of the order (solid circles), with an effort reaching almost the limits of our computational capabilities, is compared with the corresponding one obtained for MCs (open circles). The tendency is very clear: the better the statistics, the larger the separation between line and symbols. Other intermediate cases, not shown for sake of clarity, reinforce the last argument. Then, the difference between the 1D and 2D results can not be associated to numerical limitations [36] and is a clear evidence of the existence of a second phase transition at high coverage.
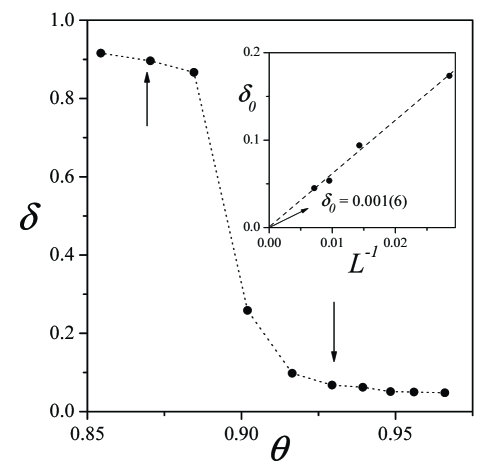
Finally, the measurement of the nematic order parameter as a function of the coverage was used as an independent method to characterize the phase transition occurring in the system (see figure 4). The calculations were developed for , and MCs. The behavior of is also indicative of the existence of a transition from a nematic to a non-nematic state. As in figure 1, a simple finite-size scaling analysis of the limit value of the order parameter in the non-nematic phase shows that as (see inset). In this case, the limit value was obtained for . The robustness and consistency of the analysis presented in figures 3 and 4 allow us to confirm the existence of a second phase transition (from a nematic order to a non-nematic state) occurring in a system of rigid rods on square lattices at high density. In addition, this analysis provides the first numerical evidence existing in the literature about this important point.
4 Analytical approximations and comparison between simulated and theoretical results
Next, the transition is studied from the main theoretical models developed to treat the polymers adsorption problem [1, 2, 4, 8, 23, 24, 25]. The study allows us to investigate the predictions, reaches and limitations of those theories when are used to describe the I-N phase transition occurring in a system of long rods on a lattice.
Three theories have been considered: the first is the well-known Flory-Huggins (FH) approximation [1, 2]; the second is the Guggenheim-DiMarzio (GD) approach for rigid rod molecules [4, 8]; and the third is the recently developed Semiempirical Model for Adsorption of Polyatomics (SE) [24, 25].
As it was mentioned in Section 1, Onsager [5], Zimm [6] and Isihara [7] made important contributions to the understanding of the statistics of rigid rods in dilute solution. These treatments are limited in their application because they are valid for dilute solution only and because they are not applicable to systems of non-simple shapes. The FH theory, due independently to Flory [1] and to Huggins [2], has overcome the restriction to dilute solution by means of a lattice calculation. The approach is a direct generalization of the theory of binary liquids in two dimensions or polymer molecules diluted in a monomeric solvent. It is worth mentioning that, in the framework of the lattice-gas approach, the adsorption of -mers on homogeneous surfaces is an isomorphous problem to the binary solutions of polymer-monomeric solvent.
A great deal of work has been done on checking the predictions of the FH theory against experimental results, being the theory completely satisfactory in a qualitative, or semi-quantitative way. There is no doubt that this simple theory contains the essential features which distinguish high polymer solutions from ordinary solutions os small molecules. In the framework of the FH approach, the configurational entropy per site can be written as [25]:
| (4) |
The FH statistics, given for the packing of molecules of arbitrary shape but isotropic distribution, provides a natural foundation onto which the effect of the orientation of the ad-molecules can be added. Following this line of thought, DiMarzio [8] developed an approximate method of counting the number of ways, , to pack together linear polymer molecules of arbitrary shape and of arbitrary orientations. Accordingly, was evaluated as a function of the number of molecules in each permitted direction. These permitted directions can be continuous so that is derived as a function of the continuous function which gives the density of rods lying in the solid angle , or the permitted directions can be discrete so that is the the number of ways to pack molecules onto a lattice. Based on the detailed knowledge of the orientations of the molecules, the various types (nematic, smetic, and cholestic) of liquid crystals were argued for and the reasons for their existence were ascertained. In the case of allowing only those orientations for which the molecules fit exactly onto the lattice is that for the case of an isotropic distribution the value of reduces to the value obtained previously by Guggenheim [4]. In this limit, which we call Guggenheim-DiMarzio approximation, the corresponding expression for configurational entropy per site is:
| (5) | |||||
More recently, a new theory to describe adsorption of rigid rods has been introduced. The model, hereafter denoted EA, is based on exact forms of the thermodynamic functions of linear adsorbates in one dimension and its generalization to higher dimensions [25]. Detailed comparisons between theoretical and simulation results of adsorption [24] shown that GD approach fits very well the numerical data at low coverage, while EA model behaves excellently at high coverage. Based on these findings, the Semiempirical Model for Adsorption of Polyatomics was developed [24, 25]. SE model is a combination of exact calculations in 1D and GD approximation with adequate weights. In this approach, the configurational entropy per site is given by:
| (6) | |||||
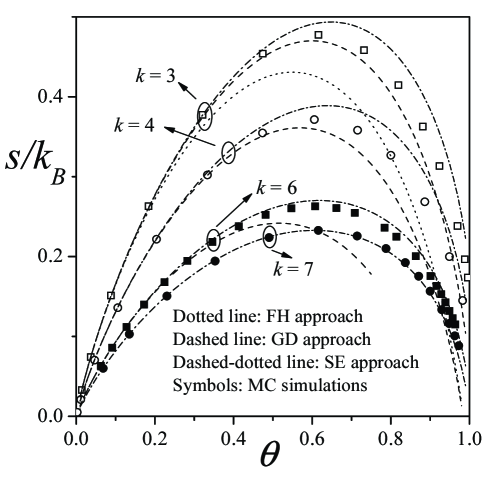
The comparison between simulation data and theoretical predictions for -mers, -mers, -mers and -mers adsorbed on square lattices is shown in figure 5. The behavior of the analytical approaches can be explained as follows. In all cases, the agreement between simulation and theoretical data is very good for small values of coverage. However, as the surface coverage is increased, FH (dotted line) and GD (dashed line) predict a smaller than the simulation data over the entire range of coverage. With respect to the -mer size, FH and GD become less accurate as increases, being the disagreement significantly large for in the case of FH and in the case of GD. The behavior of SE (dashed-dotted line) is more complex. For , the approach overestimate the value of the entropy in the whole range of ; for the agreement between simulation and theoretical data is excellent; and finally, for (data do not shown here for simplicity) the tendency is inverted and the theoretical data present a smaller than the simulation results. In summary, appreciable differences can be seen for the different approximations studied in this contribution, with SE being the most accurate for all sizes considered here.
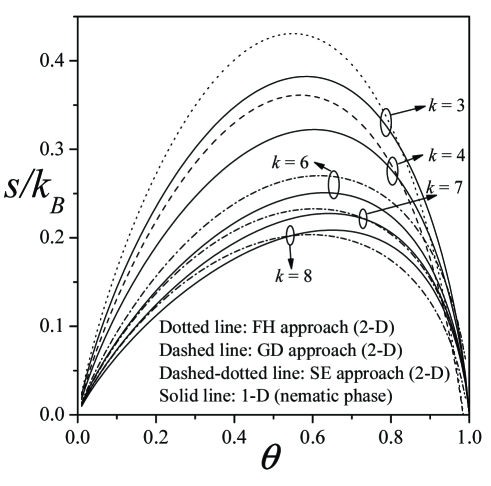
Once the theoretical approaches have been tested against numerical experiments, comparisons between results from eqs. (4-6) and the corresponding ones from eq. (3) are shown in figure 6. In general, the behavior of the 2D curves is the following. For low values of , the 2D system has higher entropy over all the range of coverage. From a given value of (which depends on the approximation considered), the 2D and 1D curves cross at intermediate densities and two well differentiated regimes can be observed. In the first regime, which occurs at low densities, the 2D approaches predict a larger entropy than the 1D data. In the second regime (at high densities) the behavior is inverted and the 2D data present a smaller than the 1D results. Given that the theoretical results in 2D assume isotropy in the adlayer (interested readers are referred to Ref. [8], where this point is explicitly considered), the crossing of the curves shows that, in the second regime, the contribution to the 2D entropy from the isotropic configurations is lower than the contribution from the aligned states. Then, the existence of an intersection point is indicative of a I-N transition and allows us to estimate and from the different approximations studied.
As it can be observed, FH and GD approaches predict values of and , respectively. On the other hand, SE approximation performs significantly better than the other approaches, predicting the “exact” value of [16]. With respect to , although a systematic analysis of the dependence of with was not carried out since this was out of the scope of the present work, it is interesting to note that, as it is expected [16], the three approximations predict that the critical density decreases for increasing .
In summary, we have addressed the critical properties of a system of long straight rigid rods of length on square lattices. The results were obtained by combining Monte Carlo simulations, thermodynamic integration and theoretical analysis.
Two main conclusions can be drawn from the present work. On one hand, the comparison between the configurational entropy of the system and the corresponding to a fully aligned system confirms previous results in the literature [16], namely, the presence of a I-N phase transition at intermediate densities for .
On the other hand, the Monte Carlo study presented here represents the first simulation evidence about the existence of a second phase transition from a nematic order to a non-nematic state occurring at high density. The determination of the order of this second phase transition is still an open problem. An exhaustive study on this subject, based on Monte Carlo simulations and finite-size scaling theory, will be the object of future work.
References
References
- [1] Flory P J, 1941 J. Chem. Phys. 9 660; 1942 J. Chem. Phys. 10 51; Principles of Polymers Chemistry, Cornell University Press, Ithaca, NY 1953; 1956 Proc. R. Soc. London A234 73
- [2] Huggins M L, 1941 J. Phys. Chem. 9 440; 1942 J. Phys. Chem. 46 151; 1942 Ann. N.Y. Acad. Sci. 41 151; 1942 J. Am. Chem. Soc. 64 1712
- [3] Miller A R, 1942 Proc. Camb. Phil. Soc. 39 54
- [4] Guggenheim E A, 1944 Proc. R. Soc. London A183 203
- [5] Onsager L, 1949 Ann. N. Y. Acad. Sci. 51 627
- [6] Zimm B H, 1946 J. Chem. Phys. 14 164
- [7] Isihara A, 1950 J. Chem. Phys. 18 1446; 1951 J. Chem. Phys. 19 1142
- [8] DiMarzio E A, 1961 J. Chem. Phys. 35 658
- [9] Bridgman P W, 1914 Phys. Rev. 3 126; 1914 Phys. Rev. 3 153
- [10] Rice O K, 1947 J. Chem. Phys. 15 875
- [11] Ioffe D, Velenik Y and Zahradnýk M, 2006 J. Stat. Phys. 122 761
- [12] Viamontes J, Oakes P W and Tang J X, 2006 Phys. Rev. Lett. 97 118103
- [13] C. De Michele C, Schilling R and Sciortino F, 2007 Phys. Rev. Lett. 98 265702
- [14] Vink R L C, 2007 Phys. Rev. Lett. 98 217801
- [15] Cuetos A and Dijkstra M, 2007 Phys. Rev. Lett. 98 095701
- [16] Ghosh A and Dhar D, 2007 Eur. Phys. Lett. 78 20003
- [17] Matoz-Fernandez D A, Linares D H and Ramirez-Pastor A J, 2007 Preprint cond-mat/07080395
- [18] Menon G I, Pandit R and Barma M, 1993 Eur. Phys. Lett. 24 253
- [19] Menon G I and Pandit R, 1995 Phys. Rev. Lett. 75 4638
- [20] Menon G I and Pandit R, 1999 Phys. Rev. E 59 787
- [21] Binder K, 1985 J. Comput. Phys. 59 1
- [22] Ramirez-Pastor A J, Eggarter T P, Pereyra V D and Riccardo J L, 1999 Phys. Rev. B 59 11027
- [23] Romá F, Ramirez-Pastor A J and Riccardo J L, 2003 Langmuir 19 6770
- [24] Romá F, Riccardo J L and Ramirez-Pastor A J, 2006 Langmuir 22 3192
- [25] Riccardo J L, Romá F and Ramirez-Pastor A J, 2006 Int. J. Mod. Phys. B 20 4709
- [26] Hansen J P and Verlet L, 1969 Phys. Rev. 184 151
- [27] Binder K, 1981 J. Stat. Phys. 24 69
- [28] Binder K, 1981 K. Z. Phys. B 45 61
- [29] Polgreen T L, 1984 Phys. Rev. B 29 1468
- [30] Romá F, Ramirez-Pastor A J and Riccardo J L, 2000 Langmuir 16 9406
- [31] González J E, Ramirez-Pastor A J and Pereyra V D, 2001 Langmuir 17 6974
- [32] Romá F, Riccardo J L and Ramirez-Pastor A J, 2005 Langmuir 21 2454
- [33] Dávila M, Romá F, Riccardo J L and Ramirez-Pastor A J, 2006 Surf. Sci. 600 2011
- [34] Pasinetti P M, Riccardo J L and Ramirez-Pastor A J, 2005 Physica A 355 383
- [35] is defined as in Refs. [16, 17]: , () being the number of -mers aligned along the horizontal (vertical) direction
- [36] That the 1D and 2D results differ for large densities has been shown rigorously. Thus, while the 2D entropy has a non-zero lower bound as the surface coverage tends to , the 1D entropy tends to zero (see, for instance, Refs. [25] and [37]).
- [37] Wu F Y, 2006 Int. J. Mod. Phys. B 20 5357