Recent RXTE/ASM and ROTSEIIId observations of
EXO 2030+375 (V2246 Cyg )
Abstract
Aims. Using the archival RXTE/ASM and SWIFT/BAT observations, the new orbital phases of Type I outbursts of EXO 2030+375 are estimated. A possible correlation between the Type II outburst and optical brightness variations is investigated.
Methods. In order to estimate the phases of Type I outbursts, we fitted Gaussian profiles to the RXTE/ASM and SWIFT/BAT light curves. The time corresponding to the maximum value of the profiles is treated as the arrival time of Type I outburst. We used differential magnitudes in the time-series analysis of the optical light curve. MIDAS and its suitable packages were used to reduce and analyze the spectra.
Results. Prior to the Type II outburst, orbital phases of Type I outbursts were delayed for 6 days after the periastron passage, which is consistent with findings of Wilson et al. (2002, 2005). After the giant Type II outburst, the phase of Type I outbursts underwent a sudden shift of 13 days after the periastron passage. The amplitudes of Type I outbursts were increased between MJD 52500 and 53500. These amplitudes then decreased for 10 orbital cycles until the Type II outburst was triggered. If the change of outburst amplitudes correlated with the mass accretion, then during the decrease of these amplitudes mass should be deposited in a disk around neutron star temporarily. The release of this stored mass may ignite the Type II outburst. We report that the optical light curve became fainter by 0.4 mag during the decrease of amplitude of the Type I outbursts. The observed H profiles and their equivalent widths during the decay and after the giant outburst are consistent with previous observations of the system.
Key Words.:
stars:emission-line, Be – stars:early-type – stars:variables:Be – stars:oscillations – X-rays:binaries1 Introduction
Most of the accretion powered X-ray pulsars have Be type companions. Be/X-ray transient binaries exhibit three types of typical behavior: i) Type II (or giant) outbursts which are characterized by high X-ray luminosities ( erg s-1); ii) Type I (or normal) outbursts which are characterized by lower X-ray luminosities ( erg s-1) and are generally repeated in each orbital period cycle; iii) outburst free (quiescence), where the accretion is partially or completely halted (Stella et al. 1986; Motch et al. 1991; Bildsten et al. 1997).
The size of the isolated Be star’s disk could be resolved from the variable trend of infrared observations. This cannot be measured when the Be star is in a binary system since the Be disk is truncated at a resonance radius by tidal forces at the orbit of the neutron star (Okazaki Negueruela 2001). In these systems, variations in the mass loss from the Be star cause the change in the disk density. Therefore radiation becomes optically thick at infrared wavelengths (Negueruela et al. 2001; Miroshnichenko et al. 2001). In this case, infrared magnitudes and the H equivalent width are related to the disk density (Negueruela et al. 2001; Miroshnichenko et al. 2001; Wilson et al. 2002). In most cases, X-ray outbursts and optical activity in a single outburst do not show clear correlation. However there are a few exceptions such as those seen in the outburst of the V635 Cas and X-ray companion 4U 0115+635 (Baykal et al. 2005).
EXO 2030+375 is a 42 s transient accreting X-ray pulsar which was discovered during a giant outburst in 1985 (Parmar et al. 1989) with a binary orbital period of 46.02 days. It has a B0 Ve spectral type optical companion (Motch Janot-Pacheco 1987, Janot-Pacheco et al. 1988; Coe et al. 1988). The continuous observations of EXO 2030+375 were performed by Burst and Transient Source Experiment (BATSE) on the Compton Gamma Ray Observatory from April 1991 until June 2000 (Wilson et al. 2002). The extensive monitoring campaign is continued by Rossi Timing Explorer (RXTE) (Wilson et al. 2005). These observations have shown that EXO 2030+375 has undergone an outburst close to the periastron passage for 13.5 years. In 1995, Wilson et al. (2002, 2005) observed a sudden shift in the orbital phase of EXO 2030+375’s outburst from about 6 days after periastron to about 4 days before periastron. The outburst phase slowly recovered to peak about 2.5 days after periastron. They interpreted these phase shifts in orbital phase as evidence of a global one-armed oscillation propagating in the Be disk. The variations in the shape of the H profile support the reconfiguration of the Be disk.
RXTE All-Sky Monitor observations of the Be/neutron star binary EXO 2030+375 showed an increase in flux in mid-June 2006 which indicated that a new outburst began (Corbet Levine 2006, Wilson Finger 2006, Klochkov et al. 2007). This new outburst stayed for 140 days. The same outburst was also observed by SWIFT/BAT. EXO 2030+375 was monitored by Robotic Optical Transient Experiment 111http://www.rotse.net (ROTSE IIId) and Russian Turkish 1.5 m Telescope 222http://www.tug.tubitak.gov.tr (RTT150) located at Bakırlıtepe, Antalya, Turkey. In this work we present the optical and X-ray (RXTE/ASM and SWIFT/BAT) observations of this source.
2 Observation and data reduction
2.1 Optical photometric observations
The CCD observations of ROTSEIIId were performed from June 2004 to September 2007 with a 45 cm reflecting telescope. ROTSEIII telescopes operate without filters. They are equipped with a CCD, 2048 2048 pixel which have the pixel scale 3.3′′ pixel-1 for a total field of view 1.85∘1.85∘(Akerlof et al., 2003). During the course of the observations, 1200 CCD frames were collected. By considering the other scheduled observations and atmospheric conditions, 1-20 frames with an exposure time of 60 s were taken each night. All images were automatically dark and flat-field corrected as soon as they were exposed. For each corrected image, aperture photometry was applied using a 5 pixel (17 arc sec) diameter aperture to obtain the instrumental magnitudes. These magnitudes were calibrated by comparing all the field stars against the USNO A2.0 R-band catalog. We adopted three stars as references, whose properties are given in Table 1. We used their average light curve to reduce long-term systematic errors. We did not choose stars which had magnitudes closer to that of the target as reference stars, since the magnitude determining accuracy decreases for fainter stars in ROTSEIIId measurements (Fig. 5 of Kızıloğlu et al. 2005a). In this way additional noise into the light curve of the target was avoided. We also checked the variability of the reference stars. Barycentric correction was made to the time of each observation by using JPL DE200 ephemerides. Details of the data reduction are described in Kızıloğlu, Kızıloğlu Baykal (2005a,b).
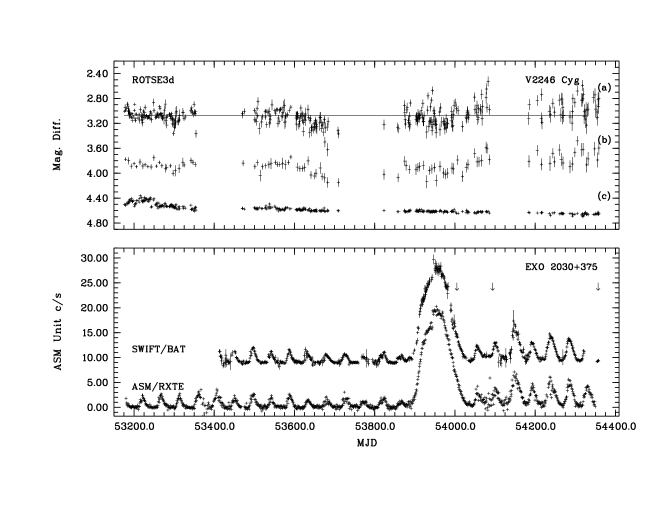
Figure 1 shows the light curve of daily and weekly averages of optical counterpart to EXO 2030+375 (V2246 Cyg).
| Star | R.A. | Decl. | USNO B1 |
|---|---|---|---|
| (J2000.0) | (J2000.0) | R mag | |
| V2246 Cyg | 20h32m1522 | +37∘38′151 | 17.6 |
| Star 1 | 20h32m3649 | +37∘36′194 | 13.8 |
| Star 2 | 20h32m0832 | +37∘40′262 | 13.7 |
| Star 3 | 20h31m5963 | +37∘37′178 | 13.8 |
| Date | MJD | Grism 333Nominal dispersion for G15 is 3 Å pixel-1. Hence 3 pixel resolution at H line is 9 Å. | Exp. | FWHM | EW |
|---|---|---|---|---|---|
| (sec) | (Å) | (Å) | |||
| 2006 Sep 26 | 54004 | G15 | 3600 | 22.57.6 | 8.71.1 |
| 2006 Dec 24 | 54093 | G15 | 3600 | 18.95.5 | 8.91.2 |
| 2007 Sep 13 | 54356 | G15 | 5400 | 16.34.3 | 10.21.3 |
2.2 Optical spectroscopic observations
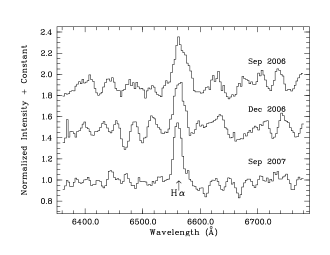
The spectroscopic observations were performed on September 26, and December 24, 2006 and September 13, 2007 with the Russian-Turkish 1.5 m Telescope (RTT150) using medium resolution spectrometer TFOSC (TÜBİTAK Faint Object Spectrometer and Camera). We used grism G15 (spectral range 3200-9125 Å) with the nominal dispersion of 3.1 Å pixel-1. Table 2 gives the measurements of the equivalent width (EW) of the H line for each observing run together with the values of full width at half maximum (FWHM).
The reduction and analysis of spectrum was made using the package Longslit context of MIDAS. The FWHM and EW values were obtained from Gauss fit models to the emission features.
| RXTE/ASM | |||||||
| Orbit | Epoch | Orbit | Epoch | Orbit | Epoch | Orbit | Epoch |
| Number | (MJD) | Number | (MJD) | Number | (MJD) | Number | (MJD) |
| 0 | 50178.0 1.0 | 23 | 51231.2 3.5 | 45 | 52259.0 4.5 | 67 | 53268.4 0.5 |
| 1 | 50225.9 1.5 | 24 | 51286.2 1.0 | 46 | 52302.1 1.0 | 68 | 53314.6 0.5 |
| 2 | 50271.2 1.0 | 25 | 51333.4 1.5 | 47 | 52346.2 0.5 | 69 | 53362.8 2.0 |
| 3 | 50314.8 1.5 | 26 | 51377.3 0.5 | 48 | 52391.1 1.0 | 70 | 53407.5 0.5 |
| 4 | 50363.8 0.5 | 27 | 51424.8 1.5 | 49 | 52435.1 1.0 | 71 | 53452.4 0.5 |
| 5 | 50410.8 5.0 | 28 | 51468.0 1.0 | 50 | 52484.1 1.0 | 72 | 53498.8 0.5 |
| 6 | 50457.3 5.0 | 29 | 51518.3 1.0 | 51 | 52530.1 1.0 | 73 | 53542.3 0.5 |
| 7 | 50506.4 2.5 | 30 | 51563.0 3.0 | 52 | 52575.0 1.0 | 74 | 53590.1 0.5 |
| 8 | 50548.4 0.5 | 31 | 51607.9 1.0 | 53 | 52621.6 1.5 | 75 | 53635.2 0.5 |
| 9 | 50595.3 1.5 | 32 | 51652.5 1.5 | 54 | 52668.2 1.0 | 76 | 53681.7 0.5 |
| 10 | 50640.6 0.5 | 33 | 51700.2 1.0 | 55 | 52714.8 0.5 | 77 | 53730.8 1.5 |
| 11 | 50686.8 5.0 | 34 | 51746.4 2.0 | 56 | 52761.7 0.5 | 78 | 53774.4 1.5 |
| 12 | 50732.1 0.5 | 35 | 51791.2 1.0 | 57 | 52808.2 1.0 | 79 | 53822.6 0.5 |
| 14 | 50825.7 5.0 | 36 | 51839.9 1.0 | 58 | 52850.6 1.0 | 80 | 53868.2 1.0 |
| 15 | 50871.5 1.0 | 37 | 51879.7 5.0 | 59 | 52897.3 1.0 | 81 | 53921.5 2.0 |
| 16 | 50917.3 5.0 | 38 | 51932.6 1.5 | 60 | 52944.0 1.0 | 84 | 54058.2 1.0 |
| 17 | 50962.1 5.0 | 39 | 51975.0 1.0 | 61 | 52990.1 1.0 | 85 | 54101.7 0.5 |
| 18 | 51010.3 0.5 | 40 | 52022.5 0.5 | 62 | 53036.4 0.5 | 86 | 54151.2 0.5 |
| 19 | 51054.6 1.0 | 41 | 52068.7 1.0 | 63 | 53084.1 1.5 | 87 | 54193.7 0.5 |
| 20 | 51103.5 2.5 | 42 | 52114.3 0.5 | 64 | 53130.2 0.5 | 88 | 54240.1 0.5 |
| 21 | 51146.9 1.0 | 43 | 52160.0 0.5 | 65 | 53175.9 0.5 | 89 | 54287.0 0.5 |
| 22 | 51188.6 3.5 | 44 | 52207.9 0.5 | 66 | 53222.7 0.5 | 90 | 54331.9 0.5 |
| SWIFT/BAT | |||||||
| 71 | 53449.0 0.5 | 76 | 53680.3 0.5 | 81 | 53919.9 2.0 | 88 | 54240.3 0.5 |
| 72 | 53497.7 0.5 | 77 | 53726.6 1.5 | 84 | 54057.9 1.0 | 89 | 54286.6 0.5 |
| 73 | 53542.2 0.5 | 78 | 53774.0 1.5 | 85 | 54101.0 0.5 | ||
| 74 | 53588.5 0.5 | 79 | 53821.9 0.5 | 86 | 54150.6 0.5 | ||
| 75 | 53634.9 0.5 | 80 | 53865.9 1.0 | 87 | 54194.0 0.5 |
2.3 RXTE/ASM and SWIFT/BAT observations
The All Sky Monitor (ASM) on board the Rossi X-ray Timing Explorer (RXTE) satellite consists of three wide-angle Scanning Shadow Cameras (SSCs). These cameras are mounted on a rotating drive assembly, which covers 70 of the sky every 1.5h (Levine et al. 1996). ASM light curves can be found in the public archive in different energy bands (1.3-3.0, 3.0-5.0, 5.0-12.0 keV). In Fig. 1, we present the ASM light curve in 5-12 keV.
The burst Alert Telescope (BAT) on board SWIFT satellite provides 15-150 keV monitoring observations primarily to determine the positions of gamma-ray bursts. The light curves of several targets are available in the public archive of SWIFT/BAT 444http:swift.gsfc.nasa.gov/docs/swift/results/. 15-50 keV BAT light curve of EXO 2030+375 is also presented in Fig. 1.
2.4 Optical and X-ray variability
We searched the short term variability in the optical light curve by applying Scargle and Clean algorithms (Scargle 1982, Roberts, Lehar Dreher 1987). We did not detect any significant periodicity in the optical light curve.
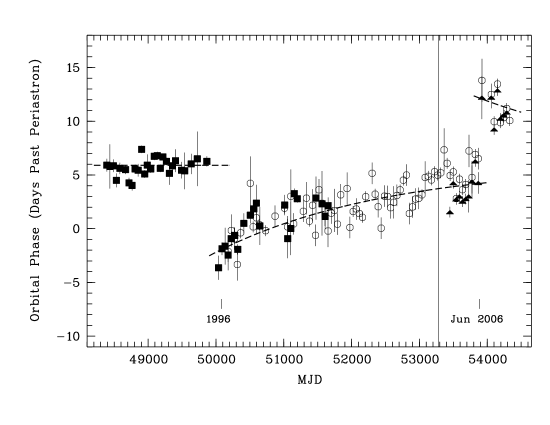
EXO 2030+375 showed a Type I outburst for each orbital cycle 46.02 days. Detailed studies of these outbursts were performed by Wilson et al. (2002, 2005). In these studies, it was found that prior to 1996, outbursts were about 6 days after periastron passages. Then suddenly outbursts shifted to about 4 days before periastron. The orbital phase of the outburst was rapidly recovered 2.5 days after periastron, and continued to change gradually. Finally, as of November 2004, the orbital phase of the outburst peak reached 5 days after periastron (Wilson et al. 2005).
In order to keep track, the phases of the Type I outbursts were estimated using archival observations of RXTE/ASM and SWIFT/BAT. We fitted a Gaussian model to the Type I outburst light curves of RXTE/ASM (5-12 keV) and SWIFT/BAT (15-150 keV) observations. We centered the Gaussian profile on the approximately predicted Type I outburst passage time. In the fitting, the center value, the amplitude and the width of Gaussian were taken as free parameters. We then determined the peak time of the outburst.
In Fig. 2, we present the observed minus calculated values of outburst epochs () relative to the constant orbital period ( days). The epoch of the periastron passage from the pulse timing solution was obtained by Wilson et al. (2002) as MJD 50547.22. To obtain the closest periastron passage to the first X-ray outburst, we subtracted 8 orbital cycles from this epoch (MJD ). It is clear that our results are consistent with previously published curves (Wilson et al. 2002, 2005; Camero et al. 2005) and indicate that the outburst delay varies around 4-7 days prior to the giant outburst. In Table 3, we display the outburst arrival times and orbital cycle numbers n.
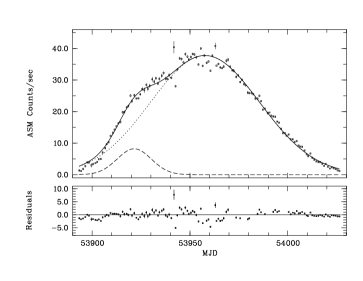
We modeled a Type II outburst using a simple two component Gaussian model. Figure 3 shows the two component Gaussian fit to the Type II outburst. The best fit is obtained by two Gaussian curves: the main peak being centered at MJD 53957.8 with a width of 31.8 days and a secondary peak centered at MJD 53921.5 with a width of 8.35 days. The residuals to the fit are also shown in the same figure. The peak time for the secondary Gaussian corresponds to a shift of 13.8 days after the periastron passage. This secondary peak can be interpreted as a Type I outburst in the sense that its peak time and amplitude are in agreement with the results obtained for other Type I outburst peaks observed after the giant Type II outburst, as seen in Fig. 2 and Fig. 4. Since Type I outbursts occurred periodically for a long time before the giant outburst, we expected this secondary peak to be a continuation of periodic behavior during the Type II outburst.
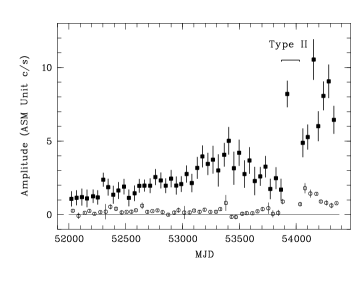
We estimated the amplitudes of Type I outbursts from Gaussian fits for each outburst. We also estimated the baseline count rates by fitting a parabola to the RXTE/ASM light curve between the successive Type I outbursts. In Fig. 4, we present the time evolution of amplitudes of the Type I outburst and baseline estimates. The amplitudes of the Type I outbursts are fairly stable around 1 c/s before MJD 52500. Then a gradual increase of the amplitudes up to MJD 53500 and a rapid decrease before the onset of the giant Type II outbursts is seen. After the Type II outburst, the amplitudes of the Type I outbursts show an increase and EXO 2030+375 brightens in Type I X-ray outburst.
The baseline count rate estimates of RXTE/ASM observations are 0.2 c/s before the Type II outburst. After the giant outburst, the baseline count rates decrease starting from 2 c/s. In order to see the decreasing trend more clearly, we fitted an exponential model to the baseline count rate estimates. The fitted exponential decay time is 15521 days. The same type of behavior is present for SWIFT observations with a decay time of 13413 days.
3 Discussion
The infrared and spectroscopic observations of Wilson et al. (2002) have shown that the density of the disk and the brightness of IR observations are correlated. Their observations also showed that the equivalent width of H increased with the density of the disk. Based on the study of IR and X-ray observations, they concluded that the Be disk was truncated at a 4:1 resonance radius. According to their findings, in 1993 a major structural change occurred in the Be star’s circumstellar disk. After about January 1993, the JHK magnitudes began to decline and dropped to a minimum near August 1996 and both the IR magnitudes and the H equivalent widths indicated that the density of disk decreased.
ROTSE observations are excellent for continuous monitoring of optical counterpart (V2246 Cyg) to EXO 2030+375. Fig. 1 shows that the optical counterpart to EXO 2030+375 becomes fainter after MJD 53600 (during the decrease of amplitudes of Type I outbursts). This faintness in the magnitudes probably shows an increase in the density of the disk which may result during the sudden discrete ejection of material by the Be star to its circumstellar disk. This material may obscure light coming from the photosphere of Be star. The change of about 0.4 magnitude in the optical light is similar to the change that we observed in the optical light of V635 Cas before the Type II outburst of 2004 (Baykal et al. 2005). After MJD 53900 (during and after the Type II outburst) the optical observations did not show variabilities in the magnitudes above one sigma confidence level. We also did not detect any optical variability in this system during the Type I outbursts as Norton et al. (1994) noted.
H (6563 Å) profile is a good indicator for the presence of circumstellar disk around Be stars and its morphology. The observed H profiles and their EW during the decay of and after the giant Type II outburst are presented in Fig. 5 and Table 2. The observed profiles are single peaked. However, the data of September 2006 seem more complex than a single Gaussian which shows an asymmetric profile with a red shoulder. This indicates a perturbed density distribution in the Be disk during the Type II outburst (Negueruela et al. 1998). The asymmetric profile of H line begins to disappear 3 months later. Due to low flux in the observed profiles and poor resolution, it is difficult to say more about the shape of profiles. However, the measured EW is consistent with the H EW values of Reig et al. (1998) and Wilson et al. (2002) during the X-ray active period after MJD 50000.
Formation of a transient disk around neutron star during Type II outburst can be predicted considering the baseline estimates of the count rates. After the Type II outburst, the baseline count rate is about 2 c/s. It then decreases to a level similar to pre-outburst rates with a decay time of 15521 days suggesting that a transient disk is formed around the neutron star during the giant outburst. The transient disk seems to disappear in about 5 months. Klochkov et al. (2007) have predicted a sharp change in the spin frequency of the pulsar in this system. They attributed this change to the formation of an accretion disk around the neutron star. Motch et al. (1991) makes a similar suggestion about the formation of a transient accretion disk during the giant outburst of the Be/X-ray system A0535+26 considering the steep dependency of the specific angular momentum of the accreted material with envelope expansion velocity during the Type II outburst.
Type I X-ray outbursts peak 6 days after periastron passage prior to the Type II outburst. After the Type II outburst, Type I outburst peaks show a sudden shift to 13 days after periastron passage. Negueruela et al. (1998) proposed that there is a relation between density waves and Type II outbursts. The perturbation in the density waves would cover the whole radial structure of the disk with a typical time scale of a few days to years. They observed evidence of density perturbation coinciding with Type II outbursts for Be binary systems of 4U 0115+634 and A0535+26. We expect similar behavior for EXO 2030+375.
Negueruela et al. (1998), also suggested that Type I outbursts may be observed where the interaction of neutron star occurred with the regions of enhanced density at which these waves are generated. The precession period of density waves for EXO 2030+375 was suggested to be 153 years by Wilson, Fabregat Coburn (2005). Recent observations imply that this precession period is interrupted during the Type II outburst. A new precession period could be set up but at this point the period is not known. Future monitoring of this source should yield a better understanding of this source.
Acknowledgements.
This project utilizes data obtained by the Robotic Optical Transient Search Experiment. ROTSE is a collaboration of Lawrence Livermore National Lab, Los Alamos National Lab and the University of Michigan (http://www.rotse.net). We thank the Turkish National Observatory of TÜBİTAK for running the optical facilities. We acknowledge support from TÜBİTAK, The Scientific and Technological Research Council of Turkey, through project 106T040. We also acknowledge the RXTE/ASM team for the X-ray monitoring data. Swift/BAT transient monitor results provided by the Swift/BAT team.References
- Akerlof et al. (2003) Akerlof C. W., Kehoe R.L., McKay T.A., Rykoff E.S., Smith D.A., et al., 2003, PASP, 115, 132
- Baykal et al. (2005) Baykal A., Kızıloğlu Ü., Kızıloğlu N., Balman Ş., İnam S.C., 2005, AA, 439, 1131
- Bildsten et al. (1997) Bildsten, L., et al. 1997. ApJS. 113, 367
- Camero et al. (2005) Camero, A.A., Wilson, C.A., Conell, P., Martinez, N., Blay, S., Becknam, V., Reglero, V. 2005, AA, 441, 261
- Coe et al. (1988) Coe, M.J., Longmore, A., Payne, B.J., Hanson, C.G. 1988, MNRAS, 232, 865
- Corbet et al. (2006) Corbet, R.H.D., Levine, A.M., 2006, ATel, 843, 1L
- Janot-Pacheco et al. (1988) Janot-Pacheco, E., Motch, C., Pakull, M.W. 1988, AA, 202, 81
- Kızıloğlu et al. (2005a) Kızıloğlu Ü., Kızıloğlu N., Baykal A., 2005a, AJ, 130, 2076
- Kızıloğlu et al. (2005b) Kızıloğlu, Ü., Kızıloğlu, N., Baykal, A., IBVS, 2005b, 5589
- Klochkov et al. (2007) Klochkov F., et al., 2007, AA. 464, 45
- Levine et al. (1996) Levine, A.M., Bradt. H., Cui. W., et al. 1996, ApJ, 469, L33
- Miroshnichenko et al. (2001) Miroshnichenko, A.S., et al. 2001, AA. 377, 485
- Motch et al. (1991) Motch, C., Stella, L., Janot-Pacheco, E., Mouchet, Mr. 1991, ApJ. 369, 490
- Motch (1987) Motch, C., Janot-Pacheco, E., 1987, AA, 182, L55
- Negueruela et al. (2001) Negueruela, I., Okazaki, A.T., Fabregat, J., Coe, M.J., Munari, U., Tomov, T. 2001, AA, 369, 117
- Negueruela et al. (1998) Negueruela, I., Reig, P., Coe, M.J., Fabregat, J. 1998, AA, 336, 251
- Norton et al. (1994) Norton, A.J., Chakrabarty, D., Coe M.J., Everall, C., Finger, M.H., Prince, T.A., Roche, P., Stollberg, M.T, Wilson, R.B. 1994, MNRAS, 271, 981.
- Okazaki et al. (2001) Okazaki, A.T., Negueruela, I. 2001. AA. 377, 161
- Parmer et al. (1989) Parmar, A.N., White, N.E., Stella, L., Izzo, C., Ferri, P. 1989, ApJ, 338, 359
- Reig et al. (1998) Reig, P., Stevens, J.B., Coe, M.J., Fabregat, J., 1998, MNRAS, 301, 42
- Roberts et al. (1987) Roberts, D.H., Lehar, J., Dreher, J.W. 1987, AJ, 93, 968
- Scargle (1982) Scargle, J.D., 1982, ApJ, 263, 835
- Stella et al. (1986) Stella, L., White, N.E., Rosner, R. 1986, ApJ. 308, 669
- Wilson et al. (2002) Wilson, C.A., Finger, M.H., Coe, M.J., Laycock, S., Fabregat, J. 2002. ApJ. 570, 287
- Wilson et al. (2005) Wilson, C.A., Fabregat, J., Coburn, W. 2005. ApJLett. 620, L99
- Wilson et al. (2006) Wilson, C.A., Finger, M.H., ATel, 2006, 877, 1W