Nuclear/Circumnuclear Starbursts and Active Galactic Nuclei Mass Accretion in Seyfert Galaxies
Abstract
We investigated the correlation between nuclear/circumnuclear starbursts around the active galactic nuclei (AGNs) and the AGN activities for 43 Seyfert galaxies in the CfA and 12 samples. We found that circumnuclear starburst luminosity as well as nuclear starburst luminosity are positively correlated with AGN luminosity. Moreover, nuclear starburst luminosity is more strongly correlated with the AGN luminosity normalized with AGN Eddington luminosity than is circumnuclear starburst luminosity. This implies that starbursts nearer the AGN could have a greater effect on AGN mass accretion. We also discuss these results from the viewpoint of the radiation effects from starbursts and sequential starbursts.
1 INTRODUCTION
Since the discovery of active galactic nuclei (AGNs) the physical mechanism of AGN fueling remains unresolved. Various fueling mechanisms have been considered thus far, for example, tidal torque driven by major/minor galaxy merger (Hernquist, 1989; Barnes & Hernquist, 1991; Mihos & Hernquist, 1996; Taniguchi, 1999; Saitoh & Wada, 2004), tidal torque from nonaxisymmetric gravitational potential due to a stellar bar (Noguchi, 1988; Shlosman et al., 1990; Barnes & Hernquist, 1992; Knapen et al., 1995; Benedict et al., 1996; Fukuda et al., 2000), shock or turbulence in the interstellar medium (Fukuda et al., 1998; Montenegro et al., 1999; Wada & Norman, 1999, 2001; Maciejewski et al., 2002; Wada et al., 2002; Onodera et al., 2004), and radiation drag from a starburst (Umemura et al., 1997; Fukue et al., 1997; Umemura et al., 1998; Ohsuga et al., 1999).
Numerous observations have gradually clarified circumnuclear starburst events (several hundreds of parsecs to a few kiloparsecs from the center) around AGNs. These starbursts often exhibit patchy and ringlike structures (Pogge, 1989; Wilson et al., 1991; Forbes et al., 1994; Marconi et al., 1994; Mauder et al., 1994; Buta et al., 1995; Barth et al., 1995; Leitherer et al., 1996; Maoz et al., 1996; Storchi-Bergmann et al., 1996; Elmouttie et al., 1998; Knapen et al., 2002; Knapen, 2005). In addition, hidden nuclear starbursts (within a few hundred parsecs from the center) are found both in Seyfert 1 and 2 galaxies (Imanishi, 2002, 2003; Rodríguez-Ardila & Viegas, 2003) and the nuclear starburst luminosity is positively correlated with the AGN power (Imanishi & Wada, 2004).
These starburst events could strongly influence the structure and the dynamics of gas through the energy input of multiple supernova explosions (Shapiro & Field, 1976; Tomisaka & Ikeuchi, 1986; Norman & Ikeuchi, 1989; Wada & Norman, 2002) and the effects of strong radiation (Umemura et al., 1997, 1998; Ohsuga & Umemura, 1999, 2001; Kawakatu & Umemura, 2002; Watabe & Umemura, 2005; Thompson et al., 2005). Especially, for the AGN mass accretion, Wada & Norman (2002) shows the possibility of AGN fueling from the effect of the chaotic disturbance by the nuclear starburst using three-dimensional hydrodynamic simulation. Moreover, Umemura et al. (1997, 1998) have shown that the radiation effects of circumnuclear starburst could cause AGN fueling.
These theoretical and observational results suggest that some connections exist between the nuclear/circumnuclear starburst and AGN activity. Although a relationship between the nuclear starburst and the AGN has been reported (Imanishi & Wada, 2004; Davies et al., 2007), this remains uncertain regarding the circumnuclear starburst. Moreover, it is not clear whether a specific relationship exists between AGN mass accretion and the starburst at various scales. In this study, we investigated the relationship between the nuclear/circumnuclear starburst and AGN activity by considering both nuclear and the circumnuclear starbursts.
To investigate nuclear/circumnuclear starbursts, we used the polycyclic aromatic hydrocarbon (PAH) emission feature at 3.3 m, 6.2 m, 7.7 m, and 11.3 . The PAHs are excited by far-UV photons and strong PAH emission are seen in star-forming regions, whereas a pure AGN shows only a featureless spectrum with virtually no PAH emission. Also, since the dust extinction is much lower for these PAH emission (; Rieke & Lebofsky, 1985; Lutz et al., 1996), we can quantitatively estimate modestly obscured ( mag) star-formation activity by using these emission lines. Throughout the paper, we adopted , , and .
2 SAMPLE DATA
We studied 21 Seyfert 1 galaxies and 22 Seyfert 2 galaxies in the CfA (Huchra & Burg, 1992) and 12 (Rush et al., 1993) samples selected based on their host-galaxy magnitudes and IRAS 12 m fluxes, respectively. These samples are not expected to be biased toward or against the presence of nuclear starbursts. Our sample was selected from Imanishi & Wada (2004) data set with both the 3.3 m PAH luminosity and the nuclear N-band luminosity. In their sample, Seyfert galaxies at were selected to investigate the nuclear starburst by ground-based spectroscopy using a - slit, where corresponds to a physical scale of 150 () to 650 pc (). Also, to be best observable from Mauna Kea, Hawaii, the declinations of Seyfert galaxies are limited to being larger than . Owing to the telescope limit of the IRTF 3 m telescope, a restriction of declination of less than is also applied. For their sample, there are no obvious biases.
Among 43 Seyfert galaxies, we estimated the supermassive black hole (SMBH) mass to investigate the mass accretion rate normalized with the AGN Eddington mass accretion rate for 25 objects. To these objects, we estimated the 6.2 m, 7.7 m, and 11.3 m PAH emission for 13 objects further. Also, we collected the X-ray luminosity from the data in the literature for 15 objects. Since our sample included some upper limit data, we used statistical techniques applicable to a sample where upper limit data are present.
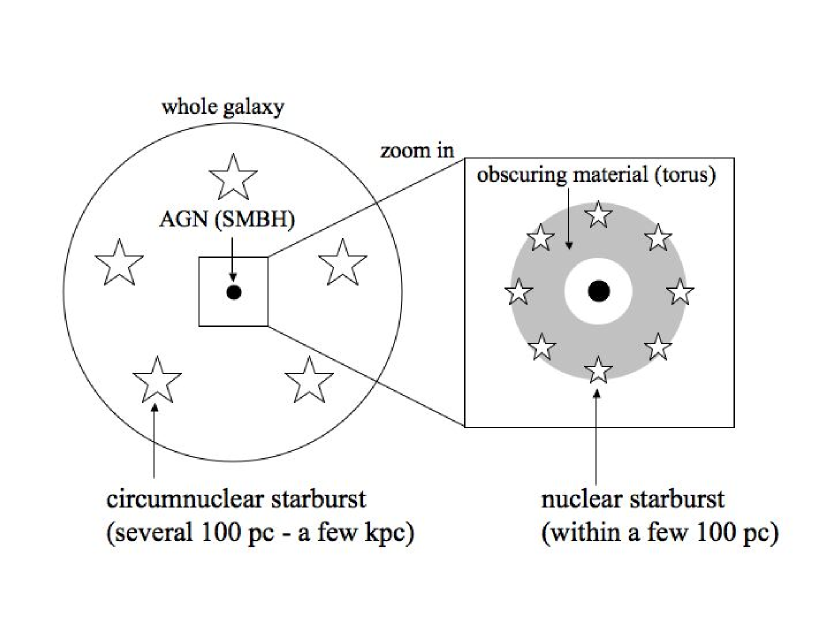
We focused on both nuclear starbursts, which exist within a few hundred parsecs from the center, and circumnuclear starbursts in the entire host galaxy region. Figure 1 shows the schematic view of the nuclear/circumnuclear starbursts. We can consider the 3.3 m PAH emission, which were derived through ground-based spectroscopy using the narrow slit, as a nuclear starburst. Also, since a circumnuclear starburst is typically much higher than a nuclear starburst (see section 4.2), the 6.2 m, 7.7 m, and 11.3 m PAH emission, which were observed in the whole host galaxy region, represent a circumnuclear starburst. In detail, we described in section 3.1 and 3.2.
3 ESTIMATION OF PHYSICAL PROPERTIES
3.1 Nuclear Starburst
PAH molecules near the AGN can be destroyed by strong X-ray radiation from the AGN (Voit, 1992; Siebenmorgen et al., 2004). However, if the PAH molecules are sufficiently shielded by a substantial column density of X-ray-absorbing gas, PAHs can survive even if they exist near the AGN. In fact, ample gas is believed to exist that could be related to the obscuring material (the dusty torus in the context of the AGN unified model) around the AGN. In addition, the gravitational stability parameter (Toomre, 1964) decreases with the radius of the obscuring material, whose mass is notably smaller than that of the SMBH (Imanishi, 2003). The gravitational collapse of molecular gas can therefore occur more easily in the outer part of the obscuring material. Thus, in the outer part of the obscuring material, a starburst could exist near the AGN and PAHs could survive. In fact, from the estimation of the surface brightness values of the 3.3 m PAH emission (Imanishi & Alonso-Herrero, 2004; Imanishi & Wada, 2004), which were derived through ground-based spectroscopy using the - slit, this emission should come from nuclear starbursts in the gas-rich region, which may be the obscuring material around AGN.
Therefore, we can use their 3.3 m PAH emission data, which were observed by ground-based spectroscopy using the narrow slit, as the indicators of nuclear starbursts. Although the circumnuclear starburst, which often exhibit ring-like structures with a radius of kiloparsecs order from the center, along the slit direction could be also included, the fraction of the circumnuclear starburst emission inside this thin slit is negligible compared to the whole. Thus, the 3.3 m PAH emission could be regarded as a practical probe for nuclear starbursts in both Seyfert 1 and Seyfert 2 galaxies.
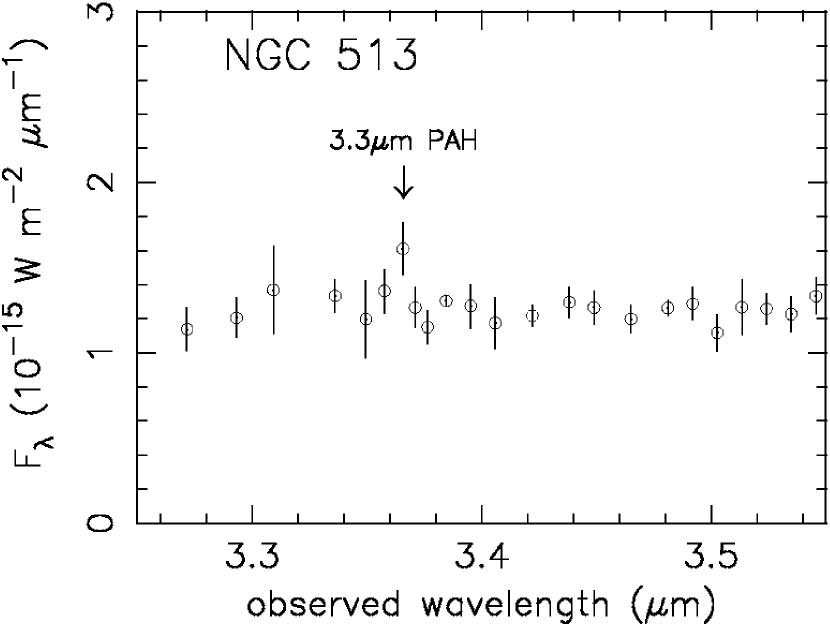
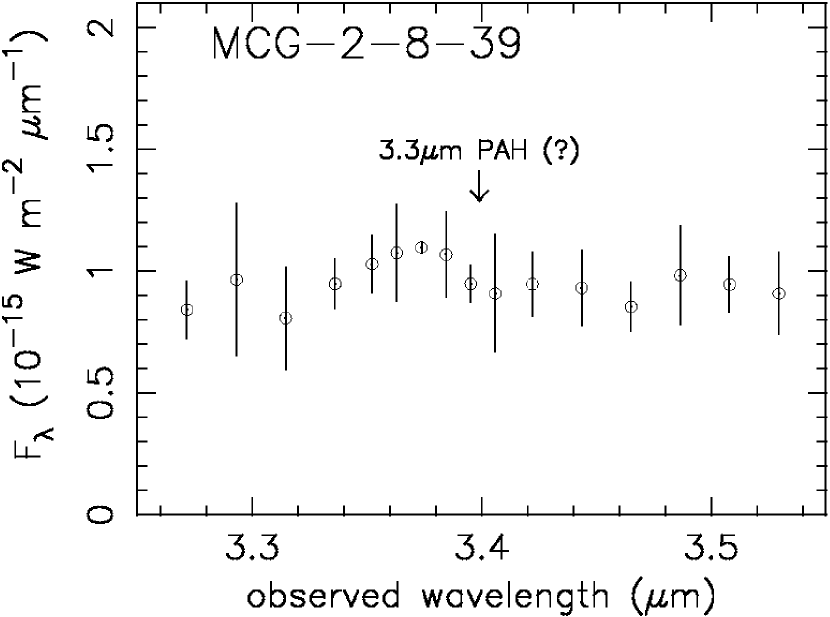
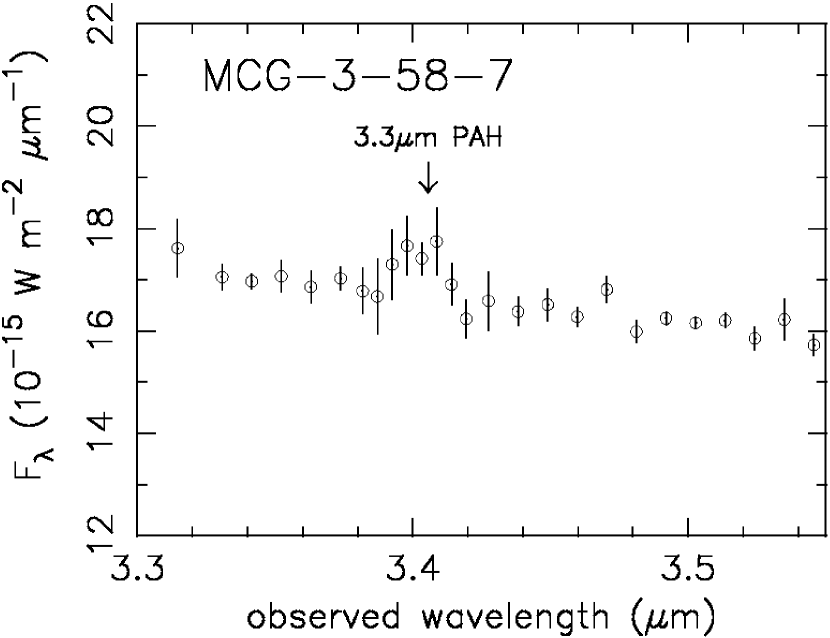
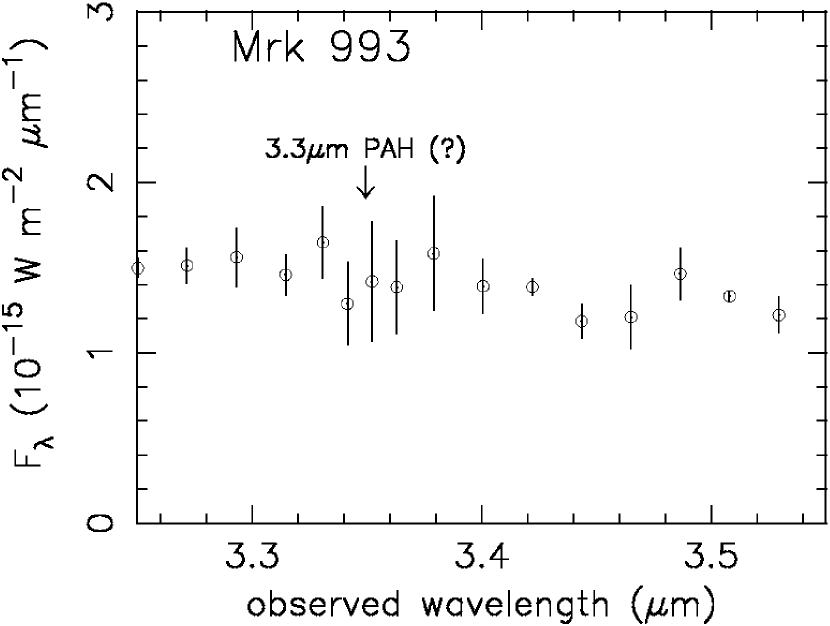
In Imanishi (2003) and Imanishi & Wada (2004), only upper limits for the nuclear 3.3 m PAH fluxes are available in more than half of the observed Seyfert galaxies. Additionally, the observed Seyfert galaxies do not comprise a complete sample. To increase the number and fraction of Seyfert galaxies with detectable nuclear 3.3 m PAH emission, we newly observed eight sources, which are shown in Table 1. Among them, six sources (NGC 931, F03450+0055, NGC 262, NGC 513, MCG-3-58-7, and Mrk 993) showed possible signs of the 3.3 m PAH emission in our previously obtained infrared 3–4 m spectra (Imanishi, 2003; Imanishi & Wada, 2004). Therefore, we decided to re-observe these sources with longer exposure to check if the signs are real or not. The two sources (MCG-2-8-39 and 0152+06) are newly observed this time to increase the number of observed sources. We showed these observations in Appendix.
3.2 Circumnuclear Starburst
To estimate the absolute magnitudes of circumnuclear starburst activity in Seyfert galaxies, we analyzed archival infrared data obtained with the Infrared Spectrograph (IRS) (Houck et al., 2004) onboard the Spitzer Space Telescope (Werner et al., 2004) through the program PID 3269 (PI = Gallimore). We focused on the infrared spectra of Short-Low 2 (SL2; 5.2–7.7 m) and 1 (SL1; 7.4–14.5 m), to estimate the fluxes of PAH-emission features at = 6.2 m, 7.7 m, and 11.3 m in the rest frame.
We used the latest pipeline-processed data products at the time of our analysis (S11–14, pbcd files). The observations were performed with the slit-scan mode, and the entire host galaxy regions of the Seyfert galaxies were covered. We summed all the signals and extracted the spectra after subtracting the background emission in a standard manner. Thus, the resulting spectra should reflect the emission from the entire regions of the Seyfert galaxies. Wavelength and flux calibrations for the SL data were made on the basis of the files of the Spitzer pipeline-processed data, termed “b0_wavsamp.tbl” and “b0_fluxcon.tbl”, respectively. For SL1 spectra, data at 14.5 m in the observed frame are invalid (Infrared Spectrograph Data Handbook Version 1.0) and so were removed. For some faint sources, appropriate spectral binning was applied to reduce the scatter of data points and to achieve more reliable measurements of the PAH fluxes.
The circumnuclear starburst luminosity is typically much higher than the nuclear starburst luminosity (Imanishi, 2003; Imanishi & Wada, 2004, and see section 4.2). Thus, we can consider that the 6.2 m, 7.7 m, and 11.3 m PAH emission, which were observed in the whole host galaxy regions, are good indicators of a circumnuclear starburst even if these PAH luminosity contain a small contribution from nuclear starbursts.
3.3 AGN Luminosity
For AGN activity, we used the nuclear N-band (m) luminosity measured with a aperture (Gorjian et al., 2004) since the contribution of starbursts for the nuclear N-band luminosity is small (Gorjian et al., 2004). However, nuclear N-band luminosity represents the reemission of hot dust illuminated by the AGN. So it may contain some uncertainties due to the dust distribution and the covering factor of the dusty torus around the AGN. To examine whether the nuclear N-band luminosity represents AGN activity in the sample data, we also used absorption-corrected hard (2-10 keV) X-ray luminosity, which is regarded as the AGN intrinsic luminosity for the Compton-thin AGN by using the data in the literature (see references in Table 3).
3.4 Black Hole Mass
Next, we estimated the SMBH mass, , to investigate the mass accretion rate normalized with the AGN Eddington mass accretion rate. To estimate SMBH masses of Seyfert 1 galaxies, we used the following method (in detail, see Kawakatu et al., 2007). The method for estimating the mass of a SMBH is based on the assumption that the motion of ionized gas clouds moving around the SMBH is dominated by the gravitational force and the clouds within the broad-line region (BLR) are virialized (e.g., Peterson & Wandel, 1999). Adopting an empirical relationship (Kaspi et al., 2000) between the size of the BLR and the rest-frame optical continuum luminosity, and reverberation mapping, we can obtain the following formula:
| (1) |
We can use this equation for estimating the mass of SMBHs in Seyfert 1 galaxies.
4 RESULTS
4.1 Nuclear 3.3 m PAH Emission
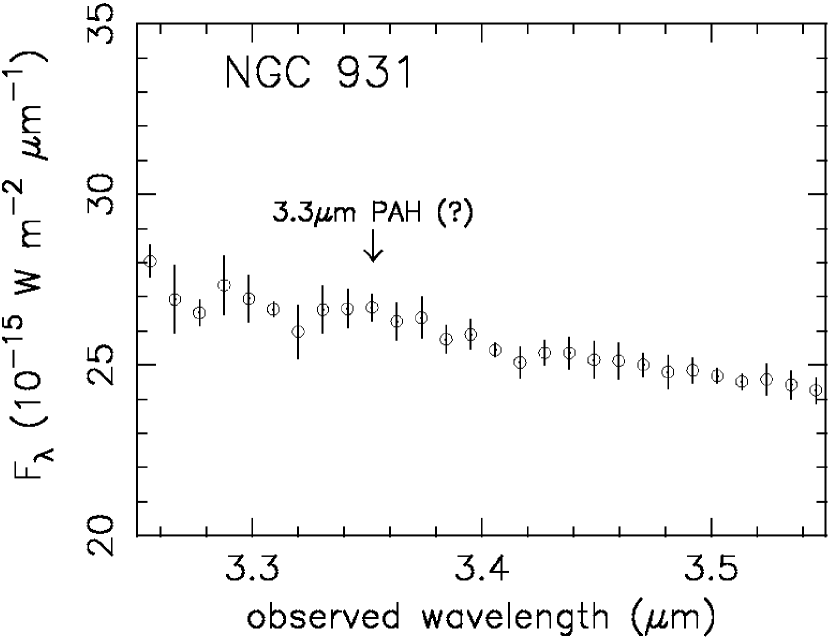
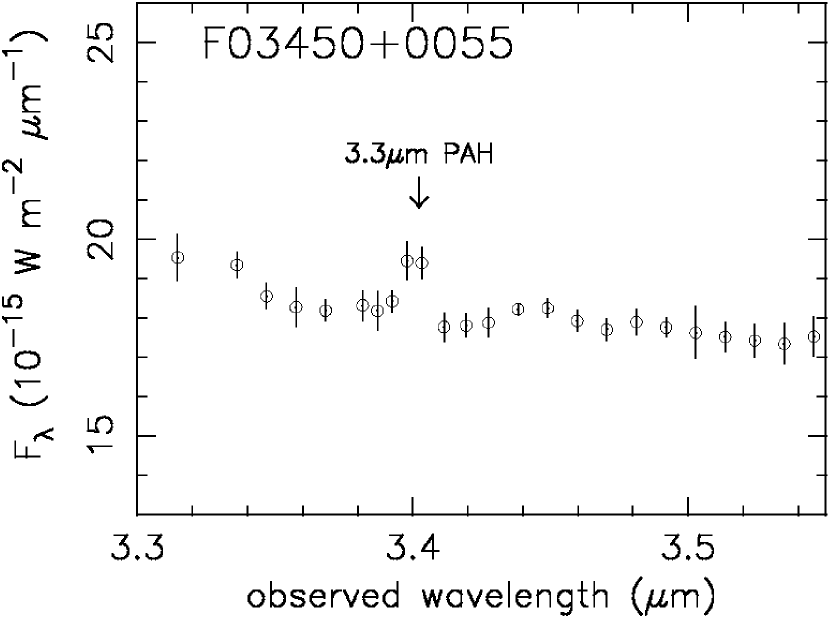
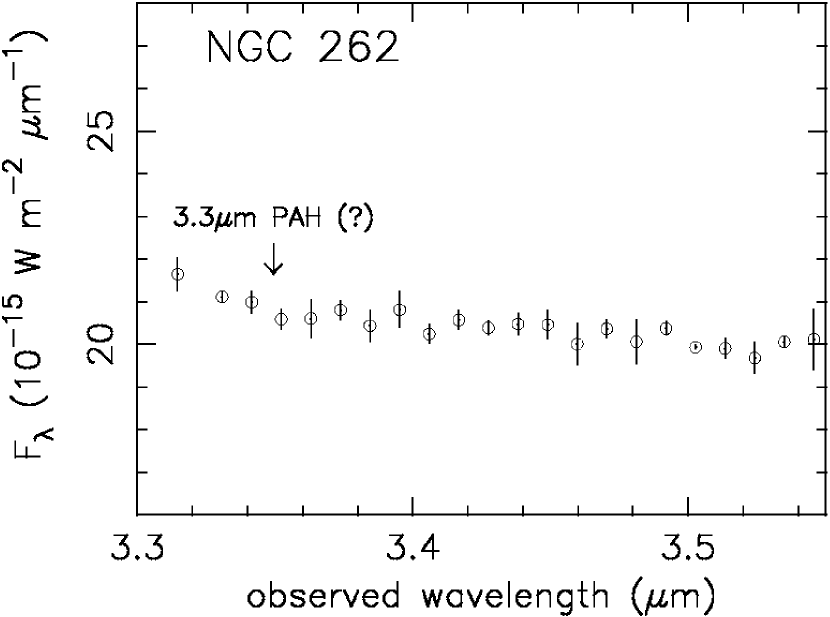
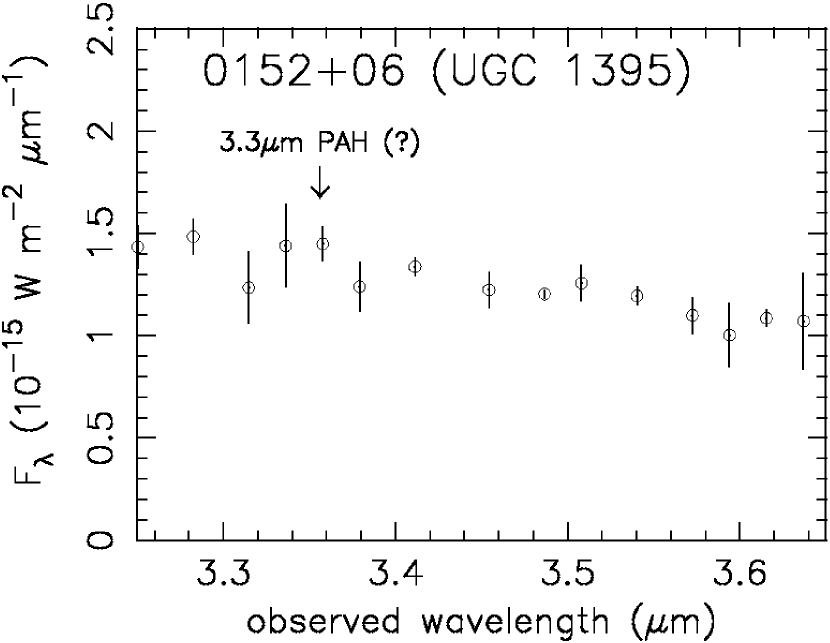
Figure 2 represents the zoom-in spectra around the 3.3 m PAH emission feature of the observed Seyfert galaxies. Thanks to the excellent observing conditions and longer exposure, the flux excesses at the expected wavelength of the 3.3 m PAH emission feature at (1 + ) 3.3 m are now recognizable in the three sources (F03450+0055, NGC 513, and MCG-3-58-7), marked with “3.3 m PAH” in Fig. 2. For these sources, the fluxes, luminosities, and rest-frame equivalent widths (EW3.3PAH) of the 3.3 m PAH emission were estimated using Gaussian fits. For the remaining five sources with no clear 3.3 m PAH detection (marked with “3.3 m PAH (?)” in Fig. 2), we estimated the upper limits of the PAH strengths, by adopting the lowest plausible continuum levels and assuming the profile of type-1 sources in Tokunaga et al. (1991) as a 3.3 m PAH template. Table 2 summarizes the results.
At 3.3 m in the rest frame, Pf (3.30 m) emission is present, superposed on the 3.3 m PAH emission. The relative contribution from this Pf emission line is expected to be high in Seyfert 1 galaxies, because broad emission line components are unobscured. However, the equivalent width of the Pf line is expected to be 0.3 nm for a typical Seyfert 1 galaxy (Imanishi et al., 2006), and even lower in a Seyfert 2 galaxy. This equivalent width value is much lower than the observed values or upper limits in Table 2. We thus ascribe the flux excess at = 3.3 m mostly to the 3.3 m PAH emission feature.
Among the six previously observed Seyfert galaxies, the detected 3.3 m PAH fluxes or their upper limits are lower than previously derived upper limits (Imanishi, 2003; Imanishi & Wada, 2004), except NGC 931. For NGC 931, our new upper limit of the 3.3 m PAH flux is 50% higher than our previous estimate (Imanishi & Wada, 2004), possibly because our new estimate is a conservative one, derived based on the lowest plausible continuum level. The 3–4 m continuum flux levels are also similar within 50% between the spectra in this paper and in our previous papers (Imanishi, 2003; Imanishi & Wada, 2004), except NGC 513. The flux of NGC 513 in this paper is more than 1 mag fainter than in Imanishi (2003), possibly because of narrower slit employed and/or the flux variation of the 3–4 m continuum emission, originating in AGN-heated hot dust.
4.2 6.2 m, 7.7 m, and 11.3 m PAH Emission
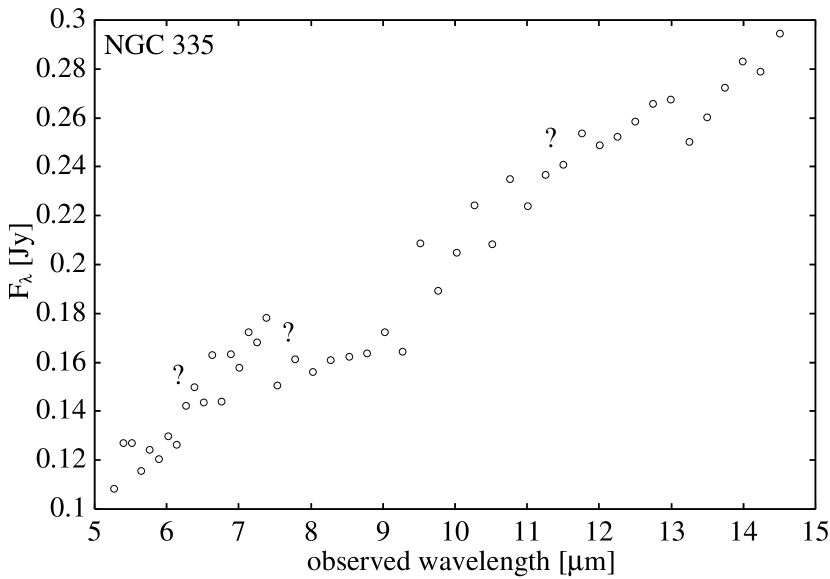
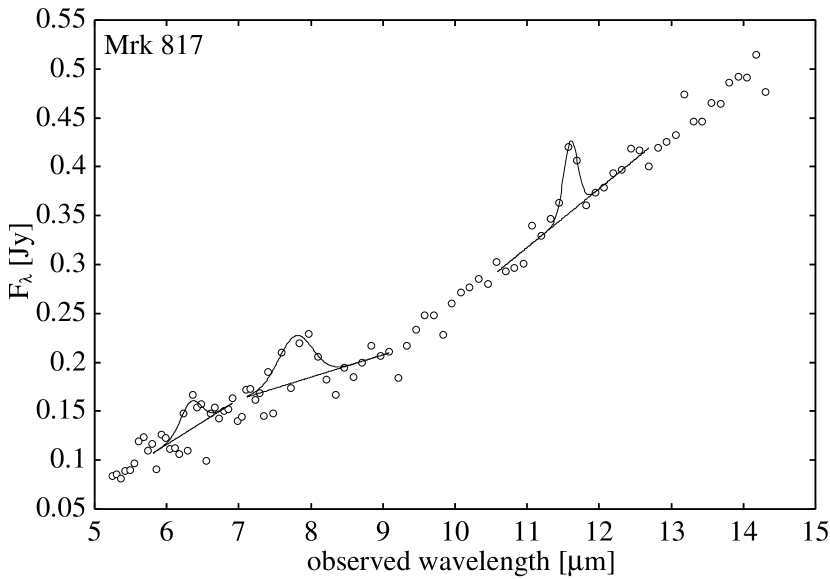
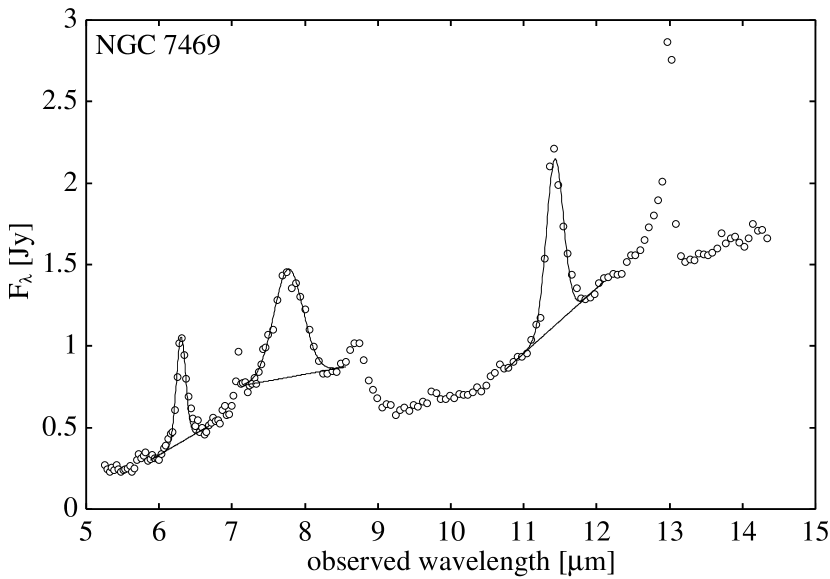
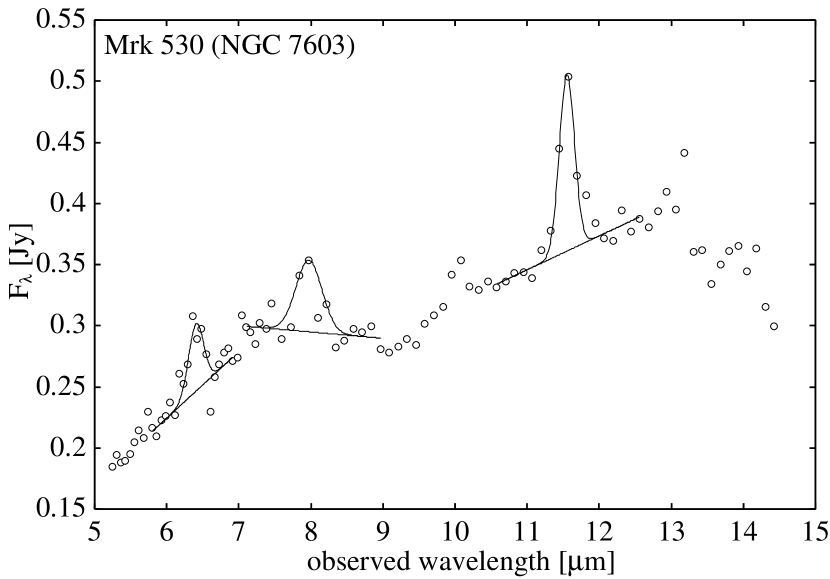
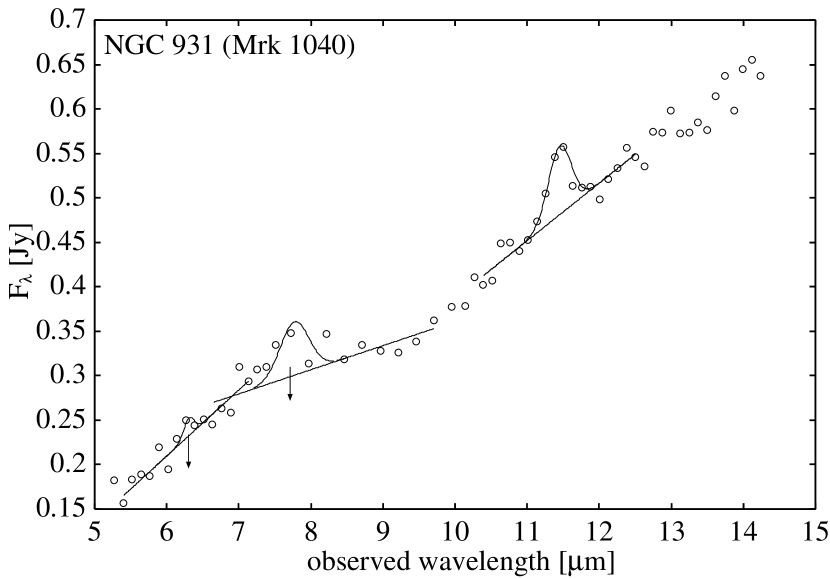
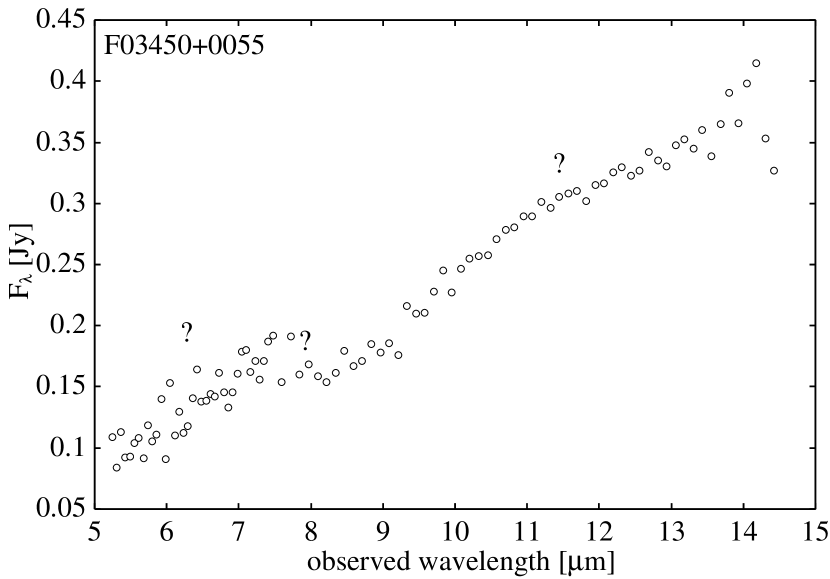
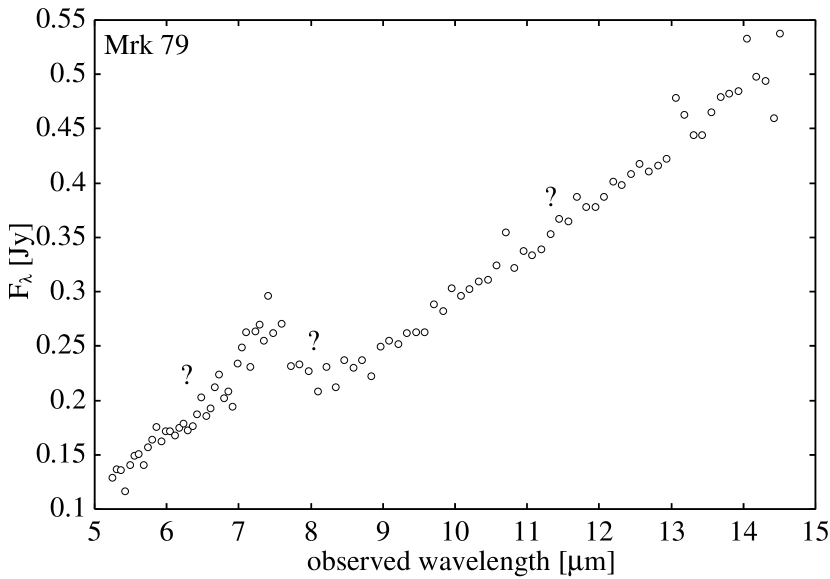
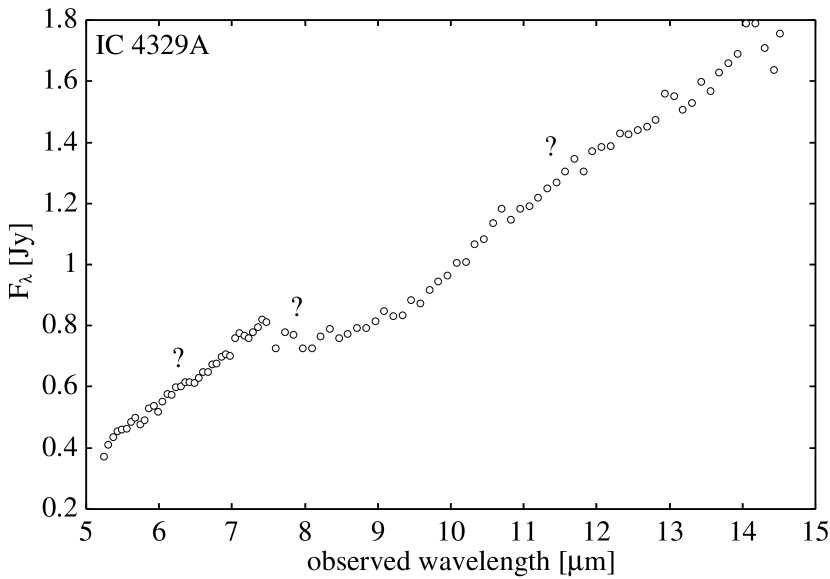
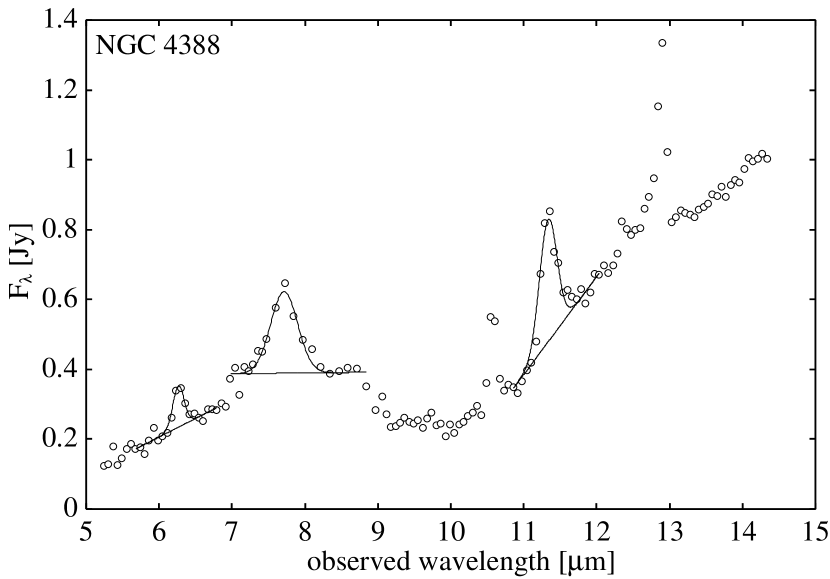
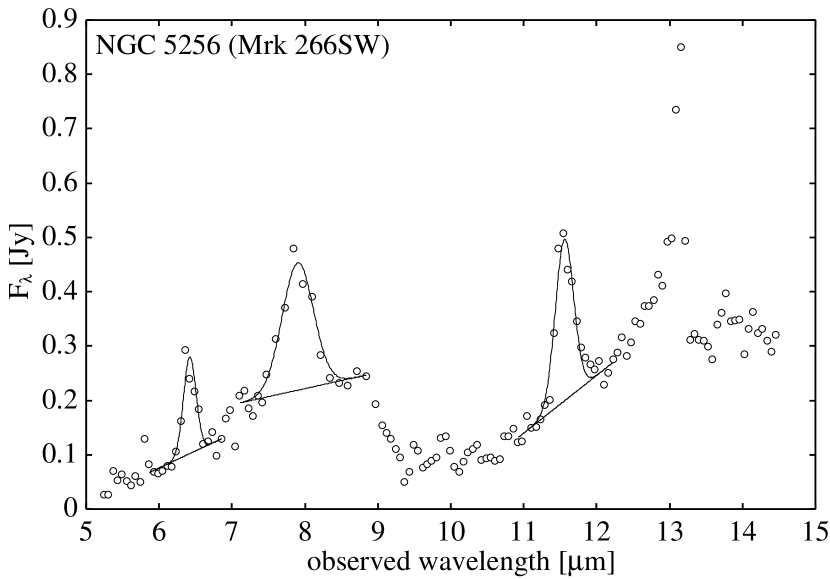
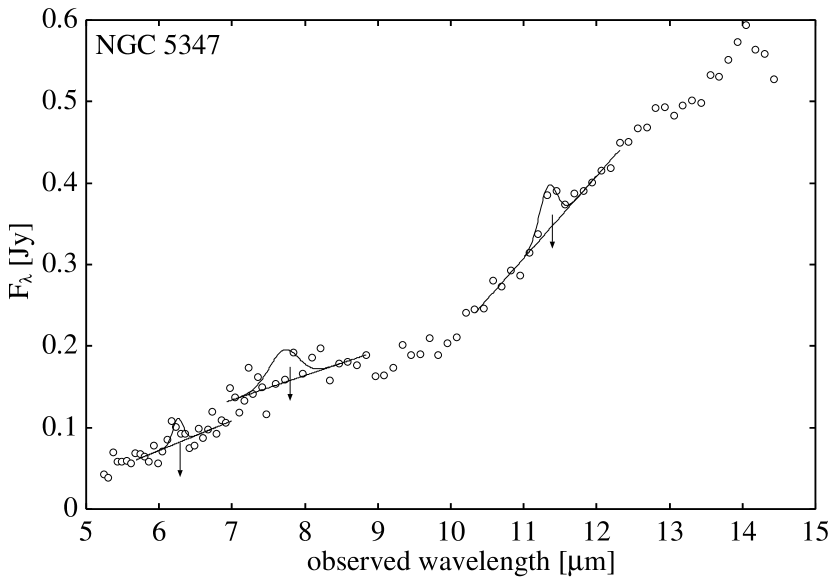
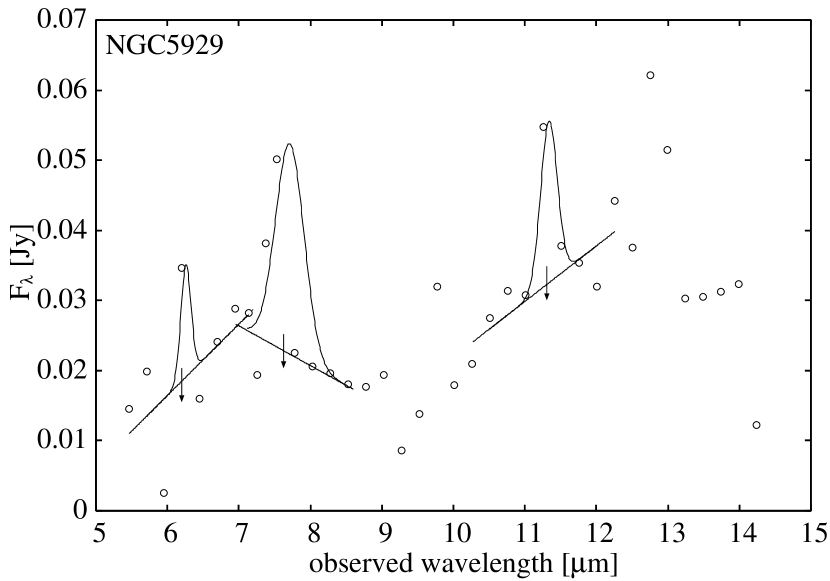
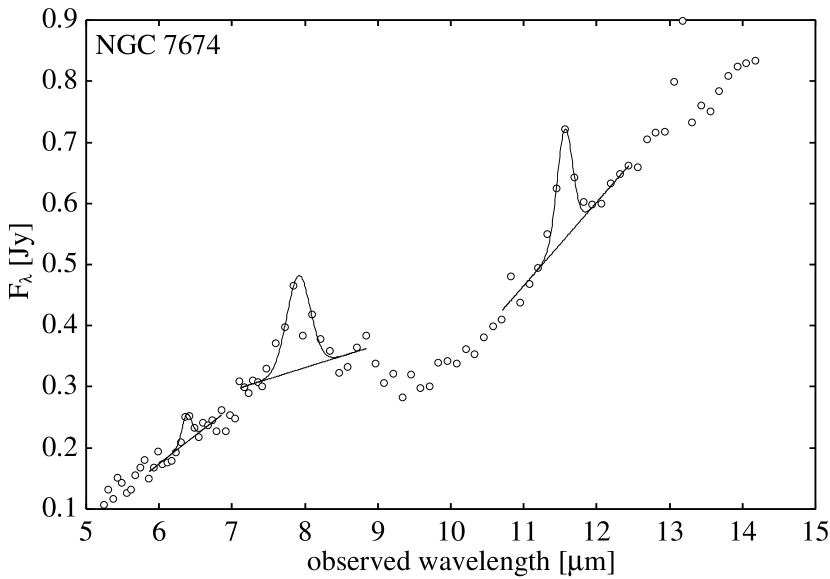
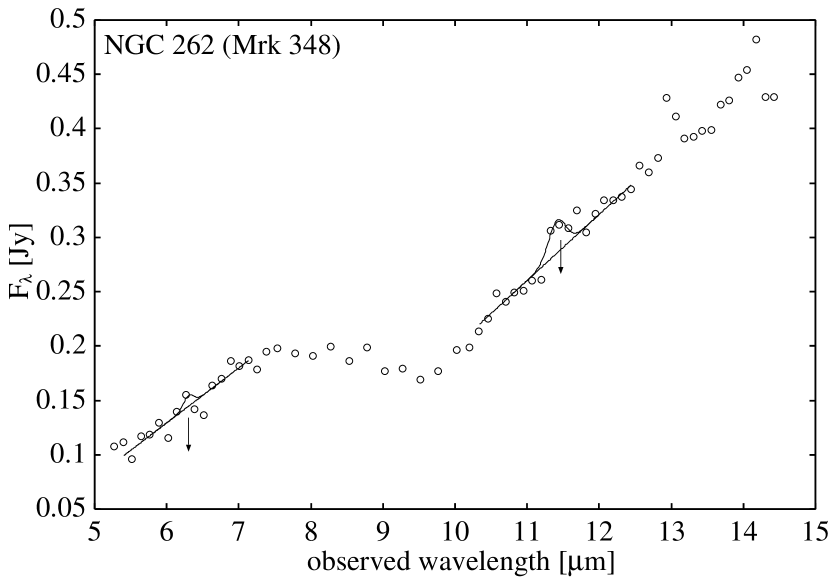
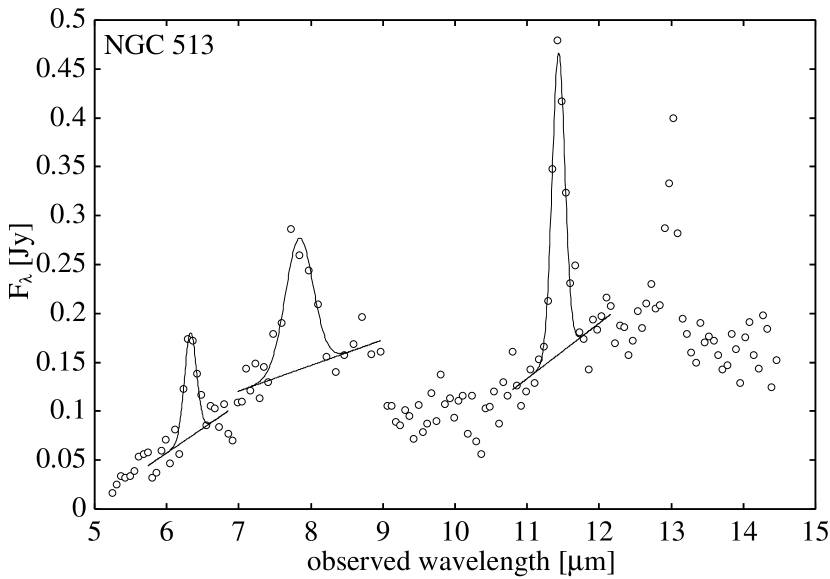
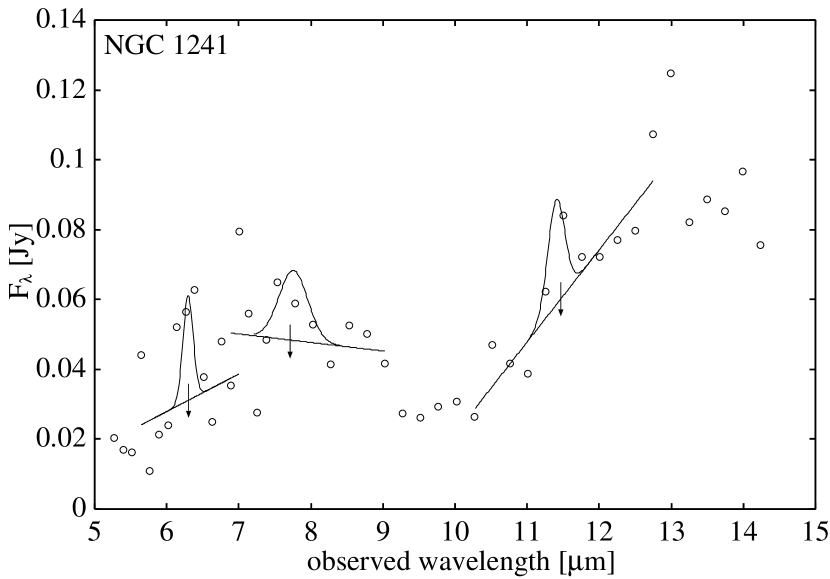
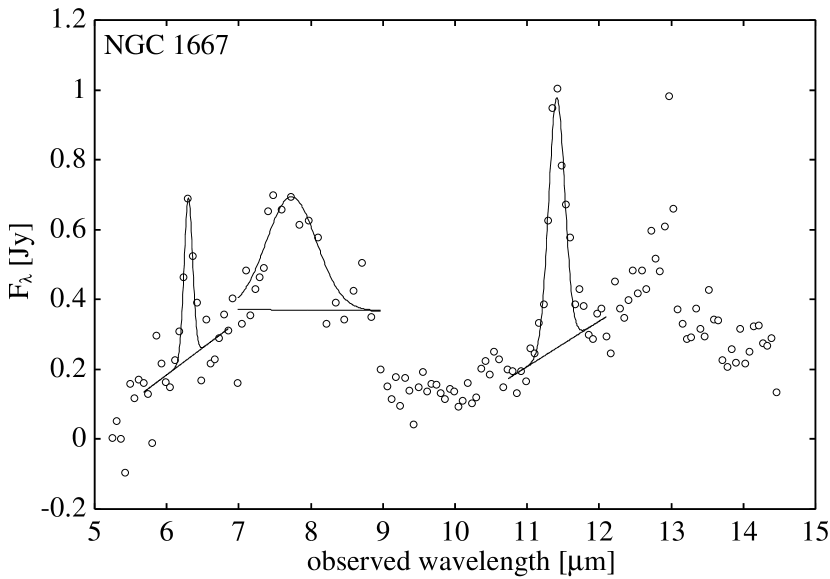
Figure 3 and 4 represent 5.2-14.5 m spectra of Seyfert 1 and 2 galaxies, respectively. Most of the Seyfert galaxies in Figure 3 and 4 show clearly detectable PAH emission features at , , and .
To estimate the fluxes of the PAH emission features at = 6.2 m, 7.7 m, and 11.3 m, we adopted a linear continuum determined from data points at the shorter and longer wavelength sides of individual PAH features, as used by Imanishi et al. (2007). The adopted continuum levels are shown as solid straight lines in Fig. 3 and 4. We fitted the PAH emission features with Gaussian profiles, which reproduced the observed data reasonably well. We treated the weak (lower than 3 ) or undetected PAH emission as the upper limit or non-flux, respectively.
By using 3.3 m, 6.2 m, and 11.3 m PAH luminosities, we can roughly estimate infrared luminosities of the nuclear starburst and total starburst. In Table 4, we showed infrared luminosities of the nuclear starburst estimated from the 3.3 m PAH luminosity; (Mouri et al., 1990; Imanishi, 2002) and the total starburst estimated from the 6.2 m and 11.3 m PAH luminosity; (Peeters et al., 2004) and (Soifer et al., 2002), respectively. Infrared luminosities of the total starbursts are several times or more as large as those of nuclear starbursts. This means that the circumnuclear starbursts dominate the total starburst luminosity. Thus, we can consider the 6.2 m, 7.7 m, and 11.3 m PAH emission, which were observed in the whole host galaxy regions, as good indicators of a circumnuclear starburst.
4.3 Luminosity Correlation between Nuclear/Circumnuclear Starburst and AGN
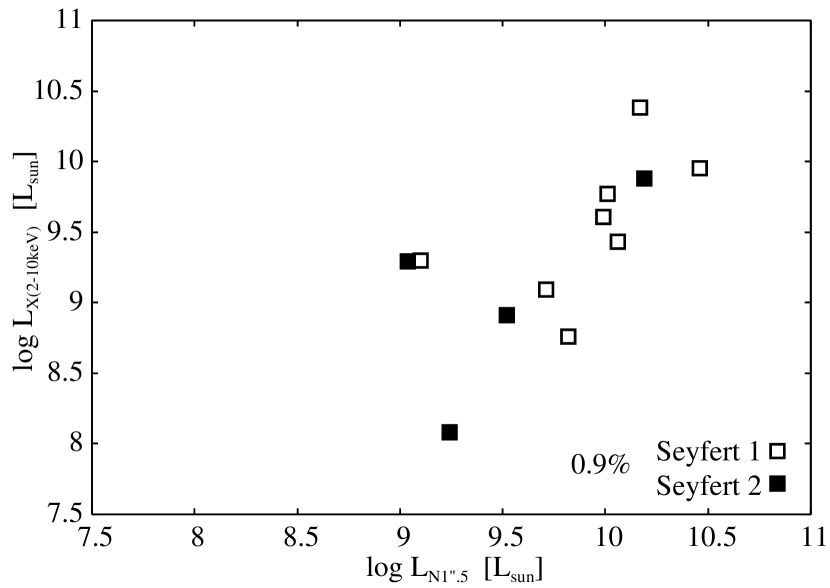
In Figure 5, we checked a correlation between the nuclear N-band luminosity and the hard X-ray luminosity. We applied the generalized Kendall rank correlation statistics (Isobe et al., 1986) provided in the Astronomy Survival Analysis package (ASURV; Feigelson & Nelson, 1985; Isobe et al., 1986) to both types of Seyfert galaxies. The probability that a correlation is not present was 0.9 % (2.6 ). Since these hard X-ray luminosity are the absorption-corrected luminosity and estimated for the Compton-thin AGN, this correlation means that the nuclear N-band luminosity is good indicator of AGN activity for these Seyfert galaxies samples.
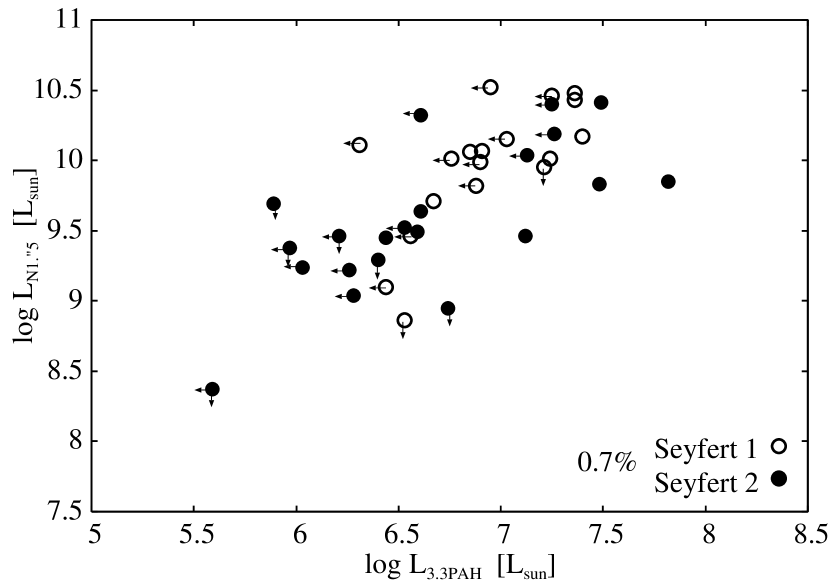
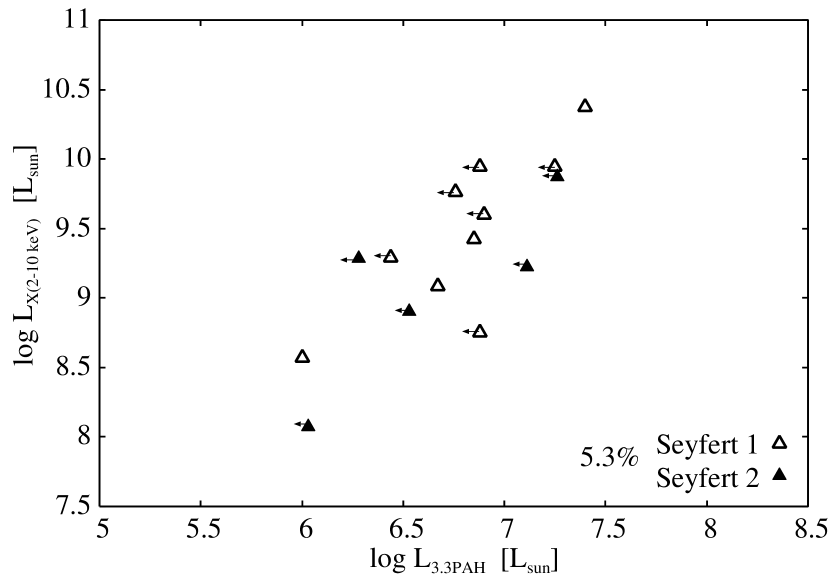
In Figure 6, we plotted the nuclear N-band luminosity and the hard X-ray luminosity versus the 3.3 m PAH emission luminosity. The probability that a correlation is not present was 0.7 % (2.7 ) and 5.3 % (1.9 ) for the nuclear N-band luminosity and the hard X-ray luminosity, respectively. Imanishi & Wada (2004) shows the positive correlation between the 3.3 m luminosity and the nuclear N-band luminosity. We also obtained the same results for the hard X-ray luminosity. Thus, the correlation between the luminosity of the nuclear starbursts and central AGN is also statistically confirmed in Seyfert galaxies in hard X-ray luminosity, which is directly involved in AGN activity. These nuclear N-band and hard X-ray results definitely show that nuclear starburst luminosity is positively correlated with AGN power.
For hard X-ray luminosity - 3.3 m PAH luminosity correlation, the correlation probability here is lower than that of the nuclear N-band luminosity. This difference may result from a large number of upper/lower limit data and few sample data. To analyze hard X-ray data in detail, we may need to eliminate these uncertainties and collect more data. We therefore focus on only the nuclear N-band luminosity for the following results.
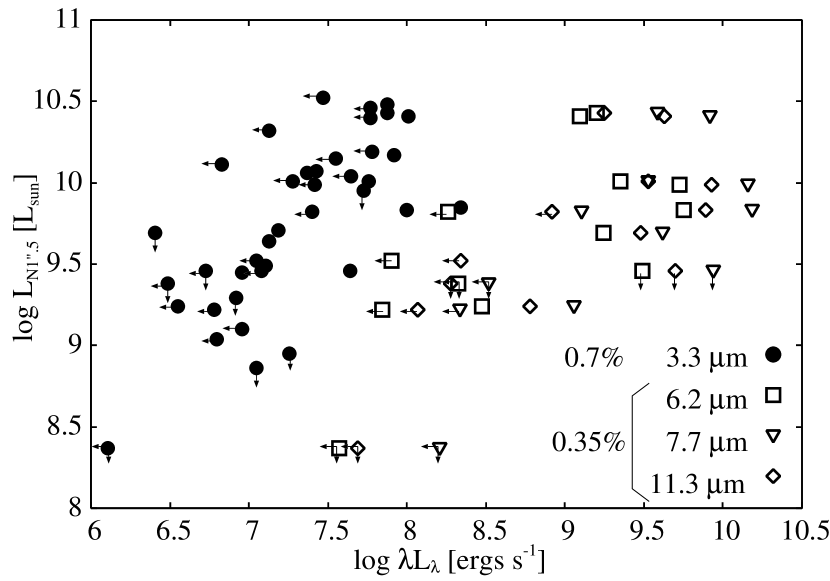
In Figure 7, we plotted the nuclear N-band luminosity versus the energy for 6.2 m, 7.7 m, and 11.3 m PAH emission. Here, we considered the 6.2 m, 7.7 m, and 11.3 m PAH emission and plotted their energies. Since these PAH emission cover the whole host galaxy, we can consider them as indicators of circumnuclear starbursts. We also plotted the energy for the 3.3 m PAH emission in Fig. 7 and applied the generalized Kendall rank correlation statistics to these 6.2 m, 7.7 m, and 11.3 m PAH emission simultaneously. The probability that a correlation is not present was found to be 0.35 % (2.9 ) for these PAH emission. Thus, not only nuclear starburst luminosity but also circumnuclear starburst luminosity are connected to AGN luminosity.
4.4 AGN Mass Accretion and Star-Forming Activity
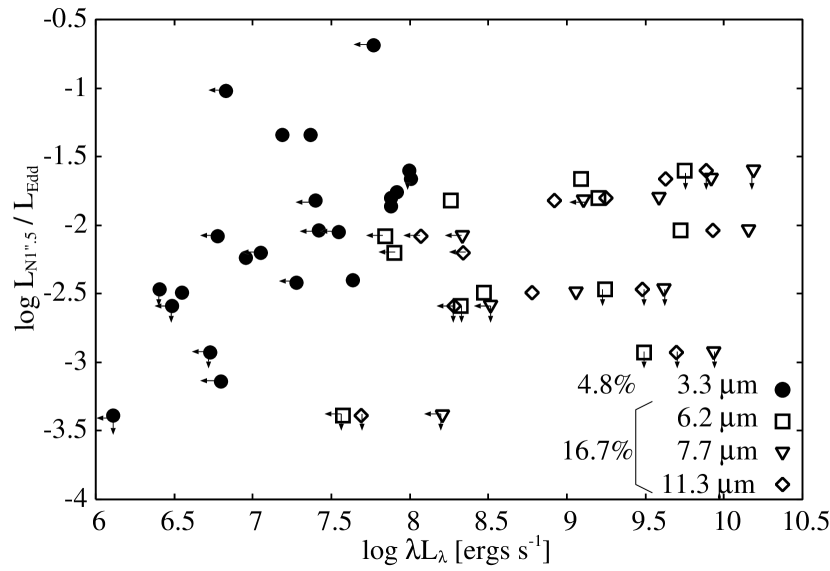
In Figure 8, we also plotted the ratio of the nuclear N-band luminosity to the AGN Eddington luminosity, versus the energy of the nuclear/circumnuclear starbursts. The probability that a correlation is not present was found to be 4.8 % (2.0 ) for the nuclear starbursts (3.3 m PAH emission) and 16.7 % (1.4 ) for the circumnuclear starbursts (the other PAH emission). Thus, we statistically confirmed that the nuclear starburst is also positively correlated with the AGN luminosity normalized with the Eddington luminosity, whereas the circumnuclear starburst is only weakly correlated.
Here PAH emission are associated with star formation, and so the horizontal axis is also interpreted as an indicator of star-forming activity. The vertical axis also represents the mass accretion rate normalized with the Eddington mass accretion rate. This ratio corresponds to the efficiency of gas accretion onto a given SMBH mass. Thus, these results could be interpreted as the relationship between the efficiency of gas accretion onto a given SMBH mass and the star-forming activity around the AGN. Our results show a close correlation between the star-forming activity that is nearer the AGN and the efficiency of gas accretion. Therefore, starbursts near the AGN could affect AGN mass accretion more effectively.
5 Discussion: Link between AGN Mass Accretion and Nuclear/Circumnuclear Starbursts
We found that nuclear and circumnuclear starburst luminosities are positively correlated with AGN luminosity. However, nuclear starburst luminosity compared to circumnuclear luminosity is correlated with AGN mass accretion more strongly. These results imply that the AGN mass accretion could be connected the star formation activity around AGN. Therefore, here, we discuss the interpretation of our results focusing on the effect of star formation activities.
Umemura et al. (1997, 1998) showed the mass accretion onto the galactic center by the radiation effect from a circumnuclear starburst. They assumed a circumnuclear starburst ring and a gas disk within starburst ring.
Through radial radiation pressure from the circumnuclear starburst, the optically thin surface layer of the gas disk (or the whole of the optically thin disk) is made to contract. Then the surface layer sheds angular momentum due to radiation drag. Also, since the radiation drag timescale for the dusty gas has been estimated a few yr and the radial radiation pressure can influence at shorter timescale further (Umemura et al. 1998), due to these mechanisms, luminous starbursts could carry a larger amount of gas toward the inner region within the duration of the starburst phase; yr (e.g., Efstathiou et al., 2000) and the typical age for AGNs; yr (basically the Eddington timescale).
Radial radiation pressure may induce star formation as well as contraction of the gas disk shock (Umemura et al., 1998). The superbubble driven by sequential explosions of supernovae in an OB association located in the plane-stratified gas distribution may also compress the surrounding gas due to shock (Shapiro & Field, 1976; Tomisaka & Ikeuchi, 1986; Norman & Ikeuchi, 1989) and new stars may be born there. In fact, Matsushita et al. (2005) showed the clear evidence of such a self-induced starburst at the inner edge of the expanding molecular superbubble in M82. This effect is even more expected in the case of a luminous starburst. If star formation is initiated in the contracted gas, it may induce further radiation effects and/or a superbubble in the inner gas disk. If the starbursts occur in such a sequential manner, the gas is carried farther into the inner region, and sequential starbursts may produce nuclear starbursts with some time lag (e.g., the timescale of the radiation pressure and radiation drag and/or the expansion time of the superbubble).
Also, Fukuda et al. (2000) showed that the gas ring in a barred galaxy could be unstable to gravitational instability and fragment into gas clumps. These clumps fall to the center by the torque from the massive clumps and/or by the dynamical friction from the stellar component (Makino, 1997). Such dynamical effects could be also related to the gas accretion toward the center and produce nuclear starbursts.
Although the nuclear starburst is hidden by dusty gas, the structure is expected to be clumpy (Wada & Norman, 2002). In this case, not only the chaotic disturbance of the gas but also the radiation drag from the nuclear starburst may be able to reduce the angular momentum of the clumpy gas (Kawakatu & Umemura, 2002). Therefore, this innermost starburst could be directly related to the AGN mass accretion.
6 CONCLUSION
To determine whether the starbursts influence AGN activities, we investigated the correlation between nuclear/circumnuclear starbursts and AGN activities. We found that circumnuclear starburst luminosity as well as the nuclear starburst luminosity is positively correlated with AGN luminosity. Moreover, nuclear starburst is also positively correlated with the AGN luminosity normalized with the AGN Eddington luminosity, whereas the circumnuclear starburst is only weakly correlated. This implies that close connections exist between starbursts nearer the AGN and AGN mass accretion.
Appendix
The infrared 3–4 m spectra of the eight Seyfert galaxies were taken using IRTF SpeX (Rayner et al., 2003). The 1.9–4.2 m cross-dispersed mode with a 08 wide slit was employed. This mode enables - (2.8–4.1 m) and -band (2–2.5 m) spectra to be obtained simultaneously, with a spectral resolution of R 1000. The sky conditions were photometric throughout the observations, and the seeing at was measured to be in the range 035–045 FWHM. A standard telescope nodding technique (ABBA pattern) with a throw of 75 was employed along the slit. The telescope tracking was monitored with the infrared slit-viewer of SpeX. Each exposure was 15 sec, and 2 coadds were made at each position.
F- or G-type main sequence stars (Table 1) were observed as standard stars, with mean airmass difference of 0.1 to the individual Seyfert nuclei, to correct for the transmission of the Earth’s atmosphere and to provide flux calibration. The -band magnitudes of the standard stars were estimated from their -band ( 0.6 m) magnitudes, adopting the colors appropriate to the stellar types of individual standard stars (Tokunaga, 2000).
Standard data analysis procedures were employed, using IRAF 111 IRAF is distributed by the National Optical Astronomy Observatories, which are operated by the Association of Universities for Research in Astronomy, Inc. (AURA), under cooperative agreement with the National Science Foundation.. Initially, frames taken with an A (or B) beam were subtracted from frames subsequently taken with a B (or A) beam, and the resulting subtracted frames were added and divided by a spectroscopic flat image. Then, bad pixels and pixels hit by cosmic rays were replaced with the interpolated values of the surrounding pixels. Finally the spectra of Seyfert nuclei and standard stars were extracted, by integrating signals over 18–22, depending on actual signal profiles. Wavelength calibration was performed taking into account the wavelength-dependent transmission of the Earth’s atmosphere. The spectra of Seyfert nuclei were divided by the observed spectra of standard stars, multiplied by the spectra of blackbodies with temperatures appropriate to individual standard stars (Table 1). Flux calibration was done based on signals of Seyfert galaxies and standard stars detected inside our slit spectra. To reduce the scatter of data points, appropriate spectral binning is employed, depending on the continuum flux levels of final spectra.
References
- Barnes & Hernquist (1991) Barnes, J. E., & Hernquist, L. E. 1991, ApJ, 370, L65
- Barnes & Hernquist (1992) Barnes, J. E., & Hernquist, L. 1992, ARA&A, 30, 705
- Barth et al. (1995) Barth, A. J., Ho, L. C., Filippenko, A. V., & Sargent, W. L. 1995, AJ, 110, 1009
- Benedict et al. (1996) Benedict, G. F., Smith, B. J., & Kenney, J. D. P. 1996, AJ, 112, 1318
- Bian & Gu (2007) Bian, W., & Gu, Q. 2007, ApJ, 657, 159
- Buta et al. (1995) Buta, R., Purcell, G. B., & Crocker, D. A. 1995, AJ, 110, 1588
- Davies et al. (2007) Davies, R., Mueller Sanchez, F., Genzel, R., Tacconi, L., Hicks, E, Friedrich, S, & Sternberg, A. 2007, ArXiv e-prints, 704, arXiv:0704.1374
- Efstathiou et al. (2000) Efstathiou, A., Rowan-Robinson, M., & Siebenmorgen, R. 2000, MNRAS, 313, 734
- Elmouttie et al. (1998) Elmouttie, M., Koribalski, B., Gordon, S., Taylor, K., Houghton, S., Lavezzi, T., Haynes, R., & Jones, K. 1998, MNRAS, 297, 49
- Feigelson & Nelson (1985) Feigelson, E. D., & Nelson, P. I. 1985, ApJ, 293, 192
- Forbes et al. (1994) Forbes, D. A., Norris, R. P., Williger, G. M., & Smith, R. C. 1994, AJ, 107, 984
- Fukuda et al. (2000) Fukuda, H., Habe, A., & Wada, K. 2000, ApJ, 529, 109
- Fukuda et al. (1998) Fukuda, H., Wada, K., & Habe, A. 1998, MNRAS, 295, 463
- Fukue et al. (1997) Fukue, J., Umemura, M., & Mineshige, S. 1997, PASJ, 49, 673
- Gorjian et al. (2004) Gorjian, V., Werner, M. W., Jarrett, T. H., Cole, D. M., & Ressler, M. E. 2004, ApJ, 605, 156
- Hernquist (1989) Hernquist, L. 1989, Nature, 340, 687
- Houck et al. (2004) Houck, J. R., et al. 2004, ApJS, 154, 18
- Huchra & Burg (1992) Huchra, J., & Burg, R. 1992, ApJ, 393, 90
- Imanishi (2002) Imanishi, M. 2002, ApJ, 569, 44
- Imanishi (2003) Imanishi, M. 2003, ApJ, 599, 918
- Imanishi & Alonso-Herrero (2004) Imanishi, M., & Alonso-Herrero, A. 2004, ApJ, 614, 122
- Imanishi et al. (2006) Imanishi, M., Dudley, C. C., & Maloney, P. R. 2006, ApJ, 637, 114
- Imanishi & Wada (2004) Imanishi, M., & Wada, K. 2004, ApJ, 617, 214
- Imanishi et al. (2007) Imanishi, M., Dudley, C. C., Maiolino, R., Maloney, P. R., Nakagawa, T., & Risaliti, G. 2007, ApJS, 171, 72
- Isobe et al. (1986) Isobe, T., Feigelson, E. D., & Nelson, P. I. 1986, ApJ, 306, 490
- Kaspi et al. (2000) Kaspi, S., Smith, P. S., Netzer, H., Maoz, D., Jannuzi, B. T., & Giveon, U. 2000, ApJ, 533, 631
- Kawakatu & Umemura (2002) Kawakatu, N., & Umemura, M. 2002, MNRAS, 329, 572
- Kawakatu et al. (2007) Kawakatu, N., Imanishi, M., & Nagao, T. 2007, ApJ, 661, 660
- Knapen et al. (1995) Knapen, J. H., Beckman, J. E., Heller, C. H., Shlosman, I., & de Jong, R. S. 1995, ApJ, 454, 623
- Knapen et al. (2002) Knapen, J. H., Pérez-Ramírez, D., & Laine, S. 2002, MNRAS, 337, 808
- Knapen (2005) Knapen, J. H. 2005, A&A, 429, 141
- Leitherer et al. (1996) Leitherer, C., Vacca, W. D., Conti, P. S., Filippenko, A. V., Robert, C., & Sargent, W. L. W. 1996, ApJ, 465, 717
- Lutz et al. (1996) Lutz, D., et al. 1996, A&A, 315, L269
- Maciejewski et al. (2002) Maciejewski, W., Teuben, P. J., Sparke, L. S., & Stone, J. M. 2002, MNRAS, 329, 502
- Makino (1997) Makino, J. 1997, ApJ, 478, 58
- Maoz et al. (1996) Maoz, D., Barth, A. J., Sternberg, A., Filippenko, A. V., Ho, L. C., Macchetto, F. D., Rix, H.-W., & Schneider, D. P. 1996, AJ, 111, 2248
- Marconi et al. (1994) Marconi, A., Moorwood, A. F. M., Origlia, L., & Oliva, E. 1994, The Messenger, 78, 20
- Matsushita et al. (2005) Matsushita, S., Kawabe, R., Kohno, K., Matsumoto, H., Tsuru, T. G., & Vila-Vilaró, B. 2005, ApJ, 618, 712
- Mauder et al. (1994) Mauder, W., Weigelt, G., Appenzeller, I., & Wagner, S. J. 1994, A&A, 285, 44
- Mihos & Hernquist (1996) Mihos, J. C., & Hernquist, L. 1996, ApJ, 464, 641
- Montenegro et al. (1999) Montenegro, L. E., Yuan, C., & Elmegreen, B. G. 1999, ApJ, 520, 592
- Mouri et al. (1990) Mouri, H., Kawara, K., Taniguchi, Y., & Nishida, M. 1990, ApJ, 356, L39
- Noguchi (1988) Noguchi, M. 1988, A&A, 203, 259
- Norman & Ikeuchi (1989) Norman, C. A., & Ikeuchi, S. 1989, ApJ, 345, 372
- Ohsuga & Umemura (1999) Ohsuga, K., & Umemura, M. 1999, ApJ, 521, L13
- Ohsuga et al. (1999) Ohsuga, K., Umemura, M., Fukue, J., & Mineshige, S. 1999, PASJ, 51, 345
- Ohsuga & Umemura (2001) Ohsuga, K., & Umemura, M. 2001, ApJ, 559, 157
- O’Neill et al. (2005) O’Neill, P. M., Nandra, K., Papadakis, I. E., & Turner, T. J. 2005, MNRAS, 358, 1405
- Onodera et al. (2004) Onodera, S., Koda, J., Sofue, Y., & Kohno, K. 2004, PASJ, 56, 439
- Panessa & Bassani (2002) Panessa, F., & Bassani, L. 2002, A&A, 394, 435
- Panessa et al. (2006) Panessa, F., Bassani, L., Cappi, M., Dadina, M., Barcons, X., Carrera, F. J., Ho, L. C., & Iwasawa, K. 2006, A&A, 455, 173
- Peeters et al. (2004) Peeters, E., Spoon, H. W. W., & Tielens, A. G. G. M. 2004, ApJ, 613, 986
- Peterson & Wandel (1999) Peterson, B. M., & Wandel, A. 1999, ApJ, 521, L95
- Pogge (1989) Pogge, R. W. 1989, ApJ, 345, 730
- Rayner et al. (2003) Rayner, J. T., Toomey, D. W., Onaka, P. M., Denault, A. J., Stahlberger, W. E., Vacca, W. D., Cushing, M. C., & Wang, S. 2003, PASP, 115, 362
- Rieke & Lebofsky (1985) Rieke, G. H., & Lebofsky, M. J. 1985, ApJ, 288, 618
- Rodríguez-Ardila & Viegas (2003) Rodríguez-Ardila, A., & Viegas, S. M. 2003, MNRAS, 340, L33
- Rush et al. (1993) Rush, B., Malkan, M. A., & Spinoglio, L. 1993, ApJS, 89, 1
- Saitoh & Wada (2004) Saitoh, T. R., & Wada, K. 2004, ApJ, 615, L93
- Shapiro & Field (1976) Shapiro, P. R., & Field, G. B. 1976, ApJ, 205, 762
- Shinozaki et al. (2006) Shinozaki, K., Miyaji, T., Ishisaki, Y., Ueda, Y., & Ogasaka, Y. 2006, AJ, 131, 2843
- Shlosman et al. (1990) Shlosman, I., Begelman, M. C., & Frank, J. 1990, Nature, 345, 679
- Siebenmorgen et al. (2004) Siebenmorgen, R., Krügel, E., & Spoon, H. W. W. 2004, A&A, 414, 123
- Soifer et al. (2002) Soifer, B. T., Neugebauer, G., Matthews, K., Egami, E., & Weinberger, A. J. 2002, AJ, 124, 2980
- Storchi-Bergmann et al. (1996) Storchi-Bergmann, T., Wilson, A. S., & Baldwin, J. A. 1996, ApJ, 460, 252
- Taniguchi (1999) Taniguchi, Y. 1999, ApJ, 524, 65
- Thompson et al. (2005) Thompson, T. A., Quataert, E., & Murray, N. 2005, ApJ, 630, 167
- Tokunaga (2000) Tokunaga, A. T. 2000, in Allen’s Astrophysical Quantities, ed. A. N. Cox (4th ed; Berlin: Springer), 143
- Tokunaga et al. (1991) Tokunaga A. T., Sellgren K., Smith R. G., Nagata T., Sakata A., Nakada Y., 1991, ApJ, 380, 452
- Tomisaka & Ikeuchi (1986) Tomisaka, K., & Ikeuchi, S. 1986, PASJ, 38, 697
- Toomre (1964) Toomre, A. 1964, ApJ, 139, 1217
- Tremaine et al. (2002) Tremaine, S., et al. 2002, ApJ, 574, 740
- Turner et al. (1997) Turner, T. J., George, I. M., Nandra, K., & Mushotzky, R. F. 1997, ApJS, 113, 23
- Umemura et al. (1997) Umemura, M., Fukue, J., & Mineshige, S. 1997, ApJ, 479, L97
- Umemura et al. (1998) Umemura, M., Fukue, J., & Mineshige, S. 1998, MNRAS, 299, 1123
- Voit (1992) Voit, G. M. 1992, MNRAS, 258, 841
- Wada et al. (2002) Wada, K., Meurer, G., & Norman, C. A. 2002, ApJ, 577, 197
- Wada & Norman (1999) Wada, K., & Norman, C. A. 1999, ApJ, 516, L13
- Wada & Norman (2001) Wada, K., & Norman, C. A. 2001, ApJ, 547, 172
- Wada & Norman (2002) Wada, K., & Norman, C. A. 2002, ApJ, 566, L21
- Watabe & Umemura (2005) Watabe, Y., & Umemura, M. 2005, ApJ, 618, 649
- Werner et al. (2004) Werner, M. W., et al. 2004, ApJS, 154, 1
- Wilson et al. (1991) Wilson, A. S., Helfer, T. T., Haniff, C. A., & Ward, M. J. 1991, ApJ, 381, 79
| Object | Date | Telescope | Integration | P.A. | Standard Stars | Remark | |||
|---|---|---|---|---|---|---|---|---|---|
| (UT) | Instrument | (Min) | (∘) | Name | -mag | Type | (K) | ||
| (1) | (2) | (3) | (4) | (5) | (6) | (7) | (8) | (9) | (10) |
| NGC 931 (Mrk 1040) | 2007 August 26 | IRTF SpeX | 96 | 0 | HR 720 | 4.4 | G0V | 5930 | 12m Sy 1 |
| F03450+0055 | 2007 August 28 | IRTF SpeX | 112 | 0 | HR 962 | 3.7 | F8V | 6000 | 12m Sy 1 |
| NGC 262 | 2007 August 31 | IRTF SpeX | 80 | 0 | HR 410 | 5.0 | F7V | 6240 | 12m Sy 2 |
| NGC 513 | 2007 August 27 | IRTF SpeX | 120 | 0 | HR 410 | 5.0 | F7V | 6240 | 12m Sy 2 |
| MCG-2-8-39 | 2007 August 30 | IRTF SpeX | 136 | 0 | HR 784 | 4.5 | F6V | 6400 | 12m Sy 2 |
| MCG-3-58-7 | 2007 August 30 | IRTF SpeX | 80 | 0 | HR 8457 | 4.8 | F6V | 6400 | 12m Sy 2 |
| Mrk 993 | 2007 August 31 | IRTF SpeX | 112 | 0 | HR 410 | 5.0 | F7V | 6240 | CfA Sy 2 |
| 0152+06 (UGC 1395) | 2007 August 29 | IRTF SpeX | 120 | 0 | HR 508 | 4.7 | G3V | 5800 | CfA Sy 2 |
Note. — Column (1): Object. Col. (2): Observing date in UT. Col. (3): Telescope and instrument. Col. (4): Net on-source integration time in min. Col. (5): Position angle of the slit. 0∘ corresponds to the north-south direction. Col. (6): Standard star name. Col. (7): Adopted -band magnitude. Col. (8): Stellar spectral type. Col. (9): Effective temperature. Col. (10): Seyfert 1 or 2 galaxy in the 12 m or CfA sample.
| Object | rest EW3.3PAH | ||
|---|---|---|---|
| ( 10-14 ergs s-1 cm-2) | ( 1040 ergs s-1) | (nm) | |
| (1) | (2) | (3) | (4) |
| NGC 931 | 6.5 | 2.9 | 2.5 |
| F03450+0055 | 1.8 | 3.1 | 1.0 |
| NGC 262 | 3.3 | 1.3 | 1.6 |
| NGC 513 | 0.5 | 0.3 | 3.5 |
| MCG-2-8-39 | 1.3 | 2.0 | 13 |
| MCG-3-58-7 | 1.8 | 3.3 | 1.1 |
| Mrk 993 | 2.2 | 0.9 | 16 |
| 0152+06 | 1.6 | 0.8 | 13 |
Note. — Column (1): Object. Col. (2): Observed nuclear 3.3 m PAH flux. Col. (3): Observed nuclear 3.3 m PAH luminosity. Col. (4): Rest frame equivalent width of the 3.3 m PAH emission.
| Object | references | |||||||||
|---|---|---|---|---|---|---|---|---|---|---|
| (1) | (2) | (3) | (4) | (5) | (6) | (7) | (8) | (9) | (10) | (11) |
| Seyfert 1 (CfA Sample) | ||||||||||
| Mrk 335 | 0.025 | 6.85 | ? | ? | ? | 10.06 | 6.89 | 9.43 | 1 | |
| NGC 863 (Mrk 590) | 0.027 | 6.88 | — | — | — | — | 7.58 | — | 9.95 | 2 |
| NGC 3786 (Mrk 744) | 0.009 | 6.36 | — | — | — | — | 7.53 | — | — | — |
| NGC 4235 | 0.008 | 6.00 | — | — | — | — | — | — | 8.58 | 3 |
| NGC 4253 (Mrk 766) | 0.013 | 6.67 | — | — | — | 9.71 | 6.54 | 9.09 | 1 | |
| NGC 5548 | 0.017 | 6.76 | — | — | — | 10.01 | 7.92 | 9.77 | 1 | |
| Mrk 817 | 0.031 | 7.36 | 8.41 | 8.7 | 8.2 | 10.43 | 7.72 | — | — | |
| NGC 7469 | 0.016 | 6.9 | 8.93 | 9.27 | 8.88 | 9.99 | 7.52 | 9.61 | 1 | |
| Mrk 530 (NGC 7603) | 0.029 | 7.24 | 8.56 | 8.64 | 8.48 | 10.01 | — | — | — | — |
| Seyfert 1 (12 Sample) | ||||||||||
| NGC 931 (Mrk 1040) | 0.016 | 6.88† | 7.47 | 8.22 | 7.87 | 9.82 | 7.13 | 8.76 | 1 | |
| F03450+0055 | 0.031 | 6.91† | ? | ? | ? | 10.07 | — | — | — | — |
| 3C 120 | 0.033 | 7.4 | — | — | — | 10.17 | 7.41 | 10.38 | 2 | |
| Mrk 618 | 0.035 | 7.21 | — | — | — | 9.95 | — | — | — | — |
| MCG -5-13-17 | 0.013 | 6.56 | — | — | — | 9.46 | — | — | — | — |
| Mrk 79 | 0.022 | 7.03 | ? | ? | ? | 10.15 | 7.68 | — | — | |
| Mrk 704 | 0.030 | 6.95 | — | — | — | 10.52 | — | — | — | — |
| NGC 2992 | 0.008 | 6.44 | — | — | — | 9.10 | — | — | 9.30 | 2 |
| Mrk 1239 | 0.019 | 6.31 | — | — | — | 10.11 | 6.62 | — | — | |
| MCG -2-33-34 | 0.014 | 6.53 | — | — | — | 8.86 | — | — | — | — |
| IC 4329A | 0.016 | 7.25 | ? | ? | ? | 10.46 | 6.64 | 9.95 | 1 | |
| Mrk 509 | 0.036 | 7.36 | — | — | — | 10.48 | 7.83 | — | — | |
| Seyfert 2 (CfA Sample) | ||||||||||
| NGC 4388 | 0.008 | 6.03 | 7.68 | 8.17 | 7.73 | 9.24 | 7.22 | 8.08 | 3 | |
| NGC 5252 | 0.023 | 7.11 | — | — | — | — | — | — | 9.23 | 4 |
| NGC 5256 (Mrk 266SW) | 0.028 | 7.48 | 8.96 | 9.30 | 8.84 | 9.83 | 6.92 | — | — | |
| NGC 5347 | 0.008 | 6.26 | 7.05 | 7.45 | 7.02 | 9.22 | 6.79 | — | — | |
| NGC 5929 | 0.008 | 5.59 | 6.78 | 7.32 | 6.64 | 8.37 | 7.25 | — | — | |
| NGC 7674 | 0.029 | 7.49 | 8.30 | 9.03 | 8.58 | 10.41 | 7.56 | — | — | |
| Seyfert 2 (12 Sample) | ||||||||||
| Mrk 938 | 0.019 | 7.82 | — | — | — | 9.85 | — | — | — | — |
| NGC 262 (Mrk 348) | 0.015 | 6.53† | 7.11 | ? | 7.29 | 9.52 | 7.21 | 8.91 | 5 | |
| NGC 513 | 0.020 | 5.89† | 8.45 | 8.73 | 8.43 | 9.69 | 7.65 | — | — | |
| NGC 1125 | 0.011 | 6.74 | — | — | — | 8.95 | — | — | — | — |
| NGC 1241 | 0.014 | 5.97 | 7.53 | 7.63 | 7.23 | 9.38 | 7.46 | — | — | |
| NGC 1320 (Mrk 607) | 0.010 | 6.44 | — | — | — | 9.45 | 7.18 | — | — | |
| F04385-0820 | 0.015 | 6.61 | — | — | — | 9.64 | — | — | — | — |
| NGC 1667 | 0.015 | 6.21 | 8.7 | 9.05 | 8.65 | 9.46 | 7.88 | — | — | |
| NGC 3660 | 0.012 | 6.4 | — | — | — | 9.29 | — | — | — | — |
| NGC 4968 | 0.010 | 6.59 | — | — | — | 9.49 | — | — | — | — |
| MCG -3-34-64 | 0.017 | 6.61 | — | — | — | 10.32 | — | — | — | — |
| NGC 5135 | 0.014 | 7.12 | — | — | — | 9.46 | 7.35 | — | — | |
| MCG -2-40-4 (NGC 5995) | 0.024 | 7.26 | — | — | — | 10.19 | — | — | 9.88 | 5 |
| F15480-0344 | 0.030 | 7.13 | — | — | — | 10.04 | — | — | — | — |
| NGC 7172 | 0.009 | 6.28 | — | — | — | 9.04 | 7.67 | 9.29 | 2 | |
| MCG -3-58-7 | 0.032 | 7.25 | — | — | — | 10.40 | — | — | — | — |
Note. — Column (1): Object. Col. (2): Redshift. Col. (3): PAH luminosity at 3.3 m. † Taken from this paper. Col. (7): , and are the PAH luminosity at 6.2 m, 7.7 m, 11.2 m, and the nuclear N-band , respectively. Col. (8): Black hole mass. Col. (9): Ratio of nuclear N-band luminosity to AGN Eddington luminosity. Col. (10) and (11): Absorption-corrected hard (2-10 keV) X-ray luminosity and corresponding references; 1, O’Neill et al. (2005); 2, Shinozaki et al. (2006); 3, Panessa et al. (2006); 4, Turner et al. (1997); 5, Panessa & Bassani (2002). ”—” shows no information. ”?” means undetected PAH emission.
| Object | |||||
|---|---|---|---|---|---|
| () | () | () | |||
| (1) | (2) | (3) | (4) | (5) | (6) |
| Mrk 817 | 10.36 | 10.88 | 11.05 | 3.30 | 4.94 |
| NGC 7469 | 11.40 | 11.73 | |||
| Mrk 530 (NGC 7603) | 10.24 | 11.03 | 11.33 | 6.14 | 12.41 |
| NGC 931 (Mrk 1040) | 10.72 | — | |||
| NGC 4388 | 10.15 | 10.58 | |||
| NGC 5256 (Mrk 266SW) | 10.48 | 11.43 | 11.69 | 8.88 | 16.36 |
| NGC 5347 | — | — | |||
| NGC 5929 | — | — | |||
| NGC 7674 | 10.49 | 10.77 | 11.43 | 1.90 | 8.79 |
| NGC 262 (Mrk 348) | — | — | |||
| NGC 513 | 8.89 | 10.92 | 11.28 | 106.79 | 247.67 |
| NGC 1241 | — | — | |||
| NGC 1667 | 11.17 | 11.50 |
Note. — Column (1): Object. Column (2): Infrared luminosity of the nuclear starburst. (Mouri et al., 1990; Imanishi, 2002). Col. (3) and (4): (Peeters et al., 2004) and (Soifer et al., 2002) are the infrared luminosity of total starbursts, which were estimated from 6.2 m and 11.3 m PAH luminosity, respectivery. Col. (5) and (6): Infrared luminosity Ratios of total starburst to nuclear starburst. ”—” shows that both the infrared luminosity of the nuclear starburst and the total starburst are upper limit data.