Dynamics of shock propagation and nucleosynthesis conditions in O-Ne-Mg core supernovae
It has been recently proposed that the shocked surface layers of exploding O-Ne-Mg cores provide the conditions for r-process nucleosynthesis, because their rapid expansion and high entropies enable heavy r-process isotopes to form even in an environment with very low initial neutron excess of the matter. We show here that the most sophisticated available hydrodynamic simulations (in spherical and axial symmetry) do not support this new r-process scenario because they fail to provide the necessary conditions of temperature, entropy, and expansion timescale by significant factors. This suggests that, either the formation of r-process elements works differently than suggested by Ning et al. (2007, NQM07), or that some essential core properties with influence on the explosion dynamics might be different from those predicted by Nomoto’s progenitor model.
Key Words.:
supernovae: general – hydrodynamics – nuclear reactions, nucleosynthesis, abundances1 Introduction
The site(s) of the production of the r-process elements are still a mystery. It has been long speculated that supernova explosions of progenitor stars in the 811 range play a role in this context, in particular as the origin of the heaviest r-process nuclei with mass numbers . Several arguments have been brought forward in support of this conjecture. On the one hand, their progenitors in the mentioned mass window, the most massive of the so-called super-asymptotic giant branch (super-AGB) stars, develop cores that are not made of iron, but of oxygen, neon, and magnesium. Since such O-Ne-Mg cores are relatively small, compact, and bounded by an extremely steep density gradient, their collapse, triggered by the onset of rapid electron captures, was thought to lead to supernova explosions by the prompt hydrodynamical bounce-shock mechanism. Such explosions have the potential to eject large amounts of highly n-rich (i.e., low electron-to-baryon fraction, ) matter, in which a strong r-process can happen (Hillebrandt 1978, Hillebrandt et al. 1984, Sumiyoshi et al. 2001, Wanajo et al. 2003, Wheeler et al. 1998). On the other hand, considerations of galactic chemical evolution (e.g., Mathews et al. 1992, Ishimaru & Wanajo 1999, Ishimaru et al. 2005) and observations of metal-poor stars suggest that the sites of heavy r-process element production are decoupled from the main sources of elements between oxygen and germanium (Qian & Wasserburg 2002, 2003, 2007). This was interpreted as support of the speculation that r-nuclei with should be produced in O-Ne-Mg core-collapse supernovae, because owing to the compact progenitor core these explosions eject very little intermediate mass nuclei.
How this production might happen in such supernovae, however, is still unclear. The most sophisticated simulations do not confirm the idea that O-Ne-Mg cores explode by the prompt mechanism and thus rule out the possibility of a low-entropy, low- r-process in these gravitational collapse events (Kitaura et al. 2006, Mayle & Wilson 1988; see also Dessart et al. 2006). Stars at the low-mass end of supernova progenitors are also not the most favorable sites for strong r-processing in the neutrino-driven wind that sheds mass off the surface of the hot neutron star left behind when the explosion has been launched. The formation of the third r-process peak in this high-entropy, high- environment was recognized to require winds from very massive () and very compact (km) neutron stars (Otsuki et al. 2000, Thompson et al. 2001), which are not expected to emerge from the collapse of low-mass stars.
Ning et al. (2007; NQM07) therefore proposed a new formation scenario. They argued that heavy nuclei from barium through the actinides may be produced in the shocked surface layers of exploding O-Ne-Mg cores because these layers expand extremely rapidly after the shock passage, thus allowing high-mass r-nuclei to be assembled at conditions of moderately large entropies and . Here we will demonstrate that detailed hydrodynamical simulations of such exploding O-Ne-Mg cores do not yield the conditions that NQM07 assumed for the expanding shells from the core surface. This means that either their r-process scenario does not take place in O-Ne-Mg supernovae, or the conditions there are significantly different from current model predictions.
In Sect. 2 we will briefly describe the discussed hydrodynamic explosion models, in Sect. 3 we will present our results for the dynamical evolution and explosion of O-Ne-Mg core supernovae, in Sect. 4 we will discuss the nucleosynthesis-relevant conditions in the ejecta, and in Sect. 5 we will summarize our findings and draw conclusions.
2 Computed models
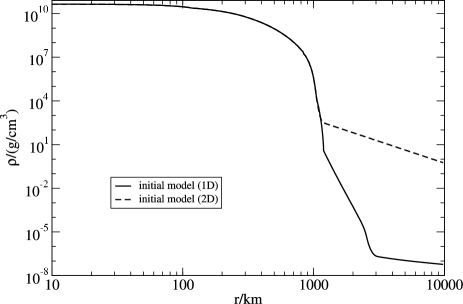
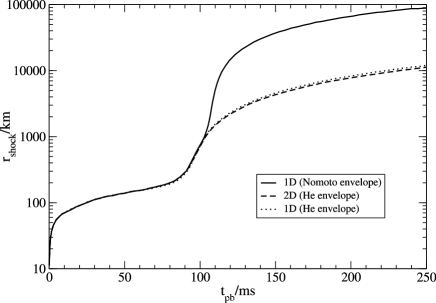
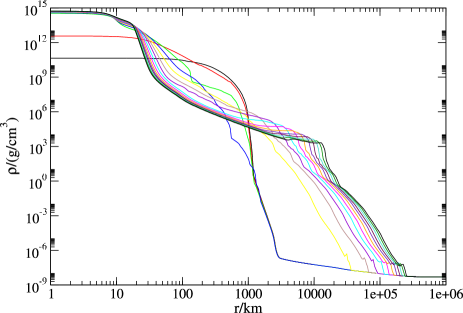
We discuss here results of core-collapse and explosion simulations for an 8.8 star with an 1.3776 O-Ne-Mg core (Nomoto 1984, 1987). One was conducted in spherical symmetry (1D) with the initial density profile given by the solid line in Fig. 1. Another model was two-dimensional (axisymmetric; 2D) and was computed with a less steep density decline below g cm-3, represented by the dashed line in Fig. 1. (For reasons of comparison, a 1D run was also performed with the progenitor profile of the 2D simulation and the shock trajectory of this calculation will be shown in Fig. 3.)
The reason for the use of two different density structures outside of the O-Ne-Mg core is historical. The initially available data file of the 8.8 star only contained data above a density of g cm-3, but no information was given for the stellar layers at radii cm. Kitaura et al. (2006) therefore extended the model with a dilute shell of helium in hydrostatic equilibrium, being guided by the structure above the iron core of slightly more massive progenitors. More recently, Nomoto (private communication) provided a data table in which a hydrostatic hydrogen envelope was added around the thin 0.1 carbon-oxygen shell (between 4g cm-3 and 3g cm-3) and the even thinner shell of 410 of helium (between 3g cm-3 and 6g cm-3). The structural difference of the two initial density profiles plotted in Fig. 1 has no influence on the onset of the supernova explosion and the energy of the explosion. It also plays no role for the nucleosynthesis conditions in the density regime between 10g cm-3 and 10g cm-3, which is the matter of discussion in this paper. But of course, it has influence on the subsequent propagation and acceleration of the outgoing supernova shock.
Both simulations were performed with the Lattimer & Swesty (1991) equation of state (EoS) at high densities. Kitaura et al. (2006) conducted a 1D run also for the Hillebrandt & Wolff EoS (Hillebrandt et al. 1984), which is stiffer around and above nuclear matter density than the Lattimer & Swesty (1991) EoS. The outcome of the simulations for both EoSs was qualitatively the same and even quantitatively extremely similar with respect to the shock formation and propagation, the mass cut, and the explosion properties. Also the other elements of the input physics were the same as in Kitaura et al. (2006), except for the use of an updated version of the electron capture rates on nuclei in nuclear statistical equilibrium (NSE), which were improved compared to the previous version of Langanke et al. (2003) by adding electron screening corrections and a more refined description of the neutrino emission spectrum (K. Langanke, G. Martínez-Pinedo, and J.M. Sampaio, private communication). Another (smaller) difference with minor consequences for the dynamical evolution was the inclusion of inelastic neutrino scattering off nuclei in NSE as described by Langanke et al. (2008).
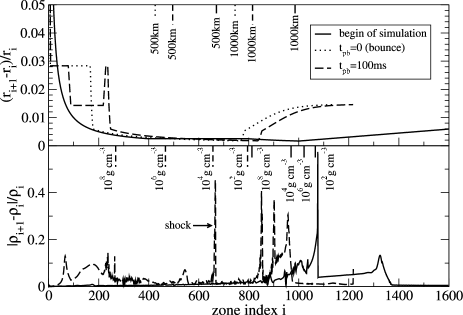
For the simulations discussed here we employed non-equidistant, time-dependent radial grids. In the hydrodynamics module of our code we used 1600 Lagrangian zones during collapse and between 1150 (within the first 80 ms p.b.) and 1720 Eulerian zones after core bounce. The neutrino transport was done with 221 to 411 radial cells; coarser grid spacing than for the hydrodynamics was chosen in the (nearly) transparent layers where the neutrino-matter interactions become irrelevant. Moreover, the outer boundary of the transport grid after bounce was put to 2000 km instead of the –km of the hydrodynamics grid. In setting up the latter, particular care was taken of a high resolution in the steep density gradient at the surface of the O-Ne-Mg core. Figure 2 shows the radial resolution as a function of the zone index in terms of the relative density and radius differences between neighboring zones, and , respectively, at three (two) representative times: at the start of the 1D simulation, 100 ms after core bounce, and in one case also at the moment of bounce. One can see that in the steep density gradient at the core surface the density varies from zone to zone typically by less than ten percent and the radius by less than 0.3 percent. The 2D model had 128 lateral zones of the polar grid.
For doing the simulations of O-Ne-Mg core collapse presented here and in Kitaura et al. (2006), the implementation of nuclear burning and of electron captures was significantly modified and extended compared to the code description given in Rampp & Janka (2002) and Buras et al. (2006). A simplified treatment accounts now for the main thermonuclear reactions involving seven symmetric nuclei (He, C, O, Ne, Mg, Si, Ni). Their abundance changes are described by computing successively the analytic, time-dependent solutions of the rate equations of two- or three-particle reactions, beginning with the fastest of the included reactions (details will be given in a forthcoming paper by Müller et al. 2008). The energy released by the nuclear burning in the non-NSE regime is carried effectively away by electron captures (see, e.g., Miyaji & Nomoto 1987, and references therein), of which those on 20Ne and 24Mg are the most important ones for the considered ensemble of nuclei. The corresponding rates were taken from Takahara et al. (1989).
We point out that our description of the thermonuclear energy production without a full reaction network is approximative and it might be desirable to improve on that in future simulations, also including electron capture rates in a large network fully consistently. However, in combination with our present treatment of electron captures, our simplified implementation of nuclear burning is sufficiently accurate to ensure a smooth, essentially transient-free transition from the progenitor evolution of Nomoto’s model to the collapse phase computed with our code. Initially pressure and gravity forces keep the core very close to hydrostatic equilibrium, and heating by nuclear reactions is nearly balanced by cooling through neutrino emission; ongoing contraction of the central core regions is a consequence of a slight bias towards neutrino losses (see Kitaura et al. 2006 for a discussion of this critical point). For these reasons we think that our approach is more than adequate to describe the contraction of the O-Ne-Mg core during the very early stages of the infall. The C+O shell at the surface of the core, whose radial structure is most relevant for the discussions of the present paper, begins to collapse only when the pressure support from the deeper layers breaks down because an increasingly larger inner part of the core gets involved in the collapse. With the rising temperature nuclear burning of carbon and oxygen in this non-NSE region accelerates dramatically, but the burning timescale does not come close to the dynamical timescale before the infall velocities have become supersonic. The transition from fuel to ashes of different burning stages then occurs in rather narrow radial regions. The nuclear energy release there leads to a transient deceleration of the still highly supersonic infall, which shows up as sawtooth-like features on the velocity profile. It is possible that a more sophisticated treatment of nuclear burning and electron captures affects the details of this behavior, but we do not see a reason why one should expect that a more refined network description might lead to a fundamentally different dynamical behavior of the supersonically infalling shells.
3 Dynamical evolution and explosion
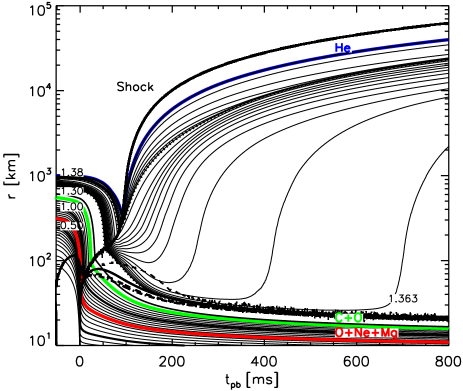
Supernovae of low-mass progenitors like the considered 8.8 star with O-Ne-Mg core can be powered and driven by the neutrino-heating mechanism (Kitaura et al. 2006; Mayle & Wilson 1988). The explosions of the two 1D and 2D simulations discussed here develop in the same way as described in detail by Kitaura et al. (2006). The shock radii as functions of time are displayed in Fig. 3. The difference between the two shock trajectories is entirely caused by the different density profiles shown in Fig. 1. A comparison of 1D and 2D runs with exactly the same progenitor structure confirms that it is not the result of multi-dimensional physics being ignored in the one case but playing a role in the other (see Fig. 3). The reason for this insensitivity of the early shock propagation to the dimensionality of the simulation is the fact that the shock on its way out of the O-Ne-Mg core accelerates enormously when it runs down the steep density gradient bounding the core (Fig. 6). Its evolution is essentially unaffected by the convective overturn that develops in the neutrino-heated layer just above the gain radius (km at ms p.b. and km at ms p.b., see Fig. 4), because convective overturn in this region becomes strong only later than 100 ms after bounce (see Fig. 2 in Janka et al. 2007 and Fig. 1 in Janka et al. 2008). At this time the shock already crosses a radius of 1000 km (Figs. 3 and 6) and is therefore far away from the convective layer just outside of the gain radius. Since the shock propagates with high velocity to large distances, the sound crossing time from the convective layer to the shock grows so quickly that sonic communication cannot take place on the simulated timescales. Therefore the developing convective activity around the neutron star has no effect on the shock and the shock trajectory does not reveal differences between 1D and 2D simulations. In contrast, convection in the gain layer and neutron star has moderate consequences for the explosion energy of the supernova, which becomes about erg at the end of our simulations (Fig. 5, panel a).

The explosion energy in panel a of Fig. 5 at a certain time is defined as the sum of thermal plus degeneracy energy (i.e., internal energy without rest-mass energy), kinetic energy, and gravitational energy of all matter where this sum, which we call “local binding energy”, is positive at the given time (cf. Eqs. 27 and 29 in Buras et al. 2006, however in the present work evaluated with the effective relativistic potential of Case A in Marek et al. 2006, which was also used in our simulations). One should note that the mass that fulfills the “explosion criterion” (i.e., positive local binding energy) varies with time. For the considered progenitor star with its loosely bound hydrogen envelope, which does not yield a significant additional energy contribution, the final value of the explosion energy thus defined is equivalent to the excess energy of the supernova ejecta at infinity. A steep rise in the explosion energy occurs between 140 ms and 260 ms after core bounce shortly after the first mass in the neutrino-heating layer has begun to expand outward from locations close to the gain radius (see Fig. 4). This steep rise is mainly caused by a very rapid increase of the mass that has obtained positive local binding energy, which means that more and more mass shells fulfill the explosion criterion. It is at this time that the matter initially forming the gain layer becomes gravitationally unbound. Even slightly before (at about 100 ms after bounce) the explosion energy had reached a little plateau of some erg. This plateau is associated with a small amount of material that was swept outward when the shock accelerated in rushing down the steep density gradient at the surface of the O-Ne-Mg core. The positive energy of this matter was transferred by work from the expanding and pushing outer layers of the nascent neutron star just below the ejected mass shells (see panel b of Fig. 5, which will be further discussed in the next paragraph). Even earlier (at ms) the gain radius had developed and neutrino heating had started to deposit energy in the postshock layer (see Fig. 4 and panels c and d of Fig. 5). The time delay between this moment and the onset of the steep rise of the explosion energy is caused by the fact that the matter in the newly established gain layer is gravitationally bound and neutrino heating has to deposit enough energy before the local binding energy of this gas can become positive. After roughly 260 ms p.b., the rise of the explosion energy flattens. At that time the gas that was initially in the gain layer has expanded outward and the gain radius has retreated to the neutron star surface. Subsequently, more mass is continuously ablated (with a decreasing rate) from the surface of the nascent neutron star in the neutrino-driven wind, whose power is responsible for the gradual increase of the explosion energy over longer timescales (see also Woosley & Baron 1992, Qian & Woosley 1996, Thompson et al. 2001, Arcones et al. 2007 and references therein).
In panels b–d of Fig. 5 we display the time evolution of different energies that account for the energy budget of selected ejected mass shells or mass regions (the corresponding layers are defined in the figure caption) in the 1D model. The red line gives the volume and time integrated net energy deposition by neutrinos in the gain region, the green curve the integrated net energy loss in the neutrino-cooling region, the blue curve the cumulative compression () work exerted on the settling neutron star or transferred to the considered mass shell by its expanding surface layers, and the orange curve is the sum of these three effects, which follows well the behavior of the total energy as represented by the black line. The latter displays the time evolution of the “total energy”. In contrast to the local binding energy integrated for the explosion energy in panel a of Fig. 5, this total energy is defined as the internal plus kinetic minus gravitational binding energy plus a rest-mass energy contribution111Instead of just the internal (i.e. thermal plus degeneracy) energy, the total energy contains the relativistic energy of the nucleons, i.e. their rest-mass energies plus their internal energy, renormalized by subtracting 930.773 MeV per nucleon. The latter roughly corresponds to the rest mass of nucleons bound in iron-group nuclei., which ensures that nuclear photodisintegration and recombination effects do not show up in the time evolution of the total energy. This makes sense because these effects do not yield any significant net contribution to the energy balance of a collapsing and subsequently ejected mass shell, nor do they contribute to the excess energy (i.e., explosion energy) of the supernova ejecta. The latter fact can be immediately verified by inspecting the dashed magenta line, which displays the cumulative energy that is exchanged between internal and rest-mass energy through nuclear composition changes by burning (very small positive contribution), photodisintegration (responsible for a negative derivative), and nucleon recombination (leading to a positive derivative). Converting the plotted total energy to the total binding energy as volume integral of the local binding energy requires adding the values of the black and magenta lines.
For each mass shell or region the time evolution of the total energy and its cumulative energy gains and losses can be visualized in such a plot, providing insight into the effects that determine its dynamics and decide about its approach to a gravitationally unbound state and its contribution to the supernova energy. In Fig. 5 such valuable information is given for three exemplary cases. In panel c all mass outside of a mass coordinate of 1.3675 is considered; this shell is representative of the phase when the steep rise of the explosion energy in panel a occurs (its inner boundary is located at about 150 km at 200 ms after bounce). In panel d the integration includes all mass above the mass cut that develops until the end of the simulation (the inner boundary of this shell is associated with a mass coordinate of 1.3626, compare Fig. 4), and in panel b the evaluated ejecta layer is enclosed by the mass coordinates of 1.376913 and 1.3769486. The latter shell corresponds to the mass associated with the surface region of the O-Ne-Mg core (chosen such that the ejecta shell considered by NQM07 for their nucleosynthesis studies is included; see also Fig. 11) but it accounts only for a small fraction of the core matter that gets ejected in the explosion. This shell becomes unbound immediately after it is hit by the shock (at about 90 ms after bounce) and obtains its positive energy of about erg by the d work of the expanding deeper layers (see the blue line in panel b of Fig. 5, which accounts for the growth of the total energy after shock passage); this and the adjacent mass shells at the O-Ne-Mg core surface produce the small plateau before the steep rise of the explosion energy visible in panel a of Fig. 5 (cf. discussion above).
For the dominant part of the ejecta that come from the O-Ne-Mg core (panels c and d of Fig. 5), neutrino heating in the gain layer (red curve) provides by far most of the energy that the shells finally contribute to the explosion energy (black curves at the end of the simulated post-bounce period) and compensates for the energy losses due to compression work on the neutron star interior (blue line) and due to neutrino emission at times when parts of the layer are inside the cooling region (green line). The black and orange curves in panel d of Fig. 5 show the time-integrated evolution of the total energy of all ejected O-Ne-Mg core mass from the beginning until the end of our 1D simulation: the shells start out from a marginally bound state in the progenitor core (with a total energy of roughly erg), then first lose energy by d work during the beginning collapse (until about 60 ms after bounce), then receive energy by neutrino heating after the gain radius has formed at ms p.b. (see Fig. 4), but transiently can again (panel d) or not (panel c) lose more energy by compression work to the forming neutron star at times when the latter shrinks rapidly (until about 300 ms after bounce) before finally the contraction of the inner shell boundary slows down sufficiently that neutrino heating in the considered shell becomes clearly dominant. Only afterwards the total energy of the integrated ejecta mass (panel d) rises continuously and in fact steeply, because neutrinos deliver the energy that lifts the matter from its gravitationally bound state to an unbound state with excess energy. This, of course, happens later for mass shells that get blown out later, corresponding to their inner boundary being deeper inside the neutron star. At the end of our simulation the black and orange lines in panel d of Fig. 5 match the temporary value of the explosion energy plotted in panel a222A very small remaining difference stems from the rest-mass contributions that are per definition included in the total energy but not in the explosion energy at a time when the recombination of nucleons and -particles to nuclei in the ejecta is still incomplete..
Let us now discuss in more general terms the physical processes that play a role for the development of O-Ne-Mg core explosions and for providing their power. The onset of the explosion of stars with O-Ne-Mg core is facilitated by the very steep density gradient at the edge of the core. This rapid density decline allows the shock to expand in response to the rapidly decreasing mass accretion rate and the associated drop of the ram pressure of infalling material (this was already discussed in detail by Kitaura et al. 2006). We emphasize that this outward acceleration of the shock at the time when the steep surface gradient reaches it, and the thus triggered reexpansion of the postshock gas, cannot be the cause of the supernova explosion associated with the positive ejecta energy visible in Fig. 5. This energy has to be provided by some sufficiently strong source, for which different possibilities exist in our (nonrotating and nonmagnetic) models: (i) work from also expanding but not ejected layers at the lower boundary of the region of outward mass acceleration; the associated energy is found to be very small (at most some erg, see panels b–d of Fig. 5 and the corresponding discussion in the text); (ii) energy release by the recombination of free nucleons to -particles and heavier nuclei; (iii) nuclear burning in matter swept up by the outgoing shock; (iv) neutrino energy deposition, and (v) a flux of sonic energy associated with sound waves originating from a violently turbulent accretion layer at the neutron star surface or/and from large-amplitude g-mode oscillations of the neutron star core. This has recently been suggested to play a crucial role in the acoustic explosion mechanism (Burrows et al. 2006, 2007), but its relevance is controversial (Weinberg & Quataert 2008). A quantitative evaluation reveals a negligible contribution from this effect to the ejecta energy in the discussed models (details will be presented in Müller et al. 2008).
How important are the other potential sources of energy, (ii)–(iv), when we ask for the origin of the excess energy of the bulk of the ejecta? First one should note that the gas behind the shock and close to the neutron star is strongly bound in the gravitational potential of the forming compact remnant (the internal energy plus kinetic energy minus gravitational binding energy of a nucleon at 100 km is typically MeV at ms after bounce). The matter in the infall region ahead of the shock starts out as part of the progenitor star from a gravitationally bound state (about MeV per nucleon at the outer edge of the O-Ne-Mg core). The local binding energy of this matter becomes even more negative when it goes through the shock and the shock heating causes the photo-disintegration of nuclei to free neutrons, protons, and particles, a process in which several MeV per nucleon are converted from thermal energy to nucleon rest-mass energy. A sizable amount of energy is also lost through work exerted by the infalling mass shells on the settling neutron star (additional neutrino energy losses can occur but are only relevant for material that gets accreted to locations below the gain radius; see Fig. 5, panel d, in comparison to panel c, where this is not the case). As a consequence of all these energy losses in neutrinos, nuclear dissociation, and compressional work transferred to the neutron star, the matter in the gain layer and the surface of the neutron star is much more bound than it was before its collapse. The recombination of nucleons during a possible later re-expansion and ejection of this matter — point (ii) of the list above — can at most return the energy consumed earlier by nuclear dissociation and can thus help lifting the matter back towards a state near marginal gravitational binding, which it had before it was accreted and photodisintegrated in the shock or behind the shock. This is obvious from the dashed magenta line in panel d of Fig. 5, which starts at zero and comes back there at the end. Nucleon recombination releases energy that was temporarily stored in rest-mass energy and converts it back to thermal energy. This energy release raises the pressure and unquestionably can thus have a very important influence on the dynamics of the supernova gas. In particular, it can assist and support the shock expansion and outward acceleration of the matter behind the shock, because it happens right at the time when the gas starts to cool as it begins to move away from the neutron star in reaction to the energy input by neutrinos. Nuclear recombination energy by itself, however, cannot bring the gas energy to significant positive values333This assessment is based on considering the effective net energy balance of some collapsing and ultimately ejected matter, which means that the initial, gravitationally bound state of the gas (composed of heavy nuclei) in the core of the progenitor star is compared with the final state of the gas after ejection. Our conclusions are valid independent of the exact moment and detailed reason of the nuclear photodisintegration, whether such dissociation happens as a consequence of the compressional heating during infall, due to shock heating, or because matter is bathed in the intense neutrino flux of the nascent neutron star. A small net gain of energy can in principle be obtained only when the recombination leads to more strongly bound nuclei than the undissociated matter started out from. This could account for at most erg per of ejected matter if the pre-collapse material consisted for example of oxygen and carbon while the ejecta contained mostly iron-group nuclei (see the dashed magenta line in panel c of Fig. 5). Such a gain of energy could occur either through nuclear burning or less directly by photodisintegration and later recombination when the matter goes through NSE.. This can be achieved only by the processes mentioned in items (iii) and (iv).
Thermonuclear burning in the shock-heated matter, source (iii), which might play a role for the explosion of more massive progenitor stars (Mezzacappa et al. 2007), contributes to the blast energy of O-Ne-Mg core supernovae only on a minor level. A firm upper limit of the thermonuclear energy production can be estimated from the fact that of nickel are ejected (and at most an order of magnitude less oxygen), corresponding to 10erg of energy from nuclear burning (less than 1 MeV per nucleon when oxygen or silicon are converted to iron). This, however, largely overestimates this contribution, because by far most of the ejected iron-group material originates from matter that was very hot and in NSE before it got ejected and began cooling. Such material is already included in the energy budget by item (ii). The only remaining power source for explaining the growing positive explosion energy is therefore neutrino heating in the gain layer. Panel d of Figure 5 displays the time-integrated energy that is transferred by neutrinos to the ejected matter in the gain layer. This contribution can well account for the energetics of the developing explosion; in fact it is much larger since neutrino energy deposition also helps to bring the ejecta out of their gravitationally bound state close to the neutron star. Because of convective overturn in the gain layer, which carries cool gas to radii near the region of strongest neutrino heating, the 2D simulation accumulates slightly more power than the 1D model, although convection has no influence on the propagation of the shock in O-Ne-Mg core supernovae.

4 Nucleosynthesis-relevant conditions
Having in mind the extremely fast expansion of the shocked surface layers of O-Ne-Mg cores, NQM07 advocated an r-process scenario for such rapidly expanding matter. In this case the neutron-to-proton ratio can be close to unity (Meyer 2002), provided the entropy is sufficiently high, around kB per nucleon. NQM07 assumed that such entropy values are produced by the outgoing shock in the carbon-oxygen shell around densities of g cm-3, where still enough matter is located to allow for the production of an interesting amount of r-process material. They, moreover, assumed that the gas is heated by the shock to NSE temperatures (K) before it starts expansion with a timescale of order 1 ms. For this to be achieved, the shock was considered to propagate with a velocity of cm s-1.
NQM07 used the shock-jump relations to connect preshock and postshock conditions (density, velocity, and pressure) and employed an analytic approach to describe the evolution of the shock-accelerated mass shells. To this end they made the simplifying assumption of a strong shock, zero preshock velocity, adiabatic expansion, and relativistic gas particles (radiation and electron-positron pairs). In addition, they had to employ an assumption for the shock velocity and its dependence on the preshock density, in which case they could derive expressions for the density and the temperature of the shocked, expanding mass elements as functions of time . Moreover, they considered the shock running with its assumed speed through the unmodified progenitor core structure. This is only a crude approximation. In reality, the core has started to contract before the shock reaches its surface layers. Since deeper regions of the core begin to collapse first, the absolute value of the infall velocity develops a maximum at the edge of the homologously collapsing inner core and decreases towards larger radii at any given time. Therefore the accelerating contraction proceeds in a differential way. This leads to a significant flattening of the initially very steep density gradient around the C/O shell before the shock hits this region (Fig. 7).
In contrast to the approximative treatment by NQM07, we determine the dynamics and thermodynamics of the supernova gas from our sophisticated numerical explosion models. In the following, we will compare the nucleosynthesis relevant conditions in the supernova ejecta as obtained in the simulations with those assumed by NQM07.
Analytically, using the Rankine-Hugoniot shock-jump relations, the postshock temperature and entropy (in units of Boltzmann’s constant per nucleon) can be written as functions of the preshock conditions in the following way (see Eqs. 2 and 3 in NQM07):
| (1) | |||||
| (2) |
where is the velocity of the shock and and are the velocity and density, respectively, of the gas ahead of the shock. The velocities are normalized to cm s-1, and the density to g cm-3. In contrast to NQM07, we have considered here the more general expressions for the case in which the preshock gas is not at rest.
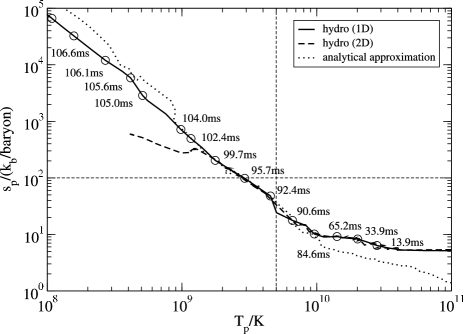
In Fig. 8 we show the postshock entropy vs. the postshock temperature as computed in the hydrodynamic models. The 1D and 2D results are in perfect agreement until the shock in the 2D case reaches a density of about g cm-3, where the progenitor density profiles of the two simulations begin to differ (Fig. 1). This is the case at ms after bounce as can be seen from the time labels in Figs. 6 and 7. The dotted line in Fig. 8 represents the analytic behavior obtained from Eqs. (1) and (2). For the velocities and the preshock gas density on the rhs of these equations we used the values from the 1D simulation. In the temperature window between K and K, which is the relevant one for our present considerations, the analytic values and the numerical results are in good agreement. Only in the regimes of lower and higher temperatures, some of the assumptions made in the derivation of Eqs. (1) and (2) are not well fulfilled any more and the agreements becomes worse.
We note, however, that the entropy-temperature combinations produced by the shock are much different from those needed for the r-process scenario considered by NQM07. In regions where the shock heats the matter to temperatures where NSE can be reached (at least K), the entropies stay below kB per nucleon, while the temperature remains less than 2K in those layers where the postshock entropies become around or larger than kB per nucleon. Nowhere the temperature and density of the shocked gas simultaneously reach the conditions desired by NQM07, which are roughly in the region above the horizontal short-dashed line and to the right of the vertical short-dashed line in Fig. 8.
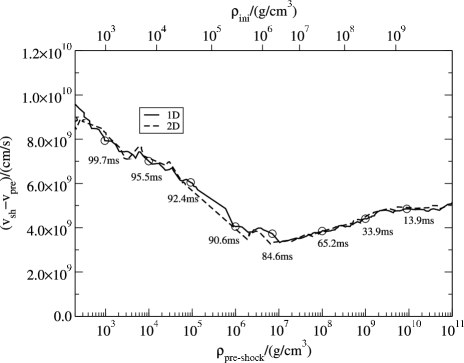
The reason for this failure is clear from Fig. 9. While NQM07 assumed a shock velocity of cm s-1, the actual shock speed in the hydrodynamic models (more precisely, the shock speed relative to the preshock gas) is always less than cm s-1 for g cm-3 and even less than cm s-1 for g cm-3 (Fig. 9).
The slower shock also leads to much longer expansion timescales of the shock-accelerated shells than considered by NQM07. We define the expansion timescale of mass shells ejected in the supernova explosion by the time it takes the gas to cool from a temperature to of this value. This timescale can be related to the times and used by NQM07 to characterize the expansion of the surface area of a mass element and the increase of its thickness, respectively, by the following relation:
| (3) |
where . For the values s and s adopted by NQM07, one obtains s as the corresponding e-folding timescale.
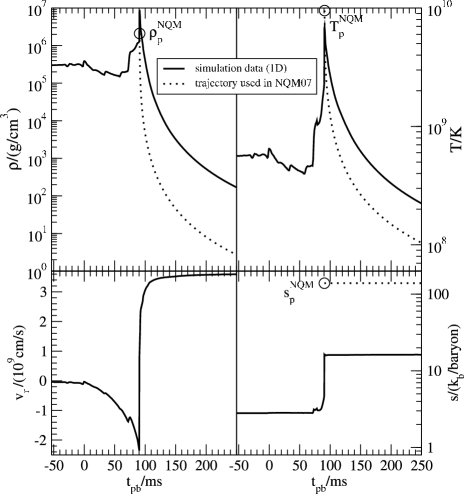
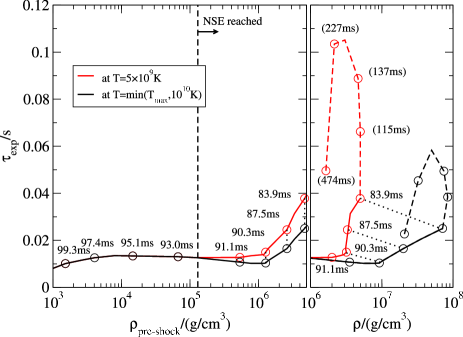
Figure 10 shows the expansion timescales measured for the mass shells ejected in our hydrodynamic explosion models, plotted versus characteristic densities. Two e-folding times are given: the red curve corresponds to the cooling time from K to of this value, the black curve denotes the timescale for the temperature to decrease from to , when is the maximum temperature present in the shell before its expansion. The solid lines indicate matter that is swept outward by the expanding shock directly, whereas the dashed sections of the curves belong to matter that was first accreted onto the forming neutron star before it was later expelled in the neutrino-driven wind. The black and red lines coincide at low preshock densities where the outgoing shock is unable to heat the matter to more than K, which is also considered to roughly mark the lower boundary of the regime where NSE can be established in the shocked gas. For all preshock densities g cm-3, the expansion timescale is longer than 10 ms, which is at least a factor of 10 larger than assumed by NQM07.
In Fig. 11 the temperature and density evolution of a collapsing and ultimately ejected mass shell in the C+O layer with an initial density g cm-3 and an initial temperature K is displayed. NQM07 focused on this shell for their nucleosynthesis studies. They assumed that the shell stays at its initial density and temperature until it is hit by the shock. This preshock behavior and the conditions in the shocked shell considered by NQM07 (dotted lines) are clearly different from the results of our hydrodynamic model (solid lines). The mass shell in the simulation lingers near hydrostatic equilibrium for nearly 100 ms. The slight density and temperature decrease before the steep rise does not signal an expansion of the O-Ne-Mg core: the velocity of the considered mass shell is near zero until about 60 ms after the start of the simulation and then becomes increasingly negative (see Fig. 11, lower left panel). Instead, the differential collapse of the core, i.e. the fact that the deeper layers start their infall first and contract faster, leads to a period of stretching () of the mass shell and therefore to a drop of its density and temperature. Then the infall of the shell accelerates, triggered by the abating pressure support from the already collapsing inner regions, and the associated compression leads to a rapid rise of the temperature and density. With the growing temperature the carbon and oxygen burning timescales decrease steeply, but they come close to or become shorter than the collapse timescale only when the infall velocity of the shell is already much larger than the local sound speed. Therefore the energy release of the nuclear reactions decelerates the supersonic collapse of the shell only transiently and locally, but does not fundamentally alter its overall dynamics. The next difference to the analytic NQM07 description is the fact that the hydrodynamical simulation yields a higher postshock density and lower postshock temperature, whose combination corresponds to a significantly lower postshock entropy (see Fig. 11). Finally, the decline of and is much slower than considered by NQM07. This illustrates the different thermodynamical conditions and expansion behavior of the shock-heated and accelerated matter. The most relevant differences originate from the discrepancy between the shock velocity in the simulations and the value assumed by NQM07.
5 Summary and conclusions
We have shown that the conditions required for a new, fast-expansion, modest-entropy r-process scenario in the shock-heated ejecta of O-Ne-Mg core supernovae as proposed recently by NQM07, are not matched by detailed hydrodynamical explosion models. From Figs. 8–10 it is evident that the expanding mass shells in our 1D as well as 2D simulations never attain the combination of conditions identified by NQM07 as favorable for the r-process: per nucleon, ms, and the postshock temperature high enough for NSE being established in the shock-heated matter. Our simulations reveal that either the entropy remains too low (by a factor of 3–5) or the maximum temperature is far from that for NSE (approximately by a factor 5). In any case, the expansion is roughly ten times slower than needed. The conditions in explosion models of O-Ne-Mg cores therefore miss those necessary for the new r-process scenario by at least as much as current neutrino-wind models fail to produce the conditions for strong r-processing in the ordinary high-entropy wind scenario (where the entropies must typically be a factor 2–3 larger than provided by the models, see e.g. Witti et al. 1994, Qian & Woosley 1996, Thompson et al. 2001).
The main reason for the inadequacy of the O-Ne-Mg core explosions is a significantly slower shock velocity (Fig. 9) than assumed by NQM07, who took . Only in progenitor layers with an initial density of less than about g cm-3 does the shock reach a speed near cm s-1 or higher, and therefore the postshock entropies exceed 100 per nucleon and the expansion timescale tends to become short. However, the temperatures of that shock-heated gas then remain so low that NSE is never achieved. Moreover, these low-density layers contain two to three orders of magnitude less mass than the shells considered by NQM07, and therefore it is questionable whether they could contribute to the r-process inventory of the galaxy on any significant scale, even if r-process nuclei were able to form there in a way that does not require a freeze-out from NSE conditions.
We therefore conclude that the newly suggested r-process scenario is unlikely to work in supernovae of progenitor stars with O-Ne-Mg cores. Detailed nucleosynthesis calculations based on our explosion models confirm this conclusion (Hoffman et al. 2008).
The extremely rapid shock acceleration that is necessary to reach the required high temperatures and entropies and the very short expansion timescales of core matter in layers with relatively high initial densities, cannot be obtained in present explosion models. In view of the sophistication of the 1D and 2D models this failure may point to a significant deficit of the progenitor data and assumed initial conditions. Very rapid rotation, which affects the structure of the collapsing stellar core already during the infall stage and shortly after bounce, or very strong magnetic fields must be expected to modify the explosion conditions compared to our simulations. Such effects would require the reinvestigation of the pre-collapse evolution of low-mass supernova progenitors in the 8–10 range including rotation and magnetic fields. Also the accretion induced collapse (AIC) of rapidly rotating white dwarfs, which was simulated recently by Dessart et al. (2006, 2007) without and with magnetic fields, may deserve a detailed evaluation of the associated nucleosynthesis. It is, however, unclear whether AICs occur frequently enough to be seriously considered as a major site for the production of high-mass r-process elements, in particular since their event rate seems to be strongly limited by the potential massive overproduction of closed neutron shell material (see Dessart et al. 2007 and references therein).
Acknowledgements.
We are grateful to K. Nomoto for providing us with his progenitor data and to A. Marek for his contributions to the microphysics used in the supernova runs. We also thank the referee, Raph Hix, for his valuable suggestions to improve our manuscript. The project was supported by the Deutsche Forschungsgemeinschaft through the Transregional Collaborative Research Centers SFB/TR 27 “Neutrinos and Beyond” and SFB/TR 7 “Gravitational Wave Astronomy”, and the Cluster of Excellence EXC 153 “Origin and Structure of the Universe” (http://www.universe-cluster.de). The computations were done at the High Performance Computing Center Stuttgart (HLRS) under grant number SuperN/12758.References
- (1) Arcones, A., Janka, H.-Th., & Scheck, L. 2007, A&A, 467, 1227
- (2) Buras, R., Rampp, M., Janka, H.-Th., & Kifonidis, K., 2006, A&A, 447, 1049
- (3) Burrows, A., Livne, E., Dessart, L., Ott, C.D., & Murphy, J. 2006, ApJ, 640, 878
- (4) Burrows, A., Livne, E., Dessart, L., Ott, C.D., & Murphy, J. 2007, ApJ, 655, 416
- (5) Dessart, L., Burrows, A., Ott, C.D., Livne, E., Yoon, S.-Y., & Langer, N. 2006, ApJ, 644, 1063
- (6) Dessart, L., Burrows, A., Livne, E., & Ott, C.D. 2007, ApJ, 669, 585
- (7) Hillebrandt, W. 1978, Space Science Reviews, 21, 639
- (8) Hillebrandt, W., Nomoto, K., & Wolff, R.G. 1984, A&A, 133, 175
- (9) Hoffman, R.D., Müller, B., & Janka, H.-Th. 2008, ApJ, 676, L127
- (10) Ishimaru, Y., & Wanajo, S. 1999, ApJ, 511, L33
- (11) Ishimaru, Y., Wanajo, S., Aoki, W., Ryan, S.G., & Prantzos, N. 2005, Nucl. Phys. A, 758, 603c
- (12) Janka, H.-Th., Marek, A., & Kitaura, F.-S. 2007, in: Proc. Internat. Conf. Supernova 1987A: 20 Years After: Supernovae and Gamma-Ray Bursters, Aspen, Colorado, Feb. 19–23, 2007, Eds. S. Immler, K.W. Weiler, and R. McCray, AIP Conf. Proc. (American Institute of Physics, New York), Vol. 937, p. 144; arXiv:0706.3056
- (13) Janka, H.-Th., Marek, A., Müller, B., & Scheck, L. 2008, in: Proc. Internat. Conf. 40 Years of Pulsars: Millisecond Pulsars, Magnetars, and More, McGill Univ., Montreal, Canada, August 12–17, 2007, Eds. C.G. Bassa, Z. Wang, A. Cumming, and V. Kaspi, AIP Conf. Proc. (American Institute of Physics, New York), Vol. 983, p. 369; arXiv:0712.3070
- (14) Kitaura, F.S., Janka, H.-Th., & Hillebrandt, W. 2006, A&A, 450, 345
- (15) Langanke, K., Martínez-Pinedo, G., Sampaio, J.M., Dean, D.J., Hix, W.R., Messer, O.E.B., Mezzacappa, A., Liebendörfer, M., Janka, H.-Th., & Rampp, M. 2003, Phys. Rev. Lett., 90, 241102
- (16) Langanke, K., Martínez-Pinedo, G., Müller, B., Janka, H.-Th., Marek, A., Hix, W.R., Juodagalvis, A., & Sampaio, J.M. 2008, Phys. Rev. Lett., 100, 011101
- (17) Lattimer, J. & Swesty, F. 1991, Nucl. Phys. A, 535, 331
- (18) Mathews, G.J., Bazan, G., & Cowan, J.J. 1992, ApJ, 391, 719
- (19) Marek, A., Dimmelmeier, H., Janka, H.-Th., Müller, E., & Buras, R. 2006, A&A, 445, 273
- (20) Mayle, R., & Wilson, J.R. 1988, ApJ, 334, 909
- (21) Meyer, B.S. 2002, Phys. Rev. Lett., 89, 231101
- (22) Mezzacappa, A., Bruenn, S.W., Blondin, J.M., Hix, W.R., & Messer, O.E.B. 2007, in: The Multicolored Landscape of Compact Objects and Their Explosive Origins. AIP Conf. Proc. (American Institute of Physics, New York), Vol. 924, p. 234; arXiv:0709.1484
- (23) Miyaji, S. & Nomoto, K. 1987, ApJ, 318, 307
- (24) Müller, B., Janka, H.-Th., & Kitaura, F.S. 2008, in preparation
- (25) Ning, H., Qian, Y.-Z., & Meyer, B.S. 2007 (NQM07), ApJ, 667, L159
- (26) Nomoto, K. 1984, ApJ, 277, 791
- (27) Nomoto, K. 1987, ApJ, 322, 206
- (28) Otsuki, K., Tagoshi, H., Kajino, T., & Wanajo, S. 2000, ApJ, 533, 424
- (29) Qian, Y.-Z., & Wasserburg, G.J. 2002, ApJ, 567, 515
- (30) Qian, Y.-Z., & Wasserburg, G.J. 2003, ApJ, 588, 1099
- (31) Qian, Y.-Z., & Wasserburg, G.J. 2007, Phys. Rep., 442, 237
- (32) Qian, Y.-Z. & Woosley, S.E. 1996, ApJ, 471, 331
- (33) Rampp, M. & Janka, H.-Th. 2002, A&A, 396, 361
- (34) Sumiyoshi, K., Terasawa, M., Mathews, G.J., Kajino, T., Yamada, S., & Suzuki, H. 2001, ApJ, 562, 880
- (35) Takahara, M., Hino, M., Oda, T., Muto, K., Wolters, A.A., Glaudemans. P.W.M., & Sato, K. 1989, Nucl. Phys. A, 504, 167
- (36) Thompson, T.A., Burrows, A., & Meyer, B.S. 2001, ApJ, 562, 887
- (37) Wanajo, S., Tamamura, M., Naoki, I., Nomoto, K., Yuhri, I., Beers, T.C., and Nozawa, S. 2003, ApJ, 593, 968
- (38) Weinberg, N.N. & Quataert, E. 2008, submitted to MNRAS; arXiv:0802.1522
- (39) Wheeler, J.C., Cowan, J.J., & Hillebrandt, W. 1998, ApJ, 493, L101
- (40) Witti, J., Janka, H.-Th., & Takahashi, K. 1994, A&A, 286, 841
- (41) Woosley, S.E., & Baron, E. 1992, ApJ, 391, 228