Dissecting the star-formation history of starburst galaxies: the case of NGC 7673
Abstract
We have collected archival data on NGC 7673 to constrain the star-formation history that produced the young star clusters and the field stellar population in this galaxy during the last 2 Gyr. We have considered the sample of 50 star clusters detected by HST/WFPC2 in the UV, V and I bands and estimated their age, intrinsic reddening, and mass via comparison of their colours with STARBURST99 models. We have found two prominent epochs of cluster formation occurred about 20 Myr and 2 Myr ago, with somewhat minor events between 3 Myr and 6 Myr ago. The star clusters are characterised by an intrinsic reddening E(B-V) 0.4 mag and a mass lower than 2106 M⊙. Out of the 50 star clusters, we have selected 31 located within the boundaries of the IUE large slit that was employed to obtain the spectrum of NGC 7673 between 1150 Å and 3350 Å. For each cluster, we have built a synthetic spectrum corresponding to the age, mass and intrinsic reddening derived from the cluster colours, properly redshifted to NGC 7673. The spectra have then been added together in a final, clusters integrated spectrum. This and the IUE and FUSE spectra of NGC 7673 have allowed us to describe the star-formation history of the unresolved stars in the field as either exponentially decaying or multi-burst. In the first case, we have derived an e-folding time of 700 (900) Myr and an initial star-formation rate of 16 (13) M⊙ yr-1 when the Fitzpatrick’s (Calzetti’s) extinction law is used. In the case of a multi-burst star-formation history, we have assumed that the same bursts which produced the star clusters built up also the field population. In this way, the field population turns out to be composed by a young ( 40 Myr) component 3 (2) times brighter than the star clusters, and a component as old as 850 (450) Myr, about 200 (100) times more massive than the star clusters together. These star-formation histories fit equally well the observed UV spectrum of NGC 7673.
keywords:
galaxies: starburst — galaxies: star clusters1 Introduction
Star formation is one of the major drivers of galaxy evolution. As already recognised by Hubble (1926), it is manifested in a variety of histories and rates along the Hubble sequence, and in cosmic lookback time (Madau et al. 1996). In the present-day Universe, the star-formation rate (SFR) spans about six orders of magnitude (in absolute terms, or about 2 per galaxy luminosity), from virtually zero in early-type galaxies up to 20 M⊙ yr-1 in gas-rich spirals, 100 M⊙ yr-1 in optically selected starburst galaxies, and 1000 M⊙ yr-1 in luminous IR starburst galaxies (cf. Kennicutt 1998). Locally, rapid star formation seems to occurr preferentially in low-luminosity galaxies (cf. Cowie et al. 1996). These trends clearly indicate that star formation is regulated by the galaxy gas content and dynamical structure. The star-formation rate is observed to typically increase with the amount of available gas and to be rather insensitive to the dynamics due to a bar or a spiral arm structure. The latter mainly affects the surface density of the star formation activity (cf. Knapen et al. 1992). On the contrary, tidal interactions and mergers between gas-rich systems appear to enhance the star-formation rate; galaxies undergoing a relatively intense star-formation activity are indeed found to be morphologically disturbed (cf. Kennicutt 1998 and references therein, Sanders & Mirabel 1996). Gas loss due to ram-pressure stripping can reduce this effect for cluster galaxies. In recent years, it has been claimed that AGN feedback (in its radio mode) can heavily affect the star-formation activity of a galaxy to the extent of suppressing it (Croton et al. 2006). This would be the most effective way of truncating star formation in early-type galaxies, in addition to gas exhaustion due to the star-formation activity itself. Therefore, a complete description of galaxy evolution requires a detailed understanding of what can trigger and what can repress the star-formation activity, and how star formation takes place. It is well known, for example, that star formation changes in time with a different pace in galaxies of different Hubble type: it runs out in early-type galaxies after 1 - 2 Gyr from the initial burst (Jimenez et al. 2006), while it is roughly constant or smoothly decaying in spirals (Searle et al. 1978, Kennicutt 1998, Kauffmann et al. 2003). A constant star-formation activity has been also observed in a sample of starburst galaxies studied in ultraviolet by Leitherer et al. (2002). All these star-formation histories (SFHs) are derived from the global photometric and spectroscopic properties of galaxies, and their parameters (such as the age and duration of the burst, the star-formation rate) may change when some of these galaxies are analysed in greater detail.
During the last decade, the Hubble Space Telescope (HST) has revealed that a significant fraction of all stars produced during a burst of star formation are formed within clusters. For example, Meurer et al. (1995) found that the fraction of ultraviolet (UV) flux from star clusters varies between 5% and 52% of the total galaxy UV emission, with an average of 20%. These star clusters are found to be blue and luminous, hence young (from few 106 to few 108 years) and with a mass typically between 104 and 106 M⊙. For these reasons, they are commonly labelled as young massive clusters (YMCs). YMCs are mostly detected in starburst galaxies, both major and minor mergers, and, in a smaller extent, in spirals and dwarf-irregulars (Larsen 2004). Given the significant contribution of YMCs to the stellar population of their host, their formation comes to play an important role in the global star-formation history of their parent galaxy. We could think of identifying, for example, two major components in the SFH of a starburst galaxy: a star-formation activity responsible for the unresolved stars in the field and another one which built up the system of YMCs. We could then ask if and how these components correlate with each other: did the field and clusters populations form in the same way, following the same star-formation history? How intense was the clusters SFH with respect to the one in the field? What are the typical timescales of the field and clusters SFHs? Would star clusters be able, upon disruption, to build up the field stellar population?
The first studies by Boutloukos & Lamers (2003) and de Grijs et al. (2003) indicate that the cluster disruption timescale tends to be shorter (30 - 40 Myr) in interacting systems such as M 51 and M 82 and to increase up to few Gyr in dwarf galaxies (8 Gyr in the SMC). According to these results, clusters would then mostly contribute to form the field population of interacting, starburst galaxies. Chandar et al. (2005) estimate even shorter disruption timescales, of the order of 10 Myr.
Nowadays, the wealth of data in archives enables us to analyse in detail the SFH of a galaxy, and to address the questions above. The combination of ground/space spectroscopy with the high, angular resolution imaging performed by HST allows us to distinguish different components in the SFH of a galaxy, and to characterise them separately with the support of state-of-the-art, theoretical models of stellar evolution. When applied to star-forming galaxies in different dynamical state (non interacting, interacting, major and minor mergers), this approach makes it possible to study the modes of star formation, their amplitude and timescale, their dependence on galaxy mass and interactions, and the subsequent evolution of a galaxy.
In this paper, we make use of IUE, FUSE and HST UV spectra and photometry to “dissect” the star-formation activity occurred in the starburst galaxy NGC 7673 in the last 2 Gyr, along the lines described above. NGC 7673 belongs to the class of the Luminous Blue Compact Galaxies characterised by small sizes, high surface brightnesses, strong emission lines and blue colours (Gallagher et al. 1989). It exhibits a rather irregular and clumpy morphology, but it also displays a rather regular, face-on disk kinematics (Homeier & Gallagher 1999). It is in pair with NGC 7677 and no strong evidence for an ongoing interaction has been found. Nevertheless, its similarity with NGC 3310 (classified as a minor merger) in terms of optical and HI morphology suggests that also NGC 7673 experienced a minor merger that probably triggered the starburst phase observed at the present time (Homeier & Gallagher 1999).
The paper develops as follow: data and models used in the analysis are presented in Sect. 2. The properties of the star clusters detected in NGC 7673 are described in Sect. 3, while the parameterization adopted to study the star formation in the field in Sect. 4. The results are then discussed in Sect. 5, and the conclusions are drawn in Sect. 6.
2 The ingredients
2.1 UV spectroscopy
NGC 7673 was first observed with the International Ultraviolet Explorer (IUE) satellite in 1979 (programme JH174, PI: Heidmann) through the SWP Camera. This programme made use of the large aperture, characterised by an oval shape 10 23′′ in size, and acquired a low-resolution (FWHM 6 Å) spectrum of the galaxy in the range 1150 Å - 2000 Å with an exposure time of 18600 s (Benvenuti et al. 1982). IUE visited NGC 7673 again, in 1981 (programme JH325, PI: Heidmann), through the LWP Camera, which took a low-resolution (FWHM 6 Å) spectrum in the interval 1850 Å - 3350 Å, using the large aperture and an exposure time of 24480 s. Nineteen years later, the Far Ultraviolet Spectroscopic Explorer (FUSE) satellite acquired the spectrum of NGC 7673 between 900 Å and 1200 Å with the large, square aperture (30 30′′) and an exposure time of 10038 s (programme A023, PI: Buat, Buat et al. 2002).
Benvenuti et al. (1982) identified absorption lines typical of OB stars (e.g. SiIII 1300, SiIV 1400 and CIV 1550) in the IUE spectrum of NGC 7673. The authors determined an extinction of 0.31 mag in the B band and a dereddened luminosity at = 1550 Å of 1.91027 erg s-1 Hz-1, a factor of 100 larger than what measured for the HII region 30 Doradus in the Large Magellanic Cloud (LMC). In addition, Buat et al. (2002) detected the presence of the OIV 1032 line (due to massive O stars) and a decrease of the flux shortward of 1050 Å. They interpreted these features as the convolution of a multi-burst star-formation history (SFH, in the range between 1 and 10 Myr) with the intervention of dust extinction. The authors also derived an extinction law almost constant between 1165 Å and 1040 Å and rising at shorter wavelengths.
We matched the IUE and FUSE spectra over the range 1150 Å - 1200 Å by scaling the latter spectrum by a factor of 0.5 to compensate for the larger aperture used by FUSE.
2.2 UV imaging
Between 1996 and 1997, the Hubble Space Telescope (HST) imaged NGC 7673 with the Wide Field and Planetary Camera 2 (WFPC2) in the visible with the F555W and F814W filters, and in the UV through the F255W filter (programme ID: 6870, PI: Trauger). The observations were carried out with exposure times varying from 2300 s in the UV to 800 s for the F555W filter and 1200 s for F814W. These images were analysed by Homeier et al. (2002), who identified 268 young star clusters, mostly located in clumps. The F255W image of NGC 7673 (from Homeier et al.) is shown in Figure 1 with the IUE large aperture overlaid and the star clusters labelled.
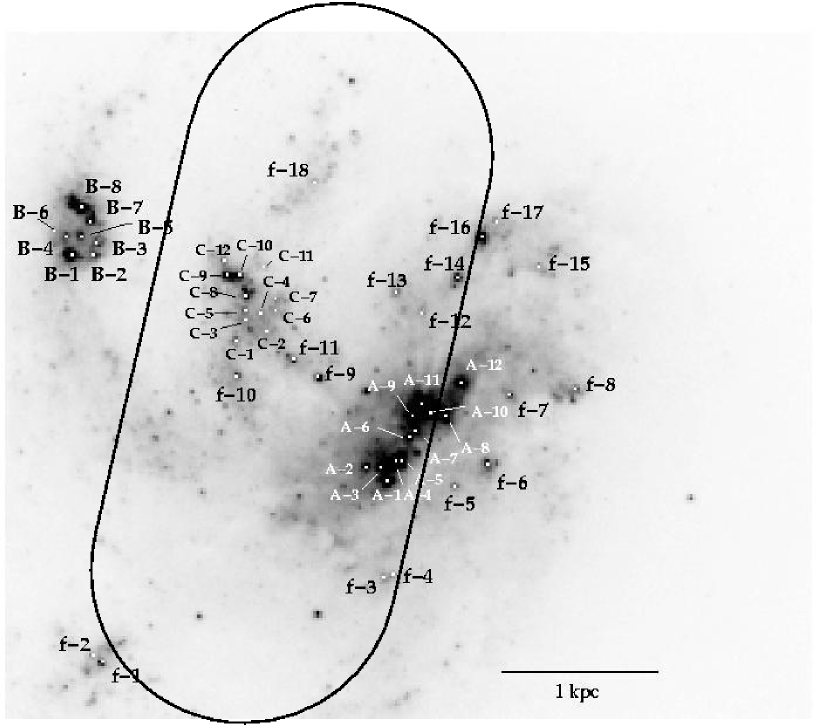
Fifty clusters have been detected in all the three filters, and their colours allowed Homeier et al. to estimate an age between 5 and 20 Myr. In particular, younger clusters seem to be located in clumps A, B, C, D while older clusters are preferentially associated with clump A. The authors measured a clusters contribution to the total light of a clump between 16 and 33.
2.3 The models
In order to determine the star-formation history of the star clusters and the stars in the field of NGC 7673, we have to compare their observed photometry and spectra with synthetic stellar populations properly convolved with a specific reddening law. We ran STARBURST99 (Leitherer et al. 1999) to compute the spectrum of an instantaneous starburst (i.e. a single stellar population) with a total mass of 106 M⊙ as a function of its age up to 2 Gyr, when its UV emissivity becomes negligible. For this purpose, we assumed the default parameters of STARBURST99 except for the metallicity that we chose to be LMC-like. This value was estimated by Duflot-Augarde & Alloin (1982) from the oxygen abundance of the interstellar medium. We adopted a multi-power law for the initial mass function (IMF) in order to approximate a Kroupa (2001) IMF; an exponent of 1.3 was chosen for stars with a mass in the range 0.1 M⊙ - 0.5 M⊙, and 2.3 for the interval 0.5 M⊙ - 100 M⊙. Only stars with a mass in the interval 8 M⊙ to 120 M⊙ were selected to produce supernovae and black holes. We chose the stellar wind and mass loss to be computed with the theoretical model, which solves for the radiative transfer and momentum equation in the stellar wind (cf. Leitherer et al. 1992). With the same parameters described above, we also ran STARBUST99 in order to synthesize the spectrum of a stellar population continuously forming stars (with a constant star-formation rate of 1 M⊙ yr-1) as a function of age up to 2 Gyr.
In order to assess the dependence of our results on the evolutionary tracks used in STARBURST99, we computed synthetic spectra from the Geneva standard tracks (GST), the Geneva tracks with high mass-loss (GHT) and the Padova tracks including the AGB evolutionary phase (PAT). The Geneva tracks are fine-tuned on the evolution of massive stars (M 10 M⊙) and on the treatment of their winds and mass loss (cf. Meynet et al. 1994), while the Padova models treat more extensively the evolution of low- and intermediate-mass stars through their post main-sequence phases (cf. Bertelli et al. 1994).
In the case of an istantaneous starburst, we redshifted the spectra synthesized with the GST, GHT and PAT evolutionary tracks to NGC 7673 ( = 0.011) and convolved them by the total throughputs of the F255W, F555W and F814W filters, in order to obtain synthetic colours to compare with the observed ones as a function of age.
3 The star clusters properties
Out of the catalogue published by Homeier et al., 50 star clusters have both the (F255W-F555W) and the (F555W-F814W) colours measured. Thirty-one of these clusters are placed within the IUE large aperture. From these two colours, we estimated the star clusters properties, i.e. age, mass, and intrinsic reddening, using the technique described in Pasquali et al. (2003). Briefly, we fitted the observed colours, corrected for the Galactic E(B-V)G = 0.043 (Schlegel et al. 1998) with the Cardelli et al.’s (1989) extinction law, to the synthetic colours of a single stellar population with a total mass of 106 M⊙ and a LMC-like metallicity. Except for stochastic effects associated with small numbers of very luminous stars, synthetic colours are not mass sensitive, but mainly depend on age and intrinsic reddening within NGC 7673. This reddening is left as a free parameter, varying between E(B-V)i = 0 and 5 mag, with a step of 0.1 mag. For a given E(B-V)i, the synthetic colours at each time point are reddened with a specific extinction law and a is calculated as the sum of the differences between the observed and the reddened synthetic colours normalized by the observational errors. The minimum value of , , defines the best-fitting age, intrinsic reddening, and synthetic V magnitude. Following the correction for the best-fitting intrinsic reddening, the difference between the observed and synthetic V magnitudes is used to estimate the cluster mass via the scaling relation:
The errors on each best-fitting parameter are given by the minimum and maximum value among all the fits which realise 1.5 (corresponding to about 2).
We have modelled the intrinsic reddening of NGC 7673 with three different extinction laws: the one proposed by Calzetti (2001) for starburst galaxies, the extinction law derived by Cardelli et al. for the Milky Way and that computed for the LMC by Fitzpatrick (1986). The Fitzpatrick’s law has been extraploted at 1000 Å, while the Cardelli et al.’s and Calzetti’s curves have been extended shortward of 1200 Å with the Sasseen et al.’s (2002) and Leitherer et al.’s (2002) extinction laws, respectively. Moreover, the Fitzpatrick’s curve has been extended at 3000 Å with the Cardelli et al.’s law; both curves assume = 3.1.
At the end, the fitting technique described above produces for each star cluster a 3 3 grid of results (for 3 sets of evolutionary tracks and 3 extinction laws), which allow us to discuss any systematic effect introduced by different evolutionary tracks, each of them reddened with 3 different extinction laws.
3.1 Ages, intrinsic reddening, and masses
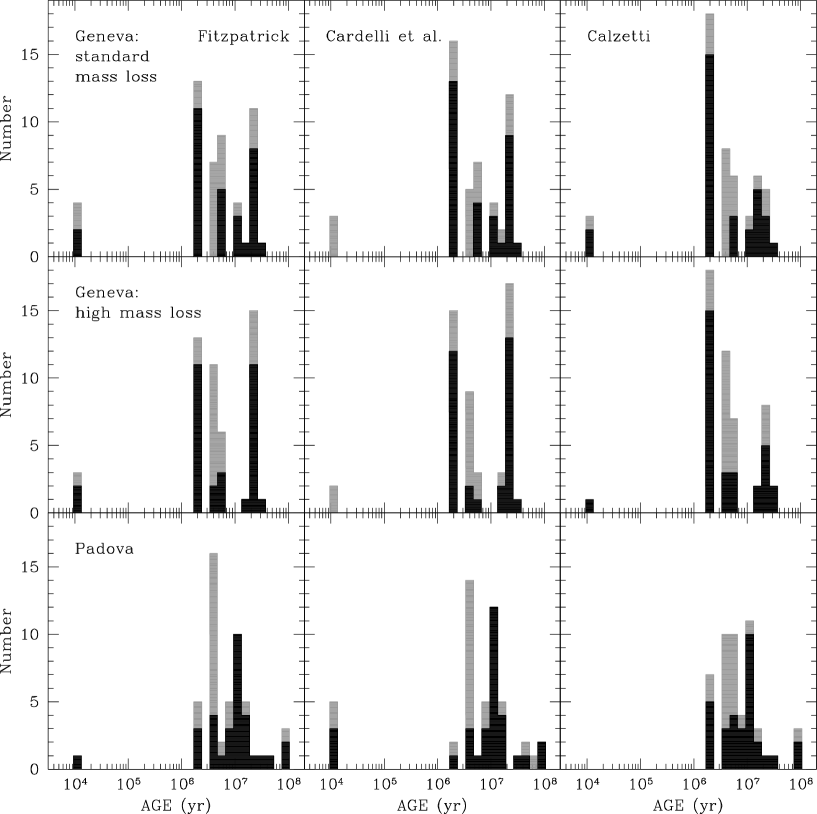
The histogram of the clusters ages is shown in Figure 2, for each combination of a set of evolutionary tracks with an assumed extinction law. In all cases, the grey shaded histogram represents the 50 star clusters detected in the 3 WFPC2 filters, while the one shaded in black outlines the age distribution of the 31 star clusters included in the IUE aperture. As expected, the cluster age largely depends on the evolutionary tracks chosen for STARBURST99, and is far less sensitive to the adopted extinction law. Irrespective of how reddening is treated, the GST and GHT evolutionary tracks clearly indicate two epochs of cluster formation, about 20 and 2 Myr ago, with minor events in between, about 3 - 6 Myr ago. On the contrary, the PAT evolutionary tracks point to a somewhat more continuous cluster formation, which took place between 2 and 100 Myr ago, with two major bursts 4 and 10 Myr ago.
Star clusters as young as 104 yr could be unresolved HII regions. The average error on these ages is about 8 Myr. As discussed in Pasquali et al. (2003, 2004), the accuracy of the age determination improves significantly when three or more colours are used in the analysis, and cover a large baseline extending from “age-sensitive” (UV) to “dust-sensitive” (I,IR) wavelengths. The individual age uncertainties are plotted in Figure 3, where the ages derived with the GST and PAT tracks are compared with the values obtained with the GHT models for each different extinction law. Clearly, the rather large errors do not allow us to discriminate among the various evolutionary tracks, and make plausible both the cluster formation histories described above.
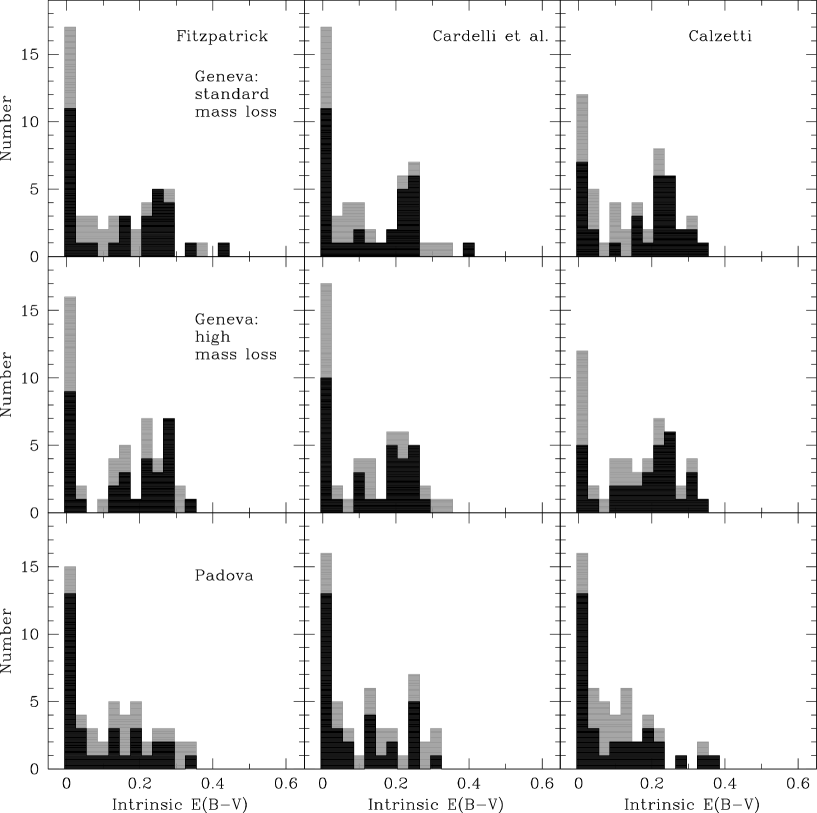
The intrinsic cluster reddening does not exceed the value E(B-V)i 0.4 mag (see Figure 4) and, for a large number of star clusters, is 0 E(B-V)i 0.25 mag, independently of the adopted extinction law. No significant dependence of the best-fitting reddenings on the evolutionary tracks is observed. The average uncertainty on E(B-V)i is about 0.05 mag.
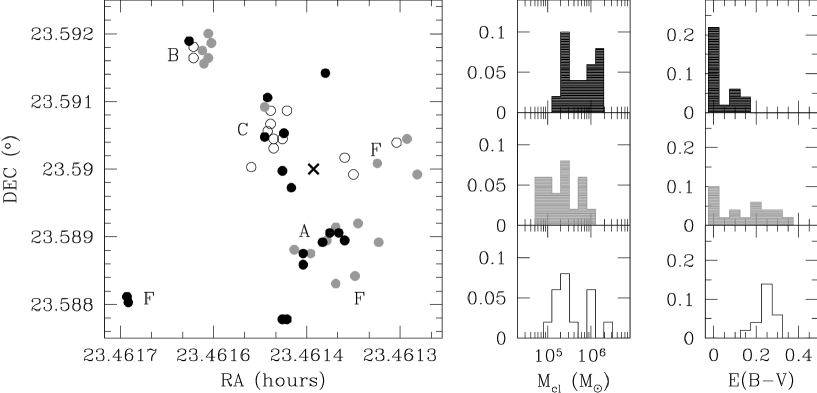
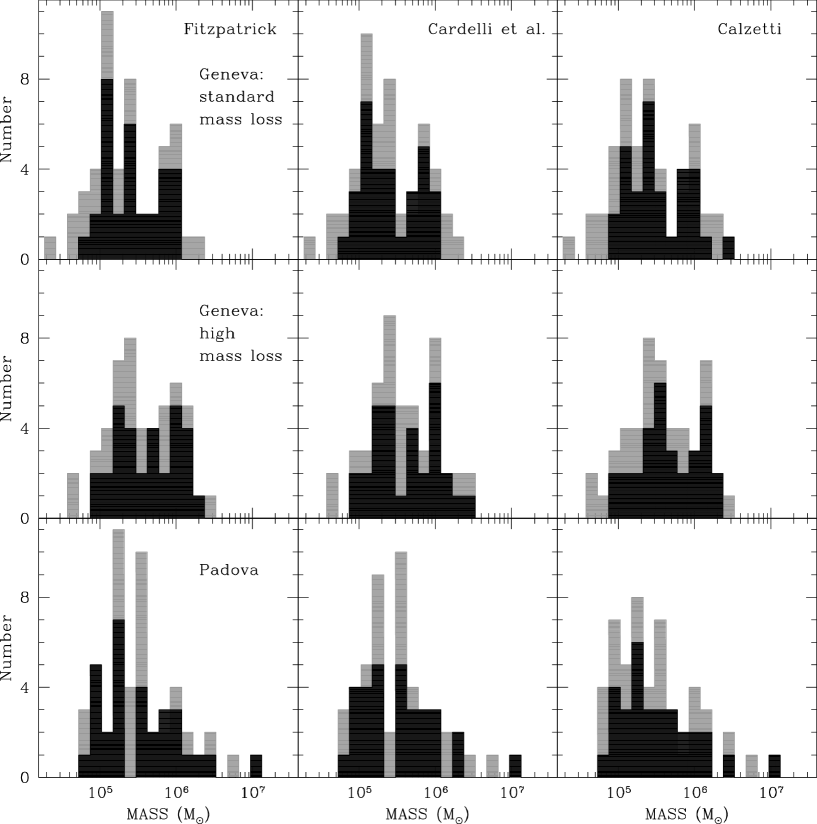
Given that the clusters mass is computed from the observed absolute magnitude corrected for the best-fitting reddening, it is itself sensitive to the adopted extinction law and is generally lower than 2 106 M⊙. The individual mass errors are shown in Figure 7 for the different evolutionary tracks and extinction laws; on average they are about 3105 M⊙.
We have splitted the full sample of star clusters into three groups on the basis of their estimated age as obtained from the GHT tracks and the Fitzpatrick’s extinction law: the young sample with ages 2.5 Myr, the intermediate one between 2.5 and 8 Myr, and the old sample with ages 8 Myr. These groups are represented in Figure 8 with open, grey and black circles, respectively, and are plotted as a function of their RA and DEC (J2000) coordinates. The clumps originally identified by Homeier et al. are also labelled with the letters A, B and C, while F indicates the clusters in the field. Modulo the large age uncertainty discussed above, the star clusters of NGC 7673 seem to get younger as their displacement in the NE direction from clump A increases. The distributions of these groups in mass and intrinsic reddening are also traced in Figure 8. It could be observed that, for increasing age, the clusters tend to be less obscured and more massive; but this trend can well be due to the depth of the data, since, for a given U magnitude, intrinsically older clusters need to be more massive and less extinguished than the younger ones in order to be detected. These results also hold for the Cardelli et al.’s and Calzetti’s laws.
3.2 UV spectra
The age and mass derived from the photometry can now be used to construct, with the help of STARBURST99, the UV spectrum of each cluster for different evolutionary tracks and extinction laws. The correction for dust obscuration is twofold: first, each spectrum at restframe wavelength is reddened by E(B-V)i via a given extinction law assumed to represent the obscuration within NGC 7673. The spectrum is then redshifted to the distance of NGC 7673 ( = 0.011) and estinguished by the Galactic E(B-V)G through the Cardelli et al.’s extinction law. Clearly, this procedure can be used with the best-fitting values of age, mass and intrinsic reddening as well as with the lower and upper limits computed for these parameters. The spectra of all clusters are then summed together in what we refer to as the clusters integrated spectrum and compared with the observed FUSE/IUE spectrum of NGC 7673, in order to check the contribution of the clusters to the total emission of the galaxy and the systematic effects due to the observed photometry and the fitting technique.
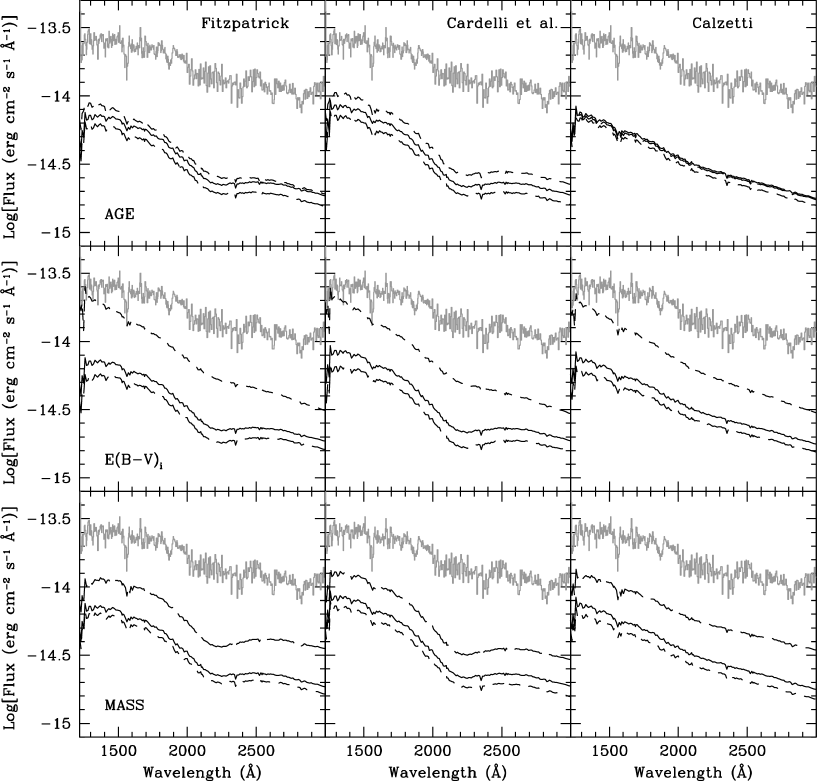
The clusters integrated spectrum computed from the GHT tracks and for different extinction laws is plotted in Figure 9. Here, the black solid line represents the clusters integrated spectrum obtained for the best-fitting values of age, mass and E(B-V)i, while the black short- and long-dashed lines trace, respectively, the clusters integrated spectrum derived for the lower and upper limits of these parameters. The observed IUE spectrum of the galaxy is shown with a grey solid line. The clusters integrated spectrum is on average 2 mag fainter than the observed IUE spectrum of the galaxy; the inclusion of errors in the clusters intrisic reddening or mass is able to make it about 1 mag fainter than the galaxy spectrum (cf. lower, right-hand side panel of Figure 9). At the mean wavelength of the WFPC2 F255W filter (2578 Å), the clusters integrated spectrum contributes about 20 to the galaxy light (between 15 and 38, when errors are taken into account) independently of any of the extinction laws in use. This contribution turns out to be insensitive also to the adopted set of evolutionary tracks. Using the F255W image of NGC 7673, Homeier et al. estimated a mean cluster contribution of 24, in agreement with what we measured for the portion of galaxy included in the IUE slit. We then can not use this value to constrain the extinction law that best represents the dust obscuration within NGC 7673 among the three used in this paper. Since Duflot-Augarde & Alloin (1982) and Gallagher et al. (1989) measured for NGC 7673 a LMC-like metallicity, we only discard the extinction law by Cardelli et al., and from now on we will apply the Fitzpatrick’s and Calzetti’s laws.
4 Star formation in the field
As Figure 9 indicates in its left-hand side panels, star clusters in NGC 7673 contribute only 20 to the UV emission of their parent galaxy. Homeier et al. determined the completeness of their clusters sample in the F555W filter as a function of magnitude and background level. The latter is indeed quite variable given the clumpy morphology of NGC 7673. For the highest background level, the authors estimated a recovery fraction of about 50 at = 26 mag, increasing to 98 at = 21.5 mag. Since the clusters involved in our analysis (those with two measured colours) are brighter than 22 mag, we assume for them a completeness level larger than 90. This should guarantee a high statistical significance to any further analysis of the clusters properties.
The next step is then to constrain the nature of the remaining 80 of the flux in the FUSE/IUE spectrum of NGC 7673, which we assume to be arising from the stellar population in the field. Specifically, we aim at deriving the star-formation history (SFH) of the field, and checking whether the field is consistent with being composed by stars born in clusters later disrupted by their gravitational interaction with the galaxy. We have proceeded by assuming a specific SFH for the field, which has been i) reddened according to the prescription in Sect. 3.2 and with the Fitzpatrick’s and Calzetti’s laws as representing the intrinsic dust absorption of the galaxy; ii) summed to the clusters integrated spectrum (computed with the Fitzpatrick’s and Calzetti’s laws) and iii) fitted to the observed FUSE/IUE spectrum of the galaxy with a minimum approach. As discussed by Meynet et al. (1994), the Geneva tracks with a high mass loss rate are preferable in modelling the evolution of massive stars (i.e. young ages of a stellar population), since they better reproduce the low luminosity observed for some Wolf-Rayet stars, the surface chemical composition of WC and WO stars, and the ratio of blue to red supergiants in the star clusters in the Magellanic Clouds. For this reason, the modelling of the field SFH in NGC 7673 has been restricted only to the GHT tracks.
4.1 Continuous star formation
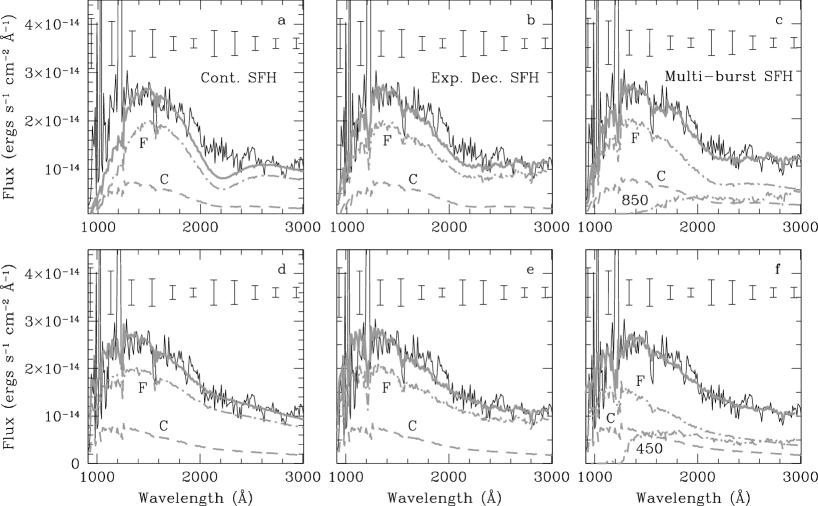
For our first attempt, we have used the STARBURST99 spectra of a population continuously forming stars with a constant rate of 1 M⊙ yr-1 computed as a function of age (see Sect. 2.3). The best fit to the observed FUSE/IUE spectrum of NGC 7673 is shown in panels a and d of Figure 10, for the Fitzpatrick’s and Calzetti’s extinction law respectively. Here, the dashed grey line traces the clusters integrated spectrum (labelled with C), the dot-dashed grey line represents the field spectrum resulting from its continuous SFH (labelled with F), the solid grey line is the sum of the clusters integrated spectrum with the field best-fitting SFH. The observed spectrum is shown in black; the vertical errorbars indicate a 1 error on the measured FUSE/IUE fluxes. The field best-fitting SFHs are described by an age of about 650 Myr (Fitzpatrick) or 610 Myr (Calzetti), an intrinsic reddening E(B-V)i 0.5 mag and a star-formation rate of about 20 M⊙ yr-1 (Fitzpatrick) or 26 M⊙ yr-1 (Calzetti). The reduced realized by these fits is 2.5 and 0.8 for the Fitzpatrick’s and Calzetti’s extinction law respectively. In the case of the Fitzpatrick’s law, the best fit underestimates the flux shortward of 1300 Å and overestimates the bump at 2200 Å; on the contrary, the fit obtained with the Calzetti’s law nicely reproduces the observed FUSE/IUE spectrum of the galaxy. Nevertheless, both extinction laws give a reddening for the field larger than the range computed for the star clusters, and a star-formation rate dramatically higher than the value derived from the H emission line ( 1 M⊙ yr-1, Schmitt et al. 2006).
4.2 Exponentially decaying star formation
The STARBURST99 models of a single stellar population as a function of age calculated for the star clusters in Sect. 3 can be used to define an exponentially decaying SFH for the field:
where is the lookback time from now at =0 to the initial burst occurred = 2 Gyr ago with a star-formation rate , is the e-folding time needed for the SFR to decrease by a factor , and is the star-formation rate at lookback time . The choice of = 2 Gyr is dictated by the fact that the UV emissivity of a stellar population becomes negligible at ages older than this value. Fitting the above formula to the observed FUSE/IUE spectrum of NGC 7673 constrains the -folding time of the star-formation activity in the field, the field reddening, the initial and present-day star-formation rate. The best-fitting spectrum of the field is plotted in panels b and e of Figure 10 for each of the adopted extinction laws. Both SFHs match the observed spectrum quite tightly with a reduced of 1.6 and 1.2 for the Fitzpatrick’s and Calzetti’s extinction laws respectively. Once again, the spectrum of the field computed with the Fitzpatrick’s law overestimates (at 1.5 level) the bump at 2200 Å. The field stellar population is best reproduced by a star-formation history which begun with a burst about 2 Gyr ago and an initial rate of 16 M⊙ yr-1 (Fitzpatrick) or 13 M⊙ yr-1 (Calzetti), it fades with an -folding time of 700 Myr (Fitzpatrick) or 900 Myr (Calzetti), so that the present-day star-formation rate is of 1 M⊙ yr-1. The dust obscuration in the field corresponds to E(B-V) 0.13 mag, consistent with the average reddening determined for the star clusters.
4.3 Multi-burst star formation
A “multi-burst” scenario is a third, alternative scenario for the SFH of the field in NGC 7673. Here, the assumption is that the bursts of star formation, which produced the observed star clusters, also built up the field stellar population. We have thus scaled the clusters integrated spectrum to properly fit the FUSE/IUE spectrum of NGC 7673 at 1500 Å and added an older, single stellar population with a total mass to match the observed spectrum at redder wavelengths. The best-fitting spectrum is shown in panels c and f of Figure 10. The best-fitting SFH requires the field to have a young component (with an age 40 Myr) 3 (Fitzpatrick, or 2 with Calzetti’s law) times brighter than the clusters (assuming the same reddening distribution), and an unobscured component as old as 850 Myr (Fitzpatrick) or 450 Myr (Calzetti). This old population turns out to be as massive as 4109 M⊙ (Fitzpatrick) or 2109 M⊙ (Calzetti). The reduced realized by this best-fitting spectrum is 1.2 (Fitzpatrick) or 0.9 (Calzetti), comparable with the value obtained for the exponentially decaying SFH. In the case of the Fitzpatrick’s extinction law, the multi-burst SFH fits the bump at 2200 Å slightly better than the exponentially decaying SFH.
4.4 Comparisons
The best-fitting spectra obtained in Figure 10 clearly rely on the accuracy of the clusters integrated spectrum, hence on the accuracy achieved in estimating the age, reddening and mass of the star clusters from their photometry. We have shown in Figure 9 how the clusters integrated spectrum varies as a function of the errors implied by our “photometric” clusters dating technique. We can thus repeat the above analysis of the field SFH using the variations of the clusters integrated spectrum, in order to assign an uncertainty to the field best-fitting parameters. For example, in the case of a continuous SFH, the age of the field stellar population turns out to be 650 Myr (Fitzpatrick) or 610 Myr (Calzetti), and the star-formation rate 20 M⊙ yr-1 (Fitzpatrick) or 26 M⊙ yr-1 (Calzetti), while the reddening does not vary from E(B-V) = 0.5 mag. In the hypothesis of an exponentially decaying SFH, we obtain = 700 Myr (Fitzpatrick) or 900 Myr (Calzetti), an initial star-formation rate of 16 M⊙ yr-1 (Fitzpatrick) or 13 M⊙ yr-1 (Calzetti), and E(B-V) = 0.12 mag (Firzpatrick) or 0.13 mag (Calzetti). Finally, for the multi-burst/Fitzpatrick SFH, the field young stellar population ranges from being a factor of 2 fainter than the star clusters to being about 4 times brighter, while the older component turns out to have a mass of 4 109 M⊙ and a reddening between 0 and 0.04 mag. In the case of the multi-burst SFH computed with the Calzetti’s law, the field can be as bright as the clusters or 3 times brigther. The mass of the older component ranges between 1 and 2 109 M⊙ and its reddening is negligible. We then conclude from these comparisons that, within the errors of our clusters dating technique, the SFHs obtained with the Fitzpatrick’s law are consistent with those computed assuming the Calzetti’s law. For this reason, in what follows we will make use of quantities averaged between the estimates given by the two extinction laws.
5 Discussion
Inspection of Figure 10 immediately rules out that the field of NGC 7673 is undergoing a continuous star-formation activity with a constant rate of about 20 M⊙ yr-1 or more. The other two scenarios, of an exponentially decaying and a multi-burst SFH, are in better agreement with the observed FUSE/IUE spectrum of NGC 7673 and its H SFR, and fit this spectrum equally well. Both parameterized SFHs can be used to constrain the radiation field and the stellar mass of the galaxy, and to investigate the nature of the field as built up by disrupted clusters.
5.1 Radiation field
In the hypothesis of an exponentially decaying SFH, the field stellar population would form stars with a present-day rate of 1 M⊙ yr-1. A similar value has been computed by Schmitt et al. (2006) from the H emission of the galaxy, a factor of about 4 lower than the star-formation rate derived from far-IR observations ( 4.9 M⊙ yr-1). It has to be specified that the value derived by Schmitt et al. is a lower limit to the true star-formation rate in the optical, since the authors did not correct the observed H flux for intrinsic reddening but only for the Galactic extinction. Since this H flux was originally measured by McQuade et al. (1995) together with the H flux, it is then possible to estimate the reddening affecting the nebular emission lines. Under recombination case B, the observed ratio leads to a nebular reddening = 0.78, which, following Kaler & Lutz (1985), can be translated into E(B-V) 0.5 mag (0.54 mag including the Galactic extinction). Applying the Fitzpatrick’s extinction law gives a dereddened H flux 210-12 erg cm-1 s-1, hence, for a distance of 49 Mpc (Homeier et al. 2002), a luminosity 6.61041 erg s-1. Such a nebular reddening seems to be quite high when compared with the values derived for the star clusters (see Figure 4) and the stellar continuum. A stellar E(B-V) = 0.12 mag as estimated for the exponentially decaying SFH (0.16 mag adding the Galactic extinction) would translate into a reddening of 0.36 mag for the gas, hence it would give a H luminosity of 4.21041 erg s-1. When using the formula:
(cf. Kennicutt 1998), these two values give a star-formation rate between 3.3 and 5.2 M⊙ yr-1, still consistent with the results of our best-fitting, exponentially decaying SFH.
A reddening-free H emission provides us with an independent check of the reliability of our SED modelling. McQuade et al. (1995) measured the H flux of NGC 7673 within a circular aperture equivalent in area to the IUE slit. As shown by Homeier and Gallagher (1999), the H emission is spatially associated with the clumps (A, B and C in Figure 1) detected at other wavelengths. Therefore, any difference in the positioning of the aperture with respect to the IUE slit becomes quite critical, and may affect the measured line flux. In what follows, we assume the H flux of McQaude et al. to be representative of the emission occurring within the IUE slit, and we use it to estimate the balance between the ionizing photons emitted by the cluster and field stars and those needed to sustain the H luminosity. For a given IMF, the number N(H0) of ionizing photons emitted per second at 912 Å critically depends on the mass and age of the stars and less significantly on their metallicity (Leitherer & Heckman 1995). Stars of OB spectral types and Wolf-Rayet stars dominate N(H0), which, in the case of an instantaneous burst, peaks during the first 5 Myr and sharply declines at older ages. The best-fitting exponentially decaying SFHs, produce N(H0)field 1.51053 photons per second. This has to be added to the contribution from the star clusters alone, N(H0)clusters 3.41053, in order to derive a total N(H0)total of 4.91053 photons per second. The uncertainties in our cluster dating technique and SED modelling place a lower and upper limit to N(H0)total of 2.51053 and 11054 s-1, respectively. The number of ionizing photons can also be computed from the measured H luminosity via the relation:
(cf. Leitherer & Heckman 1995). We derive N(H0)Hα between 3.11053 [for = 4.21041 erg s-1] and 4.91053 photons s-1 [for = 6.61041 erg s-1], consistent with N(H0)total.
In the case of a multi-burst SFH, the best-fitting SEDs in Figure 10 give N(H0) 1.11054 photons s-1. Once all the uncertainties on the best fit are taken into account, N(H0)multi-burst turns out to vary between 2.9 1053 and 2.51054 s-1 similarly to both N(H0)total and N(H0)Hα. Given that the multi-burst SFH is based on star clusters that are younger than the exponentially decaying SFH, it thus predicts a higher number of ionizing photons.
In conclusion, the stars produced in clusters and in the field via either an exponentially decaying or a multi-burst SFH emitt a number of ionizing photons large enough to sustain the H luminosity. The errors in the modelling of the observed UV stellar continuum would allow the ionizing photons to escape with an average fraction of about 50 (cf. Weedman 1991).
5.2 Stellar mass
The star clusters within the IUE slit lock up a total mass Mclusters = 2107 M⊙. The stellar mass of the field population clearly depends on the parameterization of its star-formation history. In the case of an exponentially decaying SFH, the stellar mass in the field is M = 1.11010 M⊙. Since Mclusters is about only 0.2 of M, the total stellar mass of NGC 7673 enclosed in the IUE slit is still M = 1.11010 M⊙. The best-fitting, multi-burst SFH gives M = 3109 M⊙, a factor of 3 smaller than M. This discrepancy is not surprising, since the star clusters are biased towards younger ages than the exponentially decaying SFH and intrinsically brighter at ultraviolet wavelengths; hence, the multi-burst SFH requires a lower mass to match the observed FUSE/IUE spectrum. Clearly, the above values of M and M are a lower limit to the true stellar mass of NGC 7673, given that they have been measured for the area of the galaxy covered by the IUE slit and only from the UV portion of the galaxy spectrum. These mass estimates do not take into account the population of older/colder stars emitting at optical and infrared wavelengths.
For comparison, the HI mass measured by Pisano et al. (2001) amounts to 4.1109 M⊙ and the dynamical mass inferred from the HI line profile is 2.51010 M⊙. The latter has been estimated assuming an inclination angle = 45 15 degrees and within a radius of 8.3 kpc, a factor of about 4 larger than the optical Reff of the galaxy (Reff = 1.9 kpc, Pisano et al. 2001). On the contrary, the IUE slit covers only about half of the UV/optical extension of NGC 7673. Therefore, scaling the stellar mass, either M or M, by this factor of 2 would make it comparable with the dynamical mass of the galaxy.
The exponentially decaying SFH with a present-day rate of 1 M⊙ yr-1 as derived from the UV data would not be able to consume the HI gas in a Hubble time. If a rate of 5 M⊙ yr-1 is instead considered (as derived from the mid-IR and as an upper limit to the rate estimated from the stellar populations), the same SFH would exaust the HI gas still present in NGC 7673 in about 2 Gyr, possibly transforming this clumpy-irregular galaxy into an early-type (this timescale does not take into account the gas returned by stars via winds and supernova explosions).
5.3 Clusters disruption
According to Figure 10, a multi-burst SFH fits reasonably well the FUSE/IUE spectrum of NGC 7673. There are two ways of interpreting such a star-formation history. A first approach considers the star clusters and the field population as formed through the same bursts of star formation. Alternatively, the field population may have arised only from the disruption of the star clusters. How plausible this scenario is depends on the dynamical evolution of star clusters.
Two main timescales rule the dynamical state of a star cluster, namely the relaxation and the disruption time. The relaxation time is the time for a cluster to reach equilibrium between the kinetic energy distribution of its stars and its potential well. Gravitational interactions among stars of different mass have the effect of accelerating low-mass stars, which may leave the cluster (evaporation), while more massive stars sink into the inner region of the cluster leading to mass segregation and core-collapse. Wielen (1988) computed the relaxation time of an isolated cluster as a function of its mass , effective radius and number of stars Nstars:
where G is the gravitational constant. According to this equation, low-mass clusters with a small radius have a short (thus evaporate faster) than more massive and extended clusters. Larsen (2004) measured the size of young star clusters in 18 nearby spiral galaxies, obtaining a mean 3 pc, very weakly dependent on clusters age or mass. Therefore, a star cluster with = 105 M⊙ and = 3 pc has = 1.6106 yr, while for a cluster with = 107 M⊙ is a factor of 10 shorter. The comparison of these timescales with the cluster masses shown in Figure 6 clearly indicates that the star clusters detected in NGC 7673 survive to their relaxation. A more realistic computation of has to take into account the gravitational interaction between a star cluster and its parent galaxy, which truncates the cluster outskirts. Unfortunately, no tidal radius is known for young star clusters, and in this case their can not be estimated.
The disruption time is the time for tidal interactions with the parent galaxy to destroy the star clusters, and depends on the clusters density, so that less-dense clusters are more easily disrupted by their environment. Internal stellar evolution, that can decrease the cluster density via stellar mass loss and supernova explosions, accelerates the cluster disruption. Boutloukos & Lamers (2003) determined the disruption time of star clusters in four galaxies as a function of their initial mass function and their age distribution. They found a large variation in depending on the galaxy luminosity and morphology, from 40 Myr in M51 to 8 Gyr in the SMC. de Grijs et al. (2003) derived 30 Myr for the star clusters in M82, with an uncertainty of a factor of 2. This value is comparable with the age of 20 Myr computed for about half of the star clusters in the area of NGC 7673 sampled by the IUE slit. This could then support the hypothesis whereby the field population older than 20 Myr formed in NGC 7673 through the disruption of star clusters. We could also speculate that the field population younger than 20 Myr is composed by star clusters too faint to be detected in the HST images. Unfortunately, the sample of star clusters is too small to allow for an accurate computation of in NGC 7673 with the method of Boutloukos & Lamers. A similar scenario has been also advocated by Chandar et al. (2005) to explain the nature of the diffuse ultraviolet light in 12 nearby starburst galaxies.
6 Conclusions
We have used archival data publicly available for NGC 7673 to describe the recent star formation history that produced the young star clusters and the field stellar population in this galaxy. We applied the photometric dating technique of Pasquali et al. (2003) to the (F255W-F555W) and (F555W-F814W) colours of 50 star clusters identified with HST by Homeier et al. (2002), and made use of STARBURST99 models based on the Geneva evolutionary tracks with high stellar mass loss and computed with a LMC-like metallicity. For the comparison between observed and synthetic colours we adopted three extinction laws: Cardelli et al. (1989, for the Milky Way), Calzetti (2001, for starburst galaxies) and Fitzpatrick (1986, for the LMC), respectively. We have found that, independently of the assumed extinction law:
- there are two prominent epochs of cluster formation, about 20 Myr and 2 Myr ago (see also Homeier et al. 2002), with somewhat minor events between 3 Myr and 6 Myr ago.
- The cluster intrinsic reddening E(B-V)i is lower than 0.4 mag; the large majority of clusters have 0 E(B-V) 0.25 mag.
- The cluster mass is lower than 2106 M⊙.
Out of these 50 star clusters, we have selected 31 placed within the boundaries of the IUE large slit that was used to acquire the UV spectrum of NGC 7673 between 1150 Å and 3350 Å. For each cluster, we built a synthetic spectrum (with STARBURST99) corresponding to the age and mass derived from the cluster photometry, and we estinguished it with each extinction law and its corresponding E(B-V)i as recovered from the colours measured for the cluster. All these 31 synthetic spectra were then added together in the clusters integrated spectrum. All the adopted extinction laws ensure a ratio of 20 between the clusters integrated spectrum and the observed IUE spectrum at = 2578 Å (the mean wavelength of the F255W filter), in agreement with the same ratio measured on the HST images by Homeier et al. ( 24).
The observed IUE spectrum (extended to 900 Å with the FUSE data collected for NGC 7673) and the clusters integrated spectrum have allowed us to estimate the recent star-formation history of the field stellar population in this galaxy. We have found that:
- an exponentially decaying or a multi-burst star-formation history fits equally well the observed FUSE/IUE spectrum.
- The best-fitting exponentially decaying SFH is defined by an initial star-formation rate 16 M⊙ yr-1 (Fitzpatrick) or 13 M⊙ yr-1 (Calzetti), an e-folding time 700 Myr (Fitzpatrick) or 900 (Calzetti), and started approximately 2 Gyr ago.
- A multi-burst SFH assumes that the same bursts of star formation that produced the star clusters built up also the field population. The best-fitting multi-burst SFH is characterised by a component as young as the star clusters (hence younger than 40 Myr, see Figure 2) and a component as old as 850 Myr (Fitzpatrick) or 450 Myr (Calzetti). The young component is a factor of about 2 - 3 brighter than the star clusters and the mass of the old component is estimated between 2 and 4 109 M⊙ (i.e. about 100 - 200 times more massive than the star clusters together).
The star-formation histories of the star clusters and the field population together produce a number of ionizing photons large enough to sustain the H emission of NGC 7673, if not to allow also for an escape fraction of 50. The stellar mass of the galaxy enclosed in the IUE slit varies between 3109 M⊙ (from the multi-burst SFH) to 11010 M⊙ (from the exponentially decaying SFH). Given that the IUE slit encompasses about half of the optical extension of the galaxy, a correction of a factor of 2 should give roughly the total stellar mass of NGC 7673 locked up in stars younger than 2 Gyr.
Acknowledgments
We would like to thank P. Benvenuti, J.S. Gallagher, F.C. van den Bosch and H.-W. Rix for valuable discussions.
References
- (1) Benvenuti, P., Casini, C., Heidmann, J., 1982, MNRAS, 198, 825
- (2) Bertelli, G., Bressan, A., Chiosi, C., Fagotto, F., Nasi, E., 1994, A&A Suppl. Ser., 106, 275
- (3) Boutloukos, S.G., Lamers, H.J.G.L.M., 2003, MNRAS, 338, 717
- (4) Buat, V., Burgarella, D., Deharveng, J.M., Kunth, D., 2002, A&A, 393, 33
- (5) Calzetti, D., 2001, PASP, 113, 1449
- (6) Cardelli, J.A., Clayton, G.C., Mathis, J.S., 1989, ApJ, 345, 245
- (7) Chandar, R., Leitherer, C., Tremonti, C.A., Calzetti, D., Aloisi, A., Meurer, G.R., De Mello, D., 2005, ApJ, 628, 210
- (8) Cowie, L.L., Songaila, A., Hu, E.M., Cohen, J.G., 1996, AJ, 112, 839
- (9) Croton, D.J., Springel, V., White, S.D.M., De Lucia, G., Frenk, C.S., Gao, L., Jenkins, A., Kauffmann, G., Navarro, J.F., Yoshida, N., 2006, MNRAS, 365, 11
- (10) de Grijs, R., Bastian, N., Lamers, H.J.G.L.M., 2003, MNRAS, 340, 197
- (11) Duflot-Augarde, D., Alloin, D., 1982, A&A, 112, 257
- (12) Fitzpatrick, E.L., 1986, AJ, 92, 1068
- (13) Gallagher, J.S., Hunter, D.A., Bushouse, H., 1989, AJ, 97, 700
- (14) Homeier, N., Gallagher, J.S., 1999, ApJ, 522, 199
- (15) Homeier, N., Gallagher, J.S., Pasquali, A., 2002, A&A, 391, 857
- (16) Hubble, E., 1926, ApJ, 64, 321
- (17) Jimenez, R., Bernardi, M., Haiman, Z., Panter, B., Heavens, A.F., 2006, submitted to ApJ (astro-ph/0610724)
- (18) Kauffmann, G., Heckman, T.M., White, S.D.M. et al., 2003, MNRAS, 341, 33
- (19) Kaler, J.B., Lutz, J.H., 1985, PASP, 97, 700
- (20) Kennicutt, R.C.Jr., 1998, ARAA, 36, 189
- (21) Knapen, J., Beckman, J.E., cepa, J., van der Hulst, J.M., Rand, R.J., 1992, ApJL, 385, L37
- (22) Kroupa, P., 2001, MNRAS, 322, 231
- (23) Larsen, S.S., 2004, A&A, 416, 537
- (24) Larsen, S.S., 2004, in Planets to Cosmology: Essential Science in Hubble’s Final Years, ed. M. Livio, STScI, May 2004 (astro-ph/0408201)
- (25) Leitherer, C., Heckman, T.M., 1995, ApJS, 96, 9
- (26) Leitherer, C., Li, I.-H., Calzetti, D., Heckman, T.M., 2002, ApJS, 140, 303
- (27) Leitherer, C., Robert, C., Drissen, L., 1992, ApJ, 401, 596
- (28) Leitherer, C., Schaerer, D., Goldader, J.D. et al., 1999, ApS, 123, 3
- (29) Madau, P., Ferguson, H., Dickinson, M., Giavalisco, M., Steidel, C.C., Fruchter, A., 1996, MNRAS, 283, 1388
- (30) McQuade, K., Calzetti, D., Kinney, A.L., 1995, ApJS, 97, 331
- (31) Meurer, G.R., Heckman, T.M., Leitherer, C., Kinney, A., Robert, C, Garnett, D.R., 1995, AJ, 110, 2665
- (32) Meynet, G., Maeder, A., Schaller, D., Charbonnel, C., 1994, A&A Suppl. Ser., 103, 97
- (33) Pasquali, A., de Grjis, R., Gallagher, J.S., 2003, MNRAS, 345, 161
- (34) Pasquali, A., Gallagher, J.S., de Grjis, R., 2004, A&A, 415, 103
- (35) Pisano, D., Kobulnicky, H., Guzman, R., Gallego, J., Bershady, M., 2001, AJ, 122, 1194
- (36) Sanders, D.B., Mirabel, I.F., 1996, ARAA, 34, 749
- (37) Sasseen, T.P., Hurwitz, M., Dixon, W.V., Airieau, S., 2002, ApJ, 566, 267
- (38) Schlegel, D., Finkbiener, D., Davis, M., 1998, ApJ, 500, 525
- (39) Schmitt, R., Calzetti, D., Armus, L., Giavalisco, M., Heckman, T.M., Kennicutt, R.C.Jr., Leitherer, C., Meurer, G.R., 2006, ApJ, 643, 173
- (40) Searle, L., Sargent, W.L.W., Bagnuolo, W.G., 1973, ApJ, 179, 427
- (41) Weedman, D., 1991, in Massive Stars in Starbursts, eds. C. Leitherer, N. Walborn, T. Heckman & C. Norman (Cambridge: Cambridge University Press), p. 317
- (42) Wielen, R., 1988, in The Harlow-Shapley Symposium on Globular Cluster Systems in Galaxies, eds. J.E. Grindlay and A.G. Davis Philip (Kluwer:Dordrecht), p. 393