Precision Measurements of the Stop Quark Mass at the ILC
Abstract
Most supersymmetric models predict new particles within the reach of the next generation of colliders. For an understanding of the model structure and the mechanism(s) of electroweak symmetry breaking, it is important to know the masses of the new particles precisely. The measurement of the mass of the scalar partner of the top quark (stop) at an collider is studied. A relatively light stop is motivated by attempts to explain electroweak baryogenesis and can play an important role in dark matter annihilation. A method is presented which makes use of cross-section measurements near the pair-production threshold as well as at higher center-of-mass energies. It is shown that this method does not only increase the statistical precision, but also reduces the influence of systematic uncertainties, which can be important. Numerical results are presented, based on a realistic event simulation, for two signal selection strategies: using conventional selection cuts, and using an Iterative Discriminant Analysis (IDA). While the analysis of stops is particularly challenging due to the possibility of stop hadronization and fragmentation, the general procedure could be applied to many precision mass measurements.
pacs:
14.80.LySupersymmetric partners of known particles and 95.35.+dDark matter (stellar, interstellar, galactic, and cosmological)1 Introduction
Supersymmetric particles are likely to be produced and observed in high-energy proton-proton collisions at the LHC. However, it will be difficult to confirm their identity as superpartners of the known Standard Model particles and to measure their properties precisely. For this, one needs experiments at a linear collider such as the proposed ILC at GeV.
An experiment at the ILC will be able to make many precise measurements from which particle properties, and ultimately, the outlines of a particle physics model may be inferred. Due to the high statistical precision expected at the ILC, the optimization of the systematic errors is of particular importance. We have studied one specific example, the extraction of the mass of a scalar top quark from cross-section measurements near threshold. We have devised a method which reduces most systematic uncertainties and leads to a potentially very accurate measurement of the stop quark mass. This method is general and could be applied to other particles that are pair-produced in an collider.
The method relies on the comparison of production rates at two different center-of-mass energies, and knowledge of how the cross-section varies as a function of and the mass of the particle.
We have chosen the case of a light scalar top with a mass not much higher than the mass of the lightest neutralino since production of this particle was already extensively studied in an ILC context. It was concluded that a conventional approach to the measurement of the stop quark mass culminated in an uncertainty of about 1 GeV carena . The new method improves substantially on this result. The presented results are preliminary and being finalized ayres .
For this analysis, we have performed realistic simulations of the signal and backgrounds, and used two techniques to separate the signal from the background. The first technique is based on conventional sequential cuts, while the second employs an Iterative Discriminant Analysis (IDA). Furthermore, the hadronization followed by fragmentation of the stop has been included and we have carefully studied the systematic uncertainties arising from this and other sources.
There are theoretical motivations for studying a light stop quark with a small mass difference. Specifically, we evoke a scenario within the Minimal Supersymmetric extension of the Standard Model (MSSM) which is able to explain the dark matter density of the universe as well as the baryon asymmetry through the mechanism of electroweak baryogenesis carena .
A small mass difference between the stop and the lightest neutralino can help to bring the dark matter relic density into the observed region due to co-annihilation between the stop and the neutralino. For this mechanism to be effective, the typical mass difference is rather small, GeV. The dominant decay mode of the stop is , resulting in a final state with two soft charm jets and missing energy.
Previous methods to determine the scalar top quark mass were discussed for the SPS-5 benchmark ( GeV) susy05 and results are summarized in Table 1. For the cosmology motivated benchmark with GeV and GeV, an experimental precision of GeV was obtained carena , and about GeV including theoretical uncertainties. The following study investigates the same signal scenario and it is based on the same background reactions and event preselection.
| Method | (GeV) | luminosity |
|---|---|---|
| Polarization | 0.57 | |
| Threshold scan | 1.2 | |
| End point | 1.7 | |
| Minimum mass | 1.5 |
2 Mass Determination Method
This method proposes to derive the stop mass from measurements at two center-of-mass energies, one measuring the stop production cross-section near the threshold (th), and the other measuring it at a center-of-mass energy where the cross-section has approximately a peak (pk). Using both measurements leads to a cancellation of systematic uncertainties in the mass determination. A parameter is defined as
| (1) |
where is the total number of expected events after event selection and the number of corresponding background events, is the stop production cross-section, the selection efficiency, and the luminosity. The center-of-mass energies 260 and 500 GeV have been chosen. Near the threshold, the production cross-section is very sensitive to the stop mass.
In this study we assume that the ILC will operate primarily at GeV with a total luminosity of fb-1, and a small luminosity of fb-1 will be collected at GeV. Table 2 summarizes the expected production cross-sections. The detector response was modeled with the SIMDET package including the LCFI vertex detector concept.
| Process | (pb) at | (pb) at | ||||
|---|---|---|---|---|---|---|
| 0/0 | -.8/+.6 | +.8/-.6 | 0/0 | -.8/+.6 | +.8/-.6 | |
| 0.032 | 0.017 | 0.077 | 0.118 | 0.072 | 0.276 | |
| 16.9 | 48.6 | 1.77 | 8.6 | 24.5 | 0.77 | |
| 1.12 | 2.28 | 0.99 | 0.49 | 1.02 | 0.44 | |
| 1.73 | 3.04 | 0.50 | 6.14 | 10.6 | 1.82 | |
| 5.1 | 6.0 | 4.3 | 7.5 | 8.5 | 6.2 | |
| , | 49.5 | 92.7 | 53.1 | 13.1 | 25.4 | 14.9 |
| 0.0 | 0.0 | 0.0 | 0.55 | 1.13 | 0.50 | |
| 2-photon | 786 | 936 | ||||
| GeV | ||||||
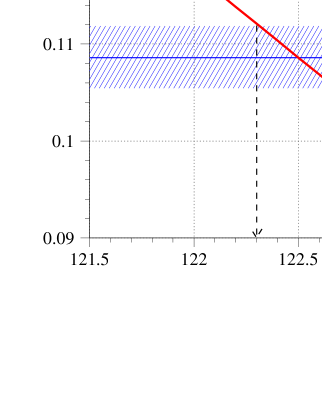
The relation of the observable and the stop mass is used to determine the stop mass with precision. For example a variation of by 3% in a realistic scenario would lead to an uncertainty of the stop mass GeV as illustrated in Fig. 1.
3 Sequential-cut Analysis
In order to cancel the systematic uncertainties to a large extent with the described method, the same sequential cuts are applied for the and 500 GeV analyses. Details of the event selection are given in Table 3 and the results are given in Table 4.
| Variable | ||
|---|---|---|
| number of charged tracks | ||
| visible energy | ||
| event long. momentum | ||
| event transv. momentum | GeV | GeV |
| thrust | ||
| Number of jets | ||
| extra-jet veto | GeV | GeV |
| charm tagging likelihood | ||
| di-jet invariant mass | or | or |
| signal efficiency | 0.340 | 0.212 |
| generated | generated | |||||
|---|---|---|---|---|---|---|
| 0/0 | .8/-.6 | 0/0 | .8/-.6 | |||
| 50,000 | 544 | 1309 | 50,000 | 5170 | 12093 | |
| 180,000 | ||||||
| 30,000 | ||||||
| 210,000 | ||||||
| 210,000 | ||||||
| , | 350,000 | |||||
| — | ||||||
| 2-photon | ||||||
| total background | — | — | ||||
4 Iterative Discriminant Analysis (IDA)
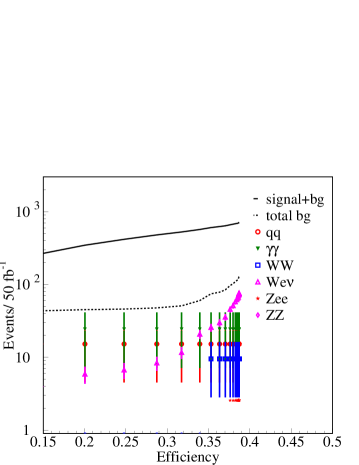
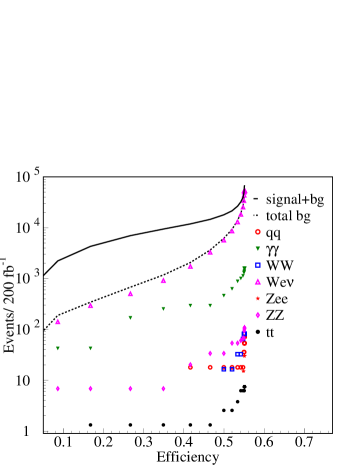
The Iterative Discriminant Analysis (IDA) is applied to increase the discriminant power between signal and background compared to the sequential-cut-based analysis, and thus reduce the statistical uncertainty in the stop mass measurement. Figures 2 and 3 give the results of expected number of background events as a function of the signal efficiency. The chosen working points have efficiencies of 38.7% and 41.6% for the and 500 GeV analyses, respectively. Table 5 lists the corresponding expected background events.
| generated | generated | |||||
|---|---|---|---|---|---|---|
| 0/0 | .8/-.6 | 0/0 | .8/-.6 | |||
| 50,000 | 50,000 | |||||
| 180,000 | ||||||
| 30,000 | ||||||
| 210,000 | ||||||
| 210,000 | ||||||
| , | 350,000 | |||||
| — | ||||||
| 2-photon | ||||||
| total background | — | — | ||||
5 Systematic Uncertainties
Both the sequential-cut-based analysis and the IDA method lead to a small statistical uncertainty resulting in GeV and thus systematic uncertainties are particularly important to evaluate. Three classes of systematic uncertainties are distinguished:
-
•
instrumental uncertainties related to the detector and accelerator: detector calibration (energy scale), track reconstruction efficiency, charm-quark tagging efficiency, and integrated luminosity.
-
•
Monte Carlo modeling uncertainty of the signal: charm and stop fragmentation effects. The Peterson fragmentation function was used with (OPAL). For (OPAL) and (ALEPH) an average uncertainty of 15% was taken, and a factor 2 improvement at the ILC has been assumed, leading to where . Fragmentation effects and gluon radiation increase the number of jets significantly and the importance of c-quark tagging is stressed in order to resolve the combinatorics.
-
•
neutralino mass GeV.
-
•
theoretical uncertainties on the signal and background. Some improvement compared to the current loop calculation techniques is assumed, and an even larger reduction of this uncertainty is anticipated before the start of the ILC operation.
Tables 6 and 7 list the systematic uncertainties for the sequential-cut analysis and the IDA. The systematic uncertainty using the IDA method from detector calibration (energy scale) is larger. This is because the sequential-cut analysis pays particular attention to cancellation of this uncertainty between the two analyses at the different center-of-mass energies.
| error on | rel. shift on signal eff. | |||
|---|---|---|---|---|
| variable | variable | error on | ||
| energy scale | ||||
| negligible | ||||
| charm tagging | taken to be | |||
| luminosity | – | |||
| charm fragmentation | ||||
| stop fragmentation | ||||
| neutralino mass | 0.3 GeV | 3.8% | 3.0% | 0.8% |
| background estimate | – | 0.8% | 0.1% | 0.8% |
| error on | rel. shift on signal eff. | |||
|---|---|---|---|---|
| variable | variable | error on | ||
| energy scale | ||||
| negligible | ||||
| charm tagging | taken to be | |||
| luminosity | – | |||
| charm fragmentation | ||||
| stop fragmentation | ||||
| neutralino mass | 0.3 GeV | 3.7% | 1.6% | 2.2% |
| background estimate | – | 0.3% | 0.2% | 0.1% |
6 Mass Determination
The assessment of the achievable stop mass precision is based on the statistical and systematic uncertainties on the observable (eq. (1)) as summarized in Table 8. The IDA method has a smaller statistical uncertainty, and also a smaller background uncertainty due to a smaller number of expected background events. The expected stop mass uncertainty is inferred from the uncertainty on as given in Table 9.
| error source for | sequential cuts | IDA method |
|---|---|---|
| statistical | 3.1% | 2.7% |
| detector effects | 0.9% | 2.4% |
| charm fragmentation | 0.6% | 0.5% |
| stop fragmentation | 0.7% | 0.7% |
| neutralino mass | 0.8% | 2.2% |
| background estimate | 0.8% | 0.1% |
| sum of experimental systematics | 1.7% | 3.4% |
| sum of experimental errors | 3.5% | 4.3% |
| theory for signal cross-section | 5.5% | 5.5% |
| total error | 6.5% | 7.0% |
| measurement error (GeV) | ||
|---|---|---|
| error category | sequential cuts | IDA method |
| statistical | ||
| sum of experimental systematics | ||
| beam spectrum and calibration | ||
| sum of experimental errors | ||
| sum of all exp. and th. errors | ||
7 Cold Dark Matter (CDM) Interpretation
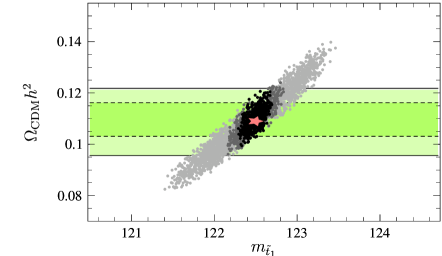
The chosen benchmark parameters are compatible with the mechanism of electroweak baryogenesis carena . They correspond to a value for the dark matter relic abundance within the WMAP bounds, . The relic dark matter density has been computed as in Ref. carena . The assumed benchmark parameters changed slighty (larger slepton masses assumed) and changed from 0.1122 carena to 0.109. In the investigated scenario, the stop and lightest neutralino masses are GeV and GeV, and the stop mixing angle is , i.e. the light stop is almost completely right-chiral. The improvement compared to Ref. carena regarding the CDM precision determination is shown in Fig. 4 and summarized in Table. 10.
| (GeV) | ||
|---|---|---|
| exp. and th. errors | 0.42 | |
| stat. and exp. errors only | ||
| sequential-cut analysis | 0.24 | |
| IDA | 0.28 |
8 Conclusions
Scalar top quarks could be studied with precision at a future International Linear Collider (ILC). The simulations for small stop-neutralino mass difference are motivated by cosmology. The precision mass determination at the future ILC is possible with a method using two center-of-mass energies, e.g. and 500 GeV. This method can also be applied to other analyses to improve the mass resolution in searches for new particles. The precision of two independent analysis methods, one with a sequential-cuts and the other with an Interative Discriminant Analysis (IDA) lead to very similar results. The new proposed method increases the mass precision by about a factor of three due to the error cancellation using two center-of-mass energies with one near the production threshold. Including experimental and theoretical uncertainties, the mass of a 122.5 GeV scalar top could be determined with a precision of 0.42 GeV. The interpretation of this benchmark scenario leads to a uncertainty on of and which is about a factor two better compared to previous results, and comparable to current cosmological (WMAP) measurement uncertainties. With the new stop mass determination, the stop mass uncertainty is no longer the dominant uncertainty in the calculation.
References
- (1) M. Carena, A. Finch, A. Freitas, C. Milsténe, H. Nowak and A. Sopczak, Phys. Rev. D72 (2005) 115008.
- (2) A. Freitas, C. Milsténe, M. Schmitt and A. Sopczak, arXiv:0712.4010.
- (3) A. Sopczak, M. Carena, A. Finch, A. Freitas, C. Milstene and H. Nowak, SUSY’05, Durham, UK, published on-line, hep-ph/060213 (2006).