Abstract
Scalar top studies at the ILC are reviewed from initial sensitivity studies to a new precision mass determination method.
1 Introduction
Scalar top quarks have been studied in the framework of the ILC for more than a decade. In the following the developments since the International Linear Collider (ILC) workshop in Morioka 1995, where detection sensitivity was demonstrated, to recent precision mass determinations are presented. The interplay with accelerator and detector aspects is addressed through the importance of beam polarization for the accuracy of scalar top mass and mixing angle determination, and c-quark tagging for the vertex detector development. Different methods of scalar top mass determinations are addressed. Particular attention is given to the scenario of small stop-neutralino mass differences. The importance of scalar top studies at the ILC for the determination of the Cold Dark Matter (CDM) rate is emphasized. A new precision mass determination method, using two center-of-mass energies, one near the production threshold, improves significantly the scalar top mass, as well as the CDM prediction. The signal signature is two charm jets and missing energy from the process
2 Early Studies
3 Developments from Morioka’95 to Sitges’99 to Jeju’02
At Morioka’95 the initial sensitivity was demonstrated for a luminosity of 10 fb-1 and GeV using a LEP detector modeling. Higher luminosities (500 fb-1) have been assumed based on the accelerator developments and presented at Sitges’99 [2]. In addition, an Iterative Discriminant (IDA) method was applied to separate expected signal and background events [2]. Figure 1 shows also the improvements in mass and mixing angle determination ( GeV) including beam polarization and the SGV detector modeling. Subsequently, the SIMDET detector description was used. Slightly higher precision was obtained in the neutralino channel including and beam polarization ( GeV), and the chargino decay mode was studied ( GeV) [3].


4 Major Challenge to Develop a Vertex Detector for the ILC
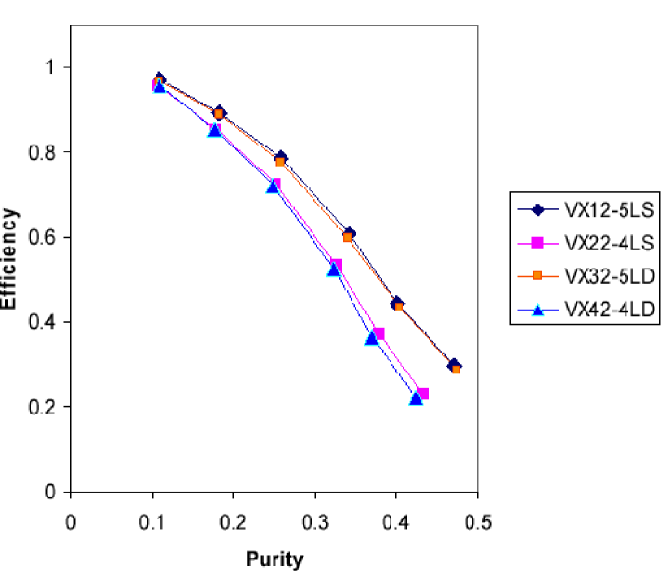
During the LEP era (1989-2000 data-taking) the tagging of b-quarks with a vertex detector was a major ingredient for many searches. The importance of c-quark tagging for scalar top studies was realized. Key aspects are the distance between the interaction point and the innermost layer of the vertex detector (radiation hardness, beam background) and the material absorption length (multiple scattering). A realistic vertex detector concept from the LCFI collaboration was implemented for c-quark tagging in the scalar top studies. Such a detector could consist of 5 CCD layers at 15, 26, 37, 48 and 60 mm, each layer with absorption length.
The importance of the vertex detector was studied with two different vertex detector configurations, one with 4 layers (removing the innermost layer), and the other one with 5 layers. The study was performed at GeV for a scenario with large visible energy in the detector (Fig. 2) [4] ( GeV and GeV), and one with small visible energy ( GeV and GeV) leading to very similar results [5]. The innermost layer has a large effect on the c-tagging performance, while doubling the detector thickness has a small effect.
5 Signal Scenarios
In order to investigate different detector scenarios and applying benchmark reactions for large and small visible energy three scalar top scenarios have been studied:
-
•
For a comparison between different detector descriptions (SGV and SIMDET simulation packages) previous studies used GeV and GeV.
-
•
At the Snowmass’01 workshop the SPS-5 benchmark was established using MSSM parameters yielding GeV and GeV.
-
•
A cosmology motivated scenario has been studied in detail GeV and GeV, including a sequential-cut-based analysis and using the IDA method.
In the first two scenarios the stop-neutralino mass difference is large and thus large visible energy is expected in the detector, while in the third scenario small visible energy is expected [7]. The stop decay mode is always .
6 Typical Analysis Strategy
Since the study for the Jeju’02 workshop the basic analysis strategy remained unchanged and signal and background processes have been generated for 500 fb-1 and GeV. A detector simulation (SIMDET) has been applied and a neural-network-based c-quark tagging algorithm has been used. The event selection has been performed with a sequential-cut-based analysis and an Iterative Discriminant Analysis (IDA).
7 Four Different Methods of Mass Determination
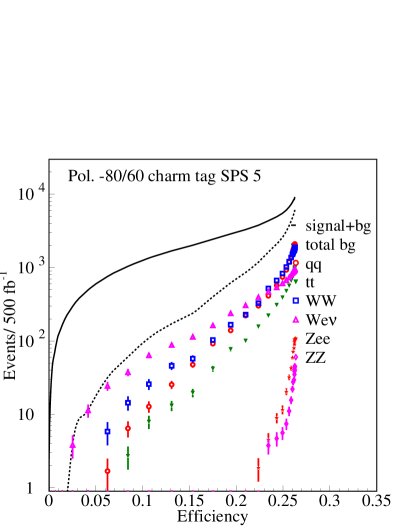
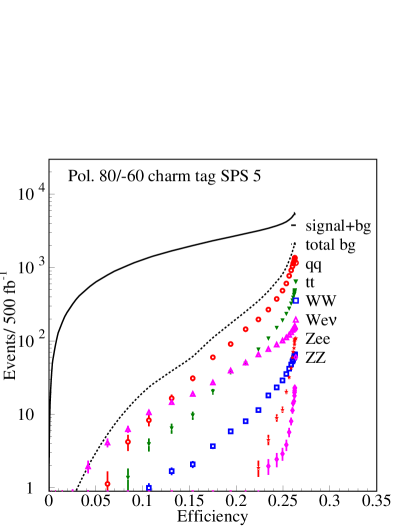
Four different methods of mass determination were studied. Two methods, which use the IDA for optimization of the signal to background ratio, are: a) stop cross-section determination with different beam polarizations (Fig. 3), and b) threshold dependence of production cross-section. Two cut-based selections were used in order to minimize the distortion of final state observables: c) endpoint of jet energy spectrum, and d) minimum mass of jets. These methods were discussed for the SPS-5 benchmark ( GeV) [6] and results are summarized also in Fig. 3.
| Method | (GeV) | luminosity |
|---|---|---|
| Polarization | 0.57 | |
| Threshold scan | 1.2 | |
| End point | 1.7 | |
| Minimum mass | 1.5 |
8 Small Stop-Neutralino Mass Difference
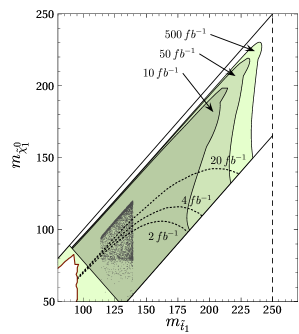
A small stop-neutralino mass difference is motivated by cosmological aspects, baryogenesis and Dark Matter where is the Cold Dark Matter (CDM) candidate. A CDM rate consistent with observations is expected for a small mass difference (co-annihilation). The discovery reach is shown for GeV and GeV [7] (Fig. 4).
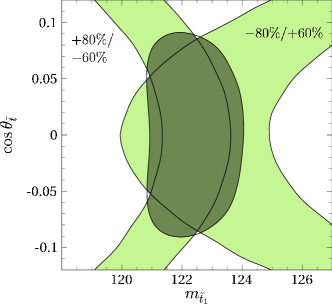
For this small-mass-difference benchmark the determination of stop mass and mixing angle were performed as for the previously described large mass difference scenario. In the case of and polarization GeV and was obtained, while for polarization only GeV and was achieved [7].
For the CDM interpretation the following systematic uncertainties were taken into account: GeV, polarization , background rate , scalar top hadronization and fragmentation (), c-quark tagging (), detector calibration (), and beamstrahlung: (). The sum of the systematic uncertainties is 1.3% (left-handed beam polarization) and 1.2% (right-handed beam polarization) without the theory error on the cross-section. As the total systematic uncertainty is similar to the statistical uncertainty, a reduction to was assumed being the same as the statistical uncertainty, taking into account the LEP experience. Including the expected theory uncertainty GeV was achieved. The resulting CDM prediction included all parameters and their errors. The stop mass uncertainty is dominant for the CDM co-annihilation precision.
9 New Precision Mass Determination
In order to improve the mass resolution, a new method has been proposed to measure the stop cross-section at two center-of-mass energies, one of them near the kinematic threshold where the cross-section is very sensitive to the stop mass, and the other near the expected maximum production cross-section [8]. The center-of-mass energies GeV and GeV are chosen. This study also includes a more detailed description of the stop hadronization and fragmentation in the event simulation. Details are given in Ref [9]. For the event selection a sequential-cut-based analysis and the IDA method have been applied.
Both the sequential-cut-based analysis and the IDA method lead to small statistical uncertainties resulting in GeV and thus systematic uncertainties are particularly important to evaluate. Four classes of systematic uncertainties are distinguished:
-
•
instrumental uncertainties related to the detector and accelerator: detector calibration (energy scale), track reconstruction efficiency, charm-quark tagging efficiency, and integrated luminosity.
-
•
Monte Carlo modeling uncertainty of the signal: charm and stop fragmentation effects. The Peterson fragmentation function was used with (OPAL). For (OPAL) and (ALEPH) an average uncertainty of 15% was taken, and a factor 2 improvement at the ILC has been assumed, leading to where . Fragmentation effects and gluon radiation increase the number of jets significantly and the importance of c-quark tagging is stressed in order to resolve the combinatorics.
-
•
neutralino mass GeV.
-
•
theoretical uncertainties on the signal and background. Some improvement compared to the current loop calculation techniques is assumed, and an even larger reduction of this uncertainty is anticipated before the start of the ILC operation.
The systematic uncertainty using the IDA method from detector calibration (energy scale) is large (Table 1). This is because the sequential-cut-based analysis pays particular attention to cancellation of this uncertainty between the two analyses at the different center-of-mass energies.
The assessment of the achievable stop mass precision is based on the statistical and systematic uncertainties on an observable which is constructed from ratios of luminosities, selection efficiencies and theoretical production cross-sections at the two center-of-mass energies. The IDA method has a smaller statistical uncertainty, and also a smaller background uncertainty due to a smaller number of expected background events. The expected stop mass uncertainty is inferred from the uncertainty on (Table 1), as given in Table 2.
| Error source for | sequential cuts | IDA method |
| Statistical | 3.1% | 2.7% |
| Detector calibration | 0.9% | 2.4% |
| Charm fragmentation | 0.6% | 0.5% |
| Stop fragmentation | 0.7% | 0.7% |
| Neutralino mass | 0.8% | 2.2% |
| Background estimate | 0.8% | 0.1% |
| Sum of experimental systematics | 1.7% | 3.4% |
| Sum of experimental errors | 3.5% | 4.3% |
| Theory for signal cross-section | 5.5% | 5.5% |
| Total error | 6.5% | 7.0% |
| measurement error (GeV) | ||
|---|---|---|
| Error category | sequential cuts | IDA method |
| Statistical | ||
| Sum of experimental systematics | ||
| Beam spectrum and calibration | ||
| Sum of experimental errors | ||
| Sum of all exp. and th. errors | ||
10 Cold Dark Matter (CDM) Interpretation
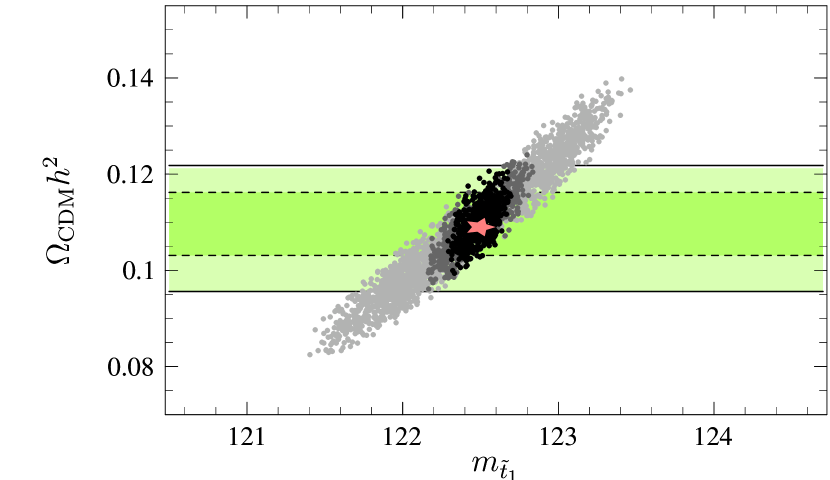
The chosen benchmark parameters are compatible with the mechanism of electroweak baryogenesis [7]. They correspond to a value for the dark matter relic abundance within the WMAP bounds, . The relic dark matter density has been computed as in Ref. [7]111 The assumed benchmark parameters changed slighty (larger slepton masses assumed) and thus changed from 0.1122 [7] to 0.109.. In the investigated scenario, the stop and lightest neutralino masses are GeV and GeV, and the stop mixing angle is almost completely right-chiral. The improvement compared to Ref. [7] regarding the CDM precision determination is shown in Fig. 5 [8].
| (GeV) | ||
|---|---|---|
| Exp. and th. errors | 0.42 | |
| Stat. and exp. errors only | ||
| Cut-based analysis | 0.24 | |
| IDA | 0.28 |
11 Conclusions
Over the last decade the studies on scalar top quarks evolved from first expected detection sensitivity (Morioka’95) to precision mass determination and Cold Dark Matter predictions. The beam polarization is important for mass and mixing angle determination, and the polarization contributes in addition. Detector simulations include c-quark tagging as a benchmark for vertex detector design studies. Different detector descriptions (SIMDET and SGV) agree and dedicated simulations with SPS-5 parameters were performed. Simulations for small stop-neutralino mass difference have been performed including hadronization and fragmentation effects, leading to a larger number of jets. An important aspect of this cosmology-motivated benchmark scenario is to resolve the jet-combinatorics by identifying the c-quark jets. Precision mass determinations are possible with a method using two center-of-mass energies, e.g. and 500 GeV and the expected ILC precision on is comparable to WMAP measurements. The ILC has a large potential to measure with precision scalar top quarks. Scalar top quark studies have addressed important questions related to accelerator and detector aspects. The proposed new method to measure the stop mass with higher precision can also be applied to many other searches for new particles.
References
- [1] A. Sopczak, Talk “Supersymmetric Top Discovery Potential at a 500 GeV LC”, Workshop on Physics and Experiments with Linear Colliders, Morioka, Japan, Proc. Word Scientific (1996) p. 571.
- [2] A. Sopczak, Talk “Scalar Quark”, Worldwide Workshop on the Future of e+e- Colliders, Sitges, Spain, Proc. World Scientific (2001) p. 347.
- [3] A. Sopczak, Talk “Precision Measurements in the Scalar Top Sector of the MSSM”, Worldwide Linear Collider Workshop, Jeju, Korea, Proc. Sorim Press (2003) p. 157.
- [4] C. Milsténe and A. Sopczak, Econf C0508141:ALCPG1431, Snowmass’05 (2005).
- [5] C. Milsténe and A. Sopczak, physics/0609017, Proc. LCWS’06, Bangalore, in press.
- [6] A. Sopczak, M. Carena, A. Finch, A. Freitas, C. Milstene, H. Nowak, SUSY’05, Durham, UK, published on-line, hep-ph/060213 (2006).
- [7] M. Carena, A. Finch, A. Freitas, C. Milsténe, H. Nowak and A. Sopczak, Phys. Rev. D72 (2005) 115008.
- [8] A. Freitas, C. Milsténe, M. Schmitt and A. Sopczak, arXiv:0712.4010 (2007).
- [9] C. Milsténe, A. Freitas, M. Schmitt and A. Sopczak, these proceedings.