Andromeda IV: a new Local Volume very metal-poor galaxy
And IV is a low-surface brightness (LSB) dwarf galaxy at the distance of 6.1 Mpc, projecting close to M 31. In this paper the results of spectroscopy of And IV the two brightest HII regions with the SAO 6-m telescope (BTA) are presented. In both of them the faint line [OIII]4363 Å was detected that allowed us to determine their O/H by the classical Te method. Their values of 12+(O/H) are equal to 7.490.06 and 7.550.23, respectively. The comparison of these direct O/H determinations with the two most reliable semi-empirical and empirical methods shows their good consistency. For And IV absolute blue magnitude of MB=–12.6, our value of O/H corresponds well to the ‘standard’ relation between O/H and LB for dwarf irregular galaxies (DIGs). And IV appears to be a new representative of the extremely metal-deficient gas-rich galaxies in the Local Volume. The very large range of M(HI) for LSB galaxies with close metallicities and luminosities indicates that the simple models of LSBG chemical evolution are too limited to predict such striking diversity.
Key Words.:
galaxies: abundances – galaxies: dwarf – galaxies: evolution – galaxies: individual: And IV1 Introduction
The very metal-poor galaxies were discovered more than 35 years ago. The first and the most extreme of them was I Zw 18 (Searle & Sargent SS72 (1972)). This galaxy, as well as the great majority of about five dozen known to date late-type galaxies with the ISM value of 12+(O/H)7.65 (or Z(ISM)Z⊙/10)111The solar value of 12+(O/H), according to Asplund et al. (Solar04 (2004)), is accepted to be equal to 8.66. (called eXtremely Metal-Deficient, or XMD galaxies. See, e.g., review by Kunth & Östlin Kunth2000 (2000)) are blue compact galaxies (BCGs). BCGs are low-mass galaxies with intense current starburst, distinguished by strong emission-line spectra typical of HII regions. They represent a small fraction of late-type low-mass galaxies in the local Universe (a few percent). XMD BCGs, in turn, comprise only 2% of known BCGs (e.g., Pustilnik et al. 2003a ; Kniazev et al. Kniazev03 (2003)). The main interest to this small group is related to the similarity of their properties to those predicted for high-redshift young galaxies.
Some of these XMD BCGs can themselves be rather young galaxies, with ages of their oldest stars less than 1–2 Gyr. These include Tol 65 (Papaderos et al. Papa99 (1999)), SBS 0335–052 E,W (Papaderos et al. Papa98 (1998), Pustilnik et al. 2004b ) and DDO 68 (Pustilnik et al. DDO68 (2005, 2007)). However, the majority of XMD BCGs are likely older objects related to more quiescent progenitor low-mass galaxies such as dwarf irregular (DIGs) and LSB dwarf galaxies. The concrete variants of possible evolutionary path-ways of XMD BCGs could be elucidated with their detailed multiwavelength studies.
There are also about 15 of DIGs and LSB dwarf galaxies among XMD objects. The majority of them are situated in the Local and the nearby groups, or in the general field of the Local Volume (D 10 Mpc). They include Leo A and GR 8 (van Zee et al. vZee06 (2006)), Sextans A and B (Skillman et al. Skillman89 (1989); Kniazev et al. Sextans (2005)), UGC 4483 (Izotov & Thuan IT02 (2002)), DDO 53 (Pustilnik et al. 2003b ), UGCA 292 (van Zee vZee00 (2000)), SDSS J1215+5223 (Kniazev et al. Kniazev03 (2003)), ESO489–56 (Ronnback & Bergvall RB95 (1995)). All these XMD galaxies are at the distances from 0.7 to 5 Mpc. There are three more XMD LSBDs at the distances from 6.5 to 25 Mpc. Predominantly small distances of mentioned DIGs and LSBD galaxies (in comparison to those of XMD BCGs) are due to a selection effect. It is currently possible to obtain the good quality spectra of ‘modest’ HII regions in such objects only for sufficiently close distances.
Thanks to their proximity, such galaxies can be studied in more detail at many wavelengths. Hence, the origin of their very low metallicity can be understood better and then the same question can be addressed to XMD BCGs. The number of known XMD LSB galaxies is only nine, of which only four are at the distances closer than 6 Mpc. Therefore, the discovery of one more such object is useful in order to address the group properties and their possible diversities as the appearance of different evolutionary path-ways or initial or environmental conditions. Here we report that And IV, a LSB dwarf in the Local Volume with unusually high ratio M(HI)/L13 (Chengalur et al. Chengalur07 (2007)), is one more XMD galaxy.
And IV, discovered more than 30 years ago by van den Bergh (vdBergh72 (1972)), is projected close to the position of M 31 (at 41.9′ from M 31 centre) and during long time its nature was uncertain. It was identified as a background dwarf galaxy not related to M 31 after the HST photometry of its individual stars by FGW. With its integrated blue magnitude =16.6 and the distance of 6.1 Mpc (FGW, Karachentsev et al. CNG (2004)), its absolute magnitude is MB=12.6. With the central SB of mag arcsec-2 it should be assigned as a LSB dwarf. Due to the proximity of a bright star (10m) to the main body of the galaxy, its study is not easy. FGW obtained H images of And IV and identified six HII regions in the body. For four of them they obtained spectra with 4.2-m WHT telescope, covering the range of 3700 to 7200 Å. For three the brightest HII regions (No. 3, 4 and 6 on their nomenclature) they estimated oxygen abundances by the empirical R23 method. These abundances appeared close each to other, with a mean of 12+(O/H)=7.90. We reanalysed their spectra, adding to their list of emission lines the faint line [OIII]4363 Å, visible in their plots for spectra of HII regions No. 3 and 4. The resulting O/H, derived via the classical Te method, appeared about a factor of two lower (albeit with rather large uncertainty) than that derived by FGW. To elucidate the real metallicity of And IV and to improve the estimate of its O/H, we conducted the spectroscopy of these HII regions with the SAO 6-m telescope (BTA).
2 Observational data and reduction
2.1 Observations
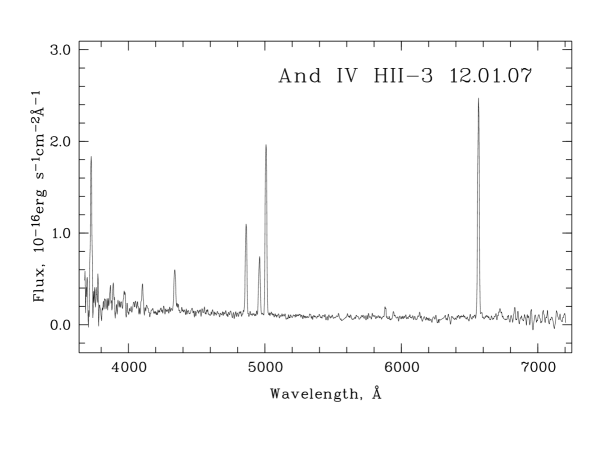
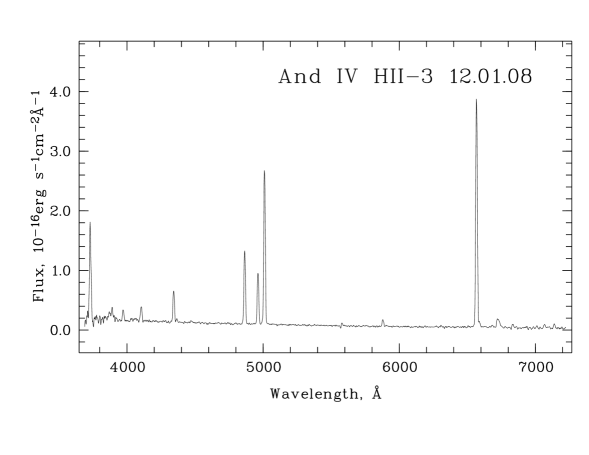
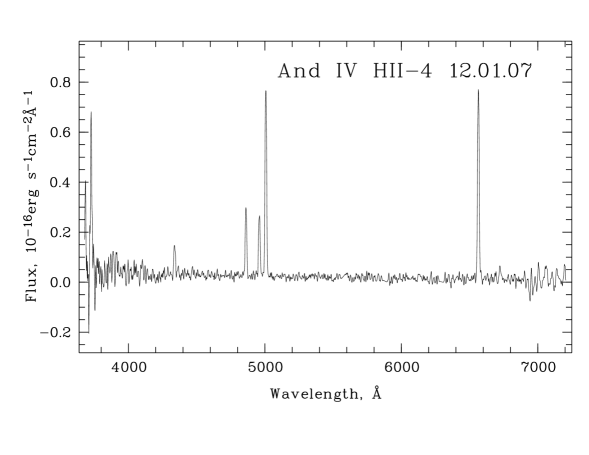
The long-slit spectral observations were conducted with the SCORPIO multimode instrument (Afanasiev & Moiseev SCORPIO (2005)) installed in the BTA prime focus, during the nights of January 12, 2007 and January 12, 2008. The grism VPHG550G was used with the 2K2K CCD detector EEV 42-40. This allowed to registrate the range of 3500–7500 Å with the scale of 2.1 Å pixel-1 and the instrumental profile width of FWHM12 Å. The scale along the slit, after binning, was 0357 pixel-1, with the total extent of 6′. On January 12, 2007 the slit (with width of 1.0″) was positioned along the direction connecting the two HII regions of interest (No. 3 and 4), that corresponded to the PA of –26°. Parallactic angles during the exposure time varied between 60° and 67° and the zenith distances – between 38° and 52°. Six 15-min exposures were obtained under the seeings of FWHM2.5–2.9″. For observations on January 12, 2008 the long slit crossed only the brightest HII-region No. 3 at PA=PA=–132.5°. Parallactic angles during the exposure time varied between between 63° and 58.6°, while the zenith distances – between 48° and 56°. In the latter case the slit orientation was rather close to the direction along atmospheric refraction, so its effect was insignificant. Four 15-min exposures were obtained under the seeing of FWHM1.3″. Both nights were photometric. The object spectra were complemented before and after by the reference spectra of He–Ne–Ar lamp for the wavelength calibration. Bias and flat-field images were also acquired to perform the standard reduction of 2D spectra. Spectrophotometric standard stars Feige 110, G191B2B and Feige 34 (Bohlin Bohlin96 (1996)) were observed during the night for the flux calibration.
2.2 Reduction
| No. 3, 12.01.07 | No. 3, 12.01.08 | No. 4, 12.01.07 | ||||
| (Å) Ion | ()/(H) | ()/(H) | ()/(H) | ()/(H) | ()/(H) | ()/(H) |
| 3727 [O ii] | 1.7440.156 | 1.7230.165 | 1.4190.079 | 1.6690.097 | 2.1660.274 | 2.4270.321 |
| 3869 [Ne iii] | 0.1730.048 | 0.1700.048 | 0.1390.046 | 0.1600.054 | … | … |
| 3889 He i + H8 | 0.1440.027 | 0.1670.042 | 0.1920.049 | 0.2420.064 | … | … |
| 3967 [Ne iii] + H7 | 0.0890.019 | 0.1140.039 | 0.1160.008 | 0.1570.016 | … | … |
| 4101 H | 0.1980.028 | 0.2170.039 | 0.1840.011 | 0.2270.018 | 0.2870.085 | 0.3110.116 |
| 4340 H | 0.4890.040 | 0.5010.046 | 0.4480.015 | 0.4940.019 | 0.4590.074 | 0.4840.132 |
| 4363 [O iii] | 0.0620.015 | 0.0620.015 | 0.0430.008 | 0.0460.009 | 0.0940.050 | 0.0980.053 |
| 4471 He i | … | … | 0.0190.006 | 0.0200.007 | … | … |
| 4861 H | 1.0000.077 | 1.0000.079 | 1.0000.027 | 1.0000.028 | 1.0000.098 | 1.0000.146 |
| 4959 [O iii] | 0.6640.055 | 0.6560.055 | 0.6990.055 | 0.6800.020 | 0.9360.097 | 0.9250.096 |
| 5007 [O iii] | 2.1320.053 | 2.0590.052 | 2.1320.053 | 2.0590.052 | 3.0500.268 | 3.0000.266 |
| 5876 He i | 0.1010.023 | 0.1000.023 | 0.0740.007 | 0.0640.006 | … | … |
| 6548 [N ii] | 0.0150.013 | 0.0150.014 | 0.0080.006 | 0.0060.005 | 0.0030.017 | 0.0020.015 |
| 6563 H | 2.4300.183 | 2.4080.200 | 3.4260.082 | 2.7930.074 | 3.1220.275 | 2.7440.267 |
| 6584 [N ii] | 0.0500.026 | 0.0490.026 | 0.0270.027 | 0.0220.023 | 0.0190.036 | 0.0170.032 |
| 6717 [S ii] | 0.1040.017 | 0.1030.017 | 0.1010.009 | 0.0810.008 | 0.1660.040 | 0.1440.036 |
| 6731 [S ii] | 0.0360.014 | 0.0350.014 | 0.0870.010 | 0.0700.008 | 0.0220.033 | 0.0190.029 |
| C(H) dex | 0.000.10 | 0.250.03 | 0.160.11 | |||
| EW(abs) Å | 1.651.78 | 2.301.01 | 0.3511.6 | |||
| (H)a | 14.511.43 | 16.880.29 | 3.620.25 | |||
| EW(H) Å | 1367 | 1507 | 1088 | |||
| a in units of 10-16 ergs s-1cm-2. | ||||||
The standard pipeline with the use of IRAF222IRAF: the Image Reduction and Analysis Facility is distributed by the National Optical Astronomy Observatory, which is operated by the Association of Universities for Research in Astronomy, In. (AURA) under cooperative agreement with the National Science Foundation (NSF). and MIDAS333MIDAS is an acronym for the European Southern Observatory package – Munich Image Data Analysis System. was applied for the reduction of the long-slit spectra, which included the next steps.
Cosmic ray hits were removed from the 2D spectral frames in MIDAS. Using IRAF packages from CCDRED, we subtracted bias and performed flat-field correction. After that the 2D spectra were wavelength calibrated and the night sky background was subtracted. Then, using the data on the spectrophotometry of standard stars, the 2D spectra were transformed to absolute fluxes. After that, using the continuum of the brightest HII region, all spectra were straighten. Finally, for each individual 2D spectrum a similar subregion was separated along the slit, centred at the maximum of continuum in the spectrum of HII region No.3, and all 6 individual 2D spectra were summed up (without weighting) in order to obtain the full time exposure 2D spectrum. One-dimensional spectra of the central parts of HII regions were then extracted by summing up, without weighting, 18 and 6 rows along the slit (6.3 and 2.1″) for HII region 3 for observations in Jan. 2007 and Jan. 2008, respectively, and 9 rows (3.1″) - for HII region 4. These sizes corresponded to the subregions, where the principal line [OIII]4363 for determination of Te, was ‘visible’ above the noise. The significant difference in the sizes of exctracted subregions for HII region No. 3 is related with two factors. First, as it is seen on the HST image from FGW, this region is well elongated along nearly the North–South direction, with visible extent of 4.5″2.5″. For the observation in Jan. 2007 the long slit was oriented approximately along the major axis, while for Jan. 2008 – approximately along the minor axies. Second, the seeings for these runs differed significantly: 2.7″ in Jan. 2007 versus 1.3″ in Jan. 2008.
All emission lines were measured applying the MIDAS programs described in detail in Kniazev et al. (SHOC (2004)). Briefly, they draw continuum, perform robust noise estimation and fit separate lines by a single Gaussian superimposed on the continuum-subtracted spectrum. Emission lines blended in pairs or triplets were fitted simultaneously as blend of two or three Gaussians features. The quoted errors of singular line intensities include the following components. The first is related to the Poisson statistics of line photon flux. The second component is the error resulting from the creation of the underlying continuum, which gives the main contribution for the errors of faint lines. For fluxes of lines in blends an additional error appears related to the goodness of fit. Last, the term related to the uncertainty of the spectral sensitivity curve gives an additional error to the relative line intensities. For observations in Jan. 2007 the half-amplitude of variations of sensitivity curve along the whole working range ( 3650 Å) was less than 1%. For observation in Jan. 2008 it was less than 0.5 %. All these components are summed up squared. The total errors have been propagated to calculate the errors of all derived parameters.
3 Results
3.1 Line intensities and element abundances
Relative intensities of all emission lines used for the abundance determination in the HII regions of And IV, as well as the derived C(H), the EWs of Balmer absorption lines, the measured flux in H emission line and the measured heliocentric radial velocity are given in Table 1. Their spectra are shown in Figures 1, 2. Extinction is low: C(H) 0.1, consistent with the extinction value in our Galaxy and with data for most very metal-poor galaxies.
To derive the element abundances of species O, Ne, N in the HII regions of And IV, we use the standard method from Aller (Aller84 (1984)), and follow the procedure described in detail by Pagel et al. (Pagel92 (1992)) and Izotov et al. (ITL97 (1997)). Element abundances and physical parameters are determined in the frame of the classical two-zone model of HII region (Stasińska Stas90 (1990)), as described in detail in our papers (Pustilnik et al. 2004a , Kniazev et al. SHOC (2004); Sextans (2005)). The derived electron temperatures Te and density Ne, as well as the abundances of oxygen, nitrogen, and neon are given in Table 2. The resulting oxygen abundances, derived for region No. 3 in January 2007 and 2008, correspond to the value of parameter 12+(O/H) equal to 7.400.11 and 7.560.08, respectively, and for region No. 4 – to 7.550.23. The weighted mean on two independent measurements of O/H in region No. 3 (derived on O/H and its error in Table 2) corresponds to 12+(O/H)=7.490.06. The value of O/H for region No. 4, despite it has a much larger uncertainty, is well consistent with the weighted mean for region No. 3.
The latter value of O/H allows to classify this dwarf LSB galaxy as one of the most metal-poor galaxies known in the Local Volume. The weighted mean abundance ratios N/O ((N/O)=–1.780.15) and Ne/O ((Ne/O)=–0.770.12) for HII region No.3, within their cited errors are close to the typical of XMD BCGs (Izotov & Thuan IT99 (1999)). This seemingly indicates common properties of heavy element enrichment in both types of galaxies, and hence sufficiently similar IMFs (Initial Mass Functions) in the range of large and intermediate stellar masses.
| No. 3, 12.01.07 | No. 3, 12.01.08 | No. 4, 12.01.07 | |
|---|---|---|---|
| (OIII)(103 K) | 19.382.79 | 16.021.54 | 19.896.51 |
| (OII)(103 K) | 15.502.08 | 14.221.30 | 15.654.72 |
| (SII)(cm-3) | 1010 | 316288 | 1010 |
| O+/H+(10-5) | 1.3560.476 | 1.7570.453 | 1.8561.429 |
| O++/H+(10-5) | 1.1830.396 | 1.9050.459 | 1.7091.272 |
| O/H(10-5) | 2.5380.620 | 3.6620.645 | 3.6541.906 |
| 12+(O/H) | 7.400.11 | 7.560.08 | 7.550.23 |
| N+/H+(10-6) | 0.3430.159 | 0.1780.146 | … |
| ICF(N) | 1.872 | 2.084 | … |
| (N/O) | –1.600.23 | –1.990.36 | … |
| Ne++/H+(10-5) | 0.2130.089 | 0.3230.134 | … |
| ICF(Ne) | 2.146 | 1.992 | … |
| (Ne/O) | –0.740.21 | –0.770.20 | … |
| HII-region No. 3 | HII-region No. 4 | |||
| (Å) Ion | ()/(H) | ()/(H) | ()/(H) | ()/(H) |
| 3727 [O ii] | 2.2800.248 | 2.6270.311 | 1.8100.196 | 1.8460.217 |
| 4101 H | 0.2900.034 | 0.3120.047 | 0.3000.034 | 0.3060.044 |
| 4340 H | 0.4500.046 | 0.4780.054 | 0.4900.054 | 0.4950.058 |
| 4363 [O iii] | 0.0450.014 | 0.0480.015 | 0.0610.025 | 0.0620.025 |
| 4861 H | 1.0000.111 | 1.0000.112 | 1.0000.111 | 1.0000.112 |
| 4959 [O iii] | 0.6200.065 | 0.6140.065 | 1.0600.115 | 1.0560.115 |
| 5007 [O iii] | 2.0600.227 | 2.0280.224 | 3.0500.337 | 3.0380.337 |
| 6548 [N ii] | 0.0330.010 | 0.0290.009 | 0.0270.010 | 0.0260.010 |
| 6563 H | 3.2400.361 | 2.7820.338 | 2.8600.322 | 2.7910.342 |
| 6584 [N ii] | 0.1000.014 | 0.0860.012 | 0.0800.012 | 0.0780.013 |
| 6717 [S ii] | 0.1100.014 | 0.0930.013 | 0.1300.016 | 0.1270.017 |
| 6731 [S ii] | 0.0800.012 | 0.0680.011 | 0.0900.013 | 0.0880.014 |
| C(H) dex | 0.200.14 | 0.030.15 | ||
| EW(abs) Å | 0.002.73 | 1.2011.66 | ||
| (H)a | 8.8 | 4.5 | ||
| EW(H) Å | 171 | 684 | ||
| Rad. vel. km s-1 | 24415 | 25013 | ||
| a in units of 10-16 ergs s-1cm-2. | ||||
4 Discussion and conclusions
4.1 Comparison with other determinations
The signal-to-noise ratios in the faint line [OIII]4363 Å, that is used for the determination of electron temperature in HII region, is rather small in our spectra: (2–5). Therefore, independent opportunities to get the estimates of O/H and compare them with the results of the direct Te method, of course are worse to employ. There are several empiric methods, which use for O/H estimate the intensities of strong lines of oxygen and other elements. Their review with the estimates of their accuracy was given recently by Yin et al. (Yin07 (2007)). Besides, Izotov and Thuan (IT07 (2007)) suggested a semi-empirical method, in which Te is estimated on sum of intensities of strong oxygen lines, basing on relation found in Stasinska & Izotov (Stas03 (2003)) from the combined analysis of observational data and large grid of HII region models. After the Te is estimated by this empirical relation, all other abundance calculations are performed exactly as in the classic method. Izotov and Thuan (IT07 (2007)) compared for their sample of low-metallicity galaxies (a dozen HII regions in eight galaxies) O/H derived by the direct method, and those obtained by several empirical and their semi-empirical methods. The least differences with the direct method derived O/H were obtained for their semi-empirical method (rms=0.06 dex) and the empirical formula for O/H suggested in paper by Yin et al. (Yin07 (2007)) (rms=0.07 dex):
where
These estimates we will use for comparison with direct determinations. The estimates for parameter 12+(O/H), obtained for two observations of region No. 3 (Jan. 2007 and Jan. 2008) and for region No. 4 by semi-empirical method, give respectively the following numbers: 7.48, 7.49 7.76. The estimates of the same parameters with the use of empirical formula from Yin et al. (Yin07 (2007)) give the following numbers: 7.36, 7.39 7.61.
Thus, for HII-region No. 3 semi-empirical estimates of O/H for both observations (7.48, 7.49) are very close to the weighted mean, determined by the direct method on the same spectra (7.49). The estimates of O/H on the empirical formula from Yin et al. (Yin07 (2007)) for region No. 3 are well consistent each to other, but give the value of O/H which is systematically lower by 0.1 dex. For region No. 4 both methods give significantly higher values of O/H (7.76 7.61), which however are consistent with the direct determination 7.55, accounting for its large error of 0.23 dex. Thus, the estimates with the help of the most reliable semi- and empirical methods, confirms that region No. 3 has very low metallicity. For region No. 4 the available data do not contradict that it also has very low O/H. It is, however, not excluded, that its value is somewhat higher than in region No. 3, by 0.10–0.15 dex.
We can similarly use the spectral data for these regions from paper by FGW. First, on the plots of the spectra of HII regions No. 3 and 4, presented by FGW, there is marginally visible, but measurable line [OIII]4363 Å. We estimated its intensity on these plots based on the relative heights of this line and of the nearby H-line. To perform the abundance calculations through the classical Te method like to that for our BTA spectra, we transformed their corrected for CH line intensities of HII region No. 3 (for which C(H) in FGW is larger than zero) back to the measured line fluxes. For a reader convenience, these, as well as the line fluxes for region No. 4 are given in Table 3 with the accepted values for the line [OIII]4363 Å. The results of our calculations of physical conditions and abundances are given in Table 4.
The values of 12+(O/H) for HII regions No. 3 and 4 derived on these data by the direct Te method are equal to 7.630.14 and 7.720.16, respectively. The estimates by semi-empirical method give very close O/H values, of 7.64 and 7.70, respectively. Using the empirical formula from Yin et al. (Yin07 (2007)), we again get O/H systematically smaller: 7.48 and 7.57, respectively. Thus, all our estimates of O/H on the spectra of HII regions No. 3 and 4 from paper by FGW are consistent, within the cited errors, with O/H values derived on our observations. There is an indication that O/H in region No. 4 is somewhat higher than that in region No. 3.
| No. 3 | No. 4 | |
|---|---|---|
| (OIII)(103 K) | 16.642.75 | 15.272.98 |
| (OII)(103 K) | 14.492.28 | 13.882.57 |
| (SIII)(103 K) | 15.512.28 | 14.372.47 |
| (SII)(cm-3) | 45226 | 1010 |
| O+/H+(10-5) | 2.5351.117 | 2.0281.083 |
| O++/H+(10-5) | 1.6840.670 | 3.1961.623 |
| O/H(10-5) | 4.2191.318 | 5.2241.952 |
| 12+(O/H) | 7.630.14 | 7.720.16 |
| N+/H+(10-6) | 0.6790.207 | 0.6730.247 |
| ICF(N) | 1.664 | 2.576 |
| (N/O) | –1.570.19 | –1.480.23 |
The comparison of the relative line intensities in both HII regions, measured in our work, with those from the paper by FGW, shows their general consistency, with except of I(H) in January 2007 and I([OII]3727) in HII region No.3. I(H) is somewhat lower than the expected theoretical value, but the difference can be treated to be within cited errors. Our I([OII]3727) appears somewhat lower than that in FGW. The most likely this is related with subtracting different parts of region No. 3 in our work and by FGW. The effect of differential atmospheric refraction (see, e.g., Filippenko Filippenko82 (1982)) was insignificant. In January 2008, when the seeing was of FWHM=1.3″, the long slit orientation was close to the direction of atmospheric refraction. For observations in January 2007 the slit was oriented almost perpendicular to the latter. However, for the slit width and average seeing for that case of FWHM=2.7″, the effect of differential refraction is almost washed out.
Thus, summarising the comparison of our direct O/H determinations in the two brightest HII regions of And IV with their most reliable indirect estimates, and also with the estimates, derived on the spectra of the same HII regions from FGW, we conclude that all of them are well consistent with our determinations. The empirical formula from Yin et al. (Yin07 (2007) gives seemingly in these regions somewhat smaller O/H by about 0.1 dex. Accounting for the large difference in the errors for O/H in regions No. 3 and 4 (7.490.06 and 7.550.23, respectively), we accept for further the parameter 12+(O/H) in And IV to be equal to 7.490.06.
4.2 The L–Z relation and And IV
Since And IV appeared a new XMD LSB dwarf galaxy, it is interesting to examine how this fits in the well known metallicity-luminosity relation for DIGs and related objects (Skillman et al. Skillman89 (1989)). The updated version of L–Z relation in -band, incorporating all available data for DIGs in the LV was presented by Lee et al. (Lee03 (2003)). Similar L–Z relation for an independent sample of DIGs was derived by van Zee & Haynes (2006). One more similar relation for DIGs within the volume with D5 Mpc was obtained by van Zee et al. (vZee06 (2006)). All three relations are very close each to other, but that of van Zee & Haynes (vZee_Haynes (2006)) has the least rms scatter (0.15 dex), so we use this relation: 12+(O/H)=5.65–0.149MB to compare the derived O/H values for And IV. With the And IV value of MB=–12.60 (Karachentsev et al. CNG (2004)), the value of O/H, expected from the latter L–Z relation is 7.53. This value is 0.37 dex (or 2.5r.m.s.) smaller than the O/H, obtained by FGW. Our value of 12+(O/H)=7.490.06, agrees with the L–Z relation very well.
Izotov et al. (Izotov05 (2005)) presented the updated formulae for calculations of element abundances in HII regions, incorporating updates in atomic parameters of relevant ions. This results in small systematic differences with the results from the standard models, used in this work. In particular, for O/H this difference changes approximately linearly from +0.05 dex to +0.005 dex for Te in the range of 10000 to 20000 K, that is new formulae give a bit higher O/H values. Since many recent O/H determinations (e.g., in Izotov & Thuan IT07 (2007)) are given in the new scale, for the correct comparison we give O/H for And IV also in the new scale. For the respective range of Te we need to add to O/H 0.01 dex. Thus, in the new scale, And IV, with 12+(O/H)=7.500.06, enters to the five most metal-poor DIG/LSBDs in the Local Volume.
4.3 And IV and the diversity in properties of LSB dwarf galaxies
One of the Introduction points was that related to the possibility to study the diversity of dwarf galaxy properties in the Local Volume and their differences in evolutionary path-ways. It is worth to notice some significant differences between And IV and other XMD LSBDs. In particular, in Table 5 we present for comparison the global parameters of And IV and another nearby XMD LSBD ESO 489-56 (AM 0624–260). Both galaxies have very close values of O/H and MB. However, their M(HI) differ by a factor of 11. Respectively, the ratios M(HI)/LB differ for two LSBD galaxies by a factor of 15.
In models of chemical evolution, LSB galaxies are usually treated as objects with the lowest star formation rates (SFRs). This is related to very low surface mass density and inefficient self-gravitation of discs in such objects. Because of very low SFR, the related energy release is small, so that newly produced heavy elements should retain in the parent galaxy. Thus, it is expected that the chemical evolution of LSB galaxies should be well described by the model of ‘closed-box’, in which the ISM metallicity is tightly related to the gas mass-fraction. Despite the amount of good data on the ISM metallicity in LSB dwarfs to compare them with theoretical models is still insufficient, in some papers on LSB galaxies (e.g., de Naray et al. deNaray04 (2004)) no significant deviations from the predictions of ‘closed-box’ were found. The example above gives an evidence that among the nearest LSB galaxies such a tight relation is absent. Galaz et el. (Galaz02 (2002)) come to similar conclusions from the NIR study of a large sample of LSB galaxies. This implies that our understanding of chemical evolution even for ‘the simplest’ galaxies requires more general models which incorporate some additional significant factors.
| Parameter | And IV | ESO 489-56 | Ref. |
| Btot | 16.60 | 16.08 | 1,2 |
| AB | 0.27 | 0.28 | 8 |
| Vhel(km s-1) | 234 | 491 | 3,4 |
| Distance (Mpc) | 6.1 | 5.0 | 1 |
| MB | –12.6 | –12.63 | 1,2 |
| 12+(O/H) | 7.49 | 7.49 | 5,6 |
| M(HI) (108M⊙) | 1.8 | 0.16 | 7,4 |
| M(HI)/LB (M⊙/L⊙) | 13 | 0.85 | 7,4 |
| 1. Karachentsev et al. (CNG (2004)); 2. Pustilnik et al. (2008, | |||
| in preparation); 3. Braun et al. (Braun03 (2003)); 4. Pustilnik, Martin | |||
| (NRT (2007)); 5. this work; 6. Ronnback, Bergvall (RB95 (1995)); | |||
| 7. Chengalur et al. (Chengalur07 (2007)); 8. Schlegel et al. (Schlegel98 (1998)). | |||
4.4 Conclusions
-
•
With multimode instrument SCORPIO at the BTA the good S-to-N spectra were obtained of two brightest HII regions in And IV, a dwarf LSB galaxy situated at the distance of 6.1 Mpc.
-
•
The oxygen abundances in HII-regions No. 3 and 4, determined by the classical Te method are consistent each to other. Their parameters 12+(O/H) (in old scale) are equal to 7.490.06 and 7.550.23, respectively. The most reliable semi-empirical and empirical methods for O/H estimates give values close to those calculated by the direct Te method. In the new scale the accepted metallicity of And IV corresponds to 12+(O/H)=7.50. This galaxy appears one more a rare Local Volume LSBD galaxy with very low metallicity (ZZ⊙/14).
-
•
The comparison of global parameters of And IV and the other LSBD in the Local Volume, ESO 489-56, which have very close metallicities and optical luminosities, reveals very large difference on their HI mass. This fact indicates on difficulties of simple models of the chemical evolution of LSB galaxies.
Acknowledgements.
S.A. Pustilnik and A.L. Tepliakova acknowledge the support of this work through the RFBR grant No. 06-02-16617. The authors are grateful to I.D. Karachentsev who brought this interesting Local Volume galaxy to their attention. They are also very grateful to the referee N.G. Guseva for useful suggestions which allowed to improve the first version of the paper. This research made use of the NASA/IPAC Extragalactic Database (NED), which is operated by the Jet Propulsion Laboratory, California Institute of Technology, under the contract with the NASA.References
- (1) Afanasiev V.L., & Moiseev A.V. 2005, Astron.Lett., 31, 193
- (2) Aller H.L., Physics of Thermal Gaseous Nebulae, Dordrecht, Reidel (1984)
- (3) Asplund M., Grevesse N., Sauval A.J., Allende Prieto C., & Kiselman D. 2004, Astron.Astrophys., 417, 751
- (4) Bohlin, R.C. 1996, AJ, 111, 1743
- (5) Braun R., Thilker D., Walterbos R.A.M. 2003, Astron.Astrophys., 406, 829
- (6) Chengalur J.N., Begum A., Karachentsev I.D., Sharina M., & Kaisin S.S. 2007, arXiv:astro-ph/0711.2154
- (7) de Naray R.K., McGaugh S.S., de Block W.G.J. 2004, MNRAS, 355, 877
- (8) Ferguson A.M.N., Gallagher J.S., & Wyse R.F.G. 2000, AJ, 120, 821 (FGW)
- (9) Filippenko A.V. 1982, PASP, 94, 715
- (10) Galaz G., Dalcanton J.J., Infante L., Treister E. 2002, AJ, 124, 1360
- (11) Izotov Y.I., Thuan T.X., & Lipovetsky V.A. 1997, ApJ Suppl.Ser., 108, 1
- (12) Izotov Y.I., & Thuan T.X. 1999, ApJ, 511, 639
- (13) Izotov Y.I., & Thuan T.X., 2002, ApJ, 567, 875
- (14) Izotov Y.I., Stasinska G., Meynet G., et al. 2005, A&A, 448, 955
- (15) Izotov Y.I., & Thuan T.X. 2007, ApJ, 665, 1115
- (16) Karachentsev I.D., Karachentseva V.E., Huchtmeier W., & Makarov D.I. 2004, AJ, 127, 2031
- (17) Kniazev A.Y., Grebel E.K., Hao L., Strauss M., Brinkmann J., Fukugita M. 2003, ApJ, 593, L73
- (18) Kniazev A.Y., Pustilnik S.A., Grebel E., Pramskij A.G., & Lee H. 2004, ApJ Suppl.Ser., 153, 429
- (19) Kniazev A.Y., Grebel E., Pustilnik S.A., Pramskij A.G., & Zucker D. 2005, AJ, 130, 1558
- (20) Kunth D., and Östlin G. 2000, Astron.Astrophys.Rev., 10, 1
- (21) Lee H., Mac Call M.L., Kingsburgh R.L., Ross R., & Stevenson C.C. 2003, AJ, 125, 146
- (22) Pagel B.E.J., Simonson E.A., Terlevich R.J., Edmunds M.G. 1992, MNRAS, 255, 325
- (23) Papaderos P., Izotov Y.I., Fricke K.J., Guseva N.G., & Thuan T.X. 1998, Astron.Astrophys., 338, 43
- (24) Papaderos P., Fricke K.J., Thuan T.X., Izotov Y.I., Nicklas H. 1999, Astron.Astrophys., 352, L57
- (25) Pustilnik S., Kniazev A., Ugryumov A., & Pramskij A. 2003a, Astrophys.Spa.Sci., 284, 795 (arXiv: astro-ph/0301089)
- (26) Pustilnik S., Zasov A., Kniazev A., Pramskij A., Ugryumov A., & Burenkov A. 2003b, Astron.Astrophys., 400, 841
- (27) Pustilnik S.A., Kniazev A.Y., Pramskij A.G., et al. 2004a, Astron.Astrophys., 419, 469
- (28) Pustilnik S.A., Pramskij A.G., Kniazev A.Y., 2004b, Astron.Astrophys., 425, 51
- (29) Pustilnik S.A., Kniazev A.Y., Pramskij A.G. 2005, Astron.Astrophys., 443, 91
- (30) Pustilnik S.A., & Martin J.-M. 2007, Astron.Astrophys., 464, 859
- (31) Pustilnik S.A., Tepliakova A.L., & Kniazev A.Y. 2007, Astron. Letters, accepted, (arXiv: astro-ph/0712.4007)
- (32) Ronnback J., & Bergvall N. 1995, Astron.Astrophys., 302, 353
- (33) Schlegel D.J., Finkbeiner D.P., Douglas M. 1998, ApJ, 500, 525
- (34) Skillman E.D., Kennicutt R.C., & Hodge P.W. 1989, ApJ, 347, 875
- (35) Searle L., & Sargent W.L.W., 1972, ApJ, 173, 25
- (36) Stasińska, G. 1990, Astron.Astrophys.Suppl., 83, 501
- (37) Stasińska, G. & Izotov Y.I. 2003, Astron.Astrophys. 397, 71
- (38) van den Bergh S. 1972, ApJ, 171, L31
- (39) van Zee L. ApJ, 2000, 543, L31
- (40) van Zee L., Skillman E., & Haynes M. 2006, ApJ, 637, 269
- (41) van Zee L., & Haynes M. 2006, ApJ, 636, 214
- (42) Yin S.Y., Liang Y.C., Hammer F., et al., 2007, Astron.Astrophys., 462, 535