Structure and Kinematics of Molecular Disks in Fast-rotator Early-type Galaxies
Abstract
We present interferometric observations resolving the CO emission in the four gas-rich lenticular galaxies NGC 3032, NGC 4150, NGC 4459, and NGC 4526, and we compare the CO distribution and kinematics to those of the stars and ionized gas. Counterrotation documents an external origin for the gas in at least one case (NGC 3032), and the comparisons to stellar and ionized gas substructures in all four galaxies offer insights into their formation histories. The molecular gas is found in kpc-scale disks with mostly regular kinematics and average surface densities of 100 to 200 pc-2. The disks are well aligned with the stellar photometric and kinematic axes. In the two more luminous Virgo Cluster members NGC 4459 and NGC 4526 the molecular gas shows excellent agreement with circular velocities derived independently from detailed modeling of stellar kinematic data. There are also two puzzling instances of disagreements between stellar kinematics and gas kinematics on sub-kpc scales. In the inner arcseconds of NGC 3032 the CO velocities are significantly lower than the inferred circular velocities, and the reasons may possibly be related to the external origin of the gas but are not well understood. In addition, the very young population of stars in the core of NGC 4150 appears to have the opposite sense of rotation from the molecular gas.
Subject headings:
galaxies: elliptical and lenticular, cD — galaxies: ISM — galaxies: kinematics and dynamics — galaxies: structure — galaxies: evolution — galaxies: individual (NGC 4459 (catalog ), NGC 4150 (catalog ), NGC 3032 (catalog ), NGC 4526 (catalog ))1. Introduction
Early-type galaxies, the ellipticals and lenticulars, are generally poorer in cold gas than spirals (e.g. Lees et al., 1991) . This fact is, of course, ultimately responsible for the color difference between early- and late-type galaxies and their locations in the red sequence or the blue cloud (e.g. Baldry et al., 2004). However, cold atomic and molecular gas are not entirely absent from all early-type galaxies, and therein lie some important clues to both the past and the future of early-type galaxies. The origin of the cold gas in early-type galaxies can serve as a tracer of their assembly histories, and the properties of the cold gas (the raw material for star formation) offer insights into possible morphological and dynamical evolution through star formation.
Faber & Gallagher (1976) predicted that mass loss from evolved stars in early-type galaxies should produce detectable amounts of gas over a Hubble time. More recent work (e.g. Ciotti et al., 1991) makes predictions which are different quantitatively but not qualitatively. Of course, it is likely that the gas recycled into the interstellar medium will have a complex thermal history, including heating to X-ray temperatures and possible cooling all the way to the formation of molecules (Brighenti & Mathews, 1996, 1997). But since the stellar mass loss is unavoidable and Temi, Brightenti, & Mathews (2007) have shown that the dusty ejecta can cool to molecular temperatures in galaxy centers, it is very natural to expect that some early-type galaxies could contain cold gas. In fact, as Temi, Brightenti, & Mathews (2007) have alluded, the question of why there are early-type galaxies without cold gas may be just as interesting as why there are early-type galaxies with cold gas.
However, if the cold gas ultimately originated in the stars, one might expect a correlation between the luminosity of an early-type galaxy and its cold gas content, which has not been seen (Wardle & Knapp, 1986; Huchtmeier, Sage, & Henkel, 1995; Lees et al., 1991; Knapp & Rupen, 1996; Combes et al., 2007). The lack of such a correlation is then often used to suggest that whatever molecular gas does exist in early-type galaxies is completely unrelated to the internal stellar mass loss, having been acquired from external sources such as a satellite galaxy or perhaps even the intergalactic medium. In a slightly more sophisticated analysis of both the atomic and molecular gas contents of lenticular galaxies, Sage & Welch (2006) hypothesized a variation on this theme in which the atomic gas could be of external origin whereas the molecular gas could be of internal origin.
Due to the complex nature of the thermal evolution of the stellar mass loss, plus environmentally dependent interaction with an intracluster medium and potential time-dependent effects of AGN feedback on the ISM, we argue that the total gas masses by themselves do not offer compelling answers about the origin of the cold gas in early-type galaxies. However, a comparison of the gaseous and stellar angular momenta should provide much stronger constraints. The distribution and kinematics of the gas can reveal recent gravitational interactions, and gas which is counterrotating with respect to the stars almost certainly did not originate in those stars. Maps which resolve the molecular gas are thus crucial tools which help us to read the assembly histories of early-type galaxies.
Molecular gas in early-type galaxies is also particularly interesting because such gas is the raw material for star formation activity. In recent years there have been suggestions that current-day star formation is taking place in as many as 30% of early-type galaxies at (Yi et al., 2005; Kaviraj et al., 2006). Such inferences are at least superficially consistent with the CO detection rates found by Sage & Welch (2006), Sage, Welch, & Young (2007), and Combes et al. (2007). But the distribution of the molecular gas will determine whether the star formation takes place in a nuclear starburst or in an extended disk and, therefore, it will also determine the efficiency with which AGN feedback could disrupt the star formation. Testing our theoretical understanding of star formation in early-type galaxies also requires estimates of the molecular disk sizes and gas surface densities. Thus, resolved maps of molecular gas hold the keys to understanding the morphological evolution of early-type galaxies through star formation.
We begin to address these issues on the past and future of early-type galaxies through interferometric maps which resolve the CO emission in four nearby lenticular galaxies. Total molecular masses are commonly available for S0s, but resolved CO maps are rare (e.g. Okuda et al., 2005; Das et al., 2005) and the four presented here represent a significant addition to the literature on the subject. In all four cases the molecular gas is found in kpc-scale disks, and in one case the molecular gas counterrotates with respect to the stars. We also present comparisons between the CO kinematics and circular velocity curves derived independently from stellar kinematic data. We discuss the origin of the gas and its implications for mass modeling. A forthcoming paper will also present comparisons to the stellar populations in the galaxies and their ionized gas properties, with special emphasis on the distribution and kinematics of the young stellar population, showing clear evidence for disk growth through star formation.
2. Selection and properties of the galaxies
The four galaxies NGC 3032, NGC 4150, NGC 4459, and NGC 4526 were observed because of their membership in the SAURON integral-field survey of early-type galaxies (see de Zeeuw et al., 2002), which means that detailed maps of the stellar kinematics, ionized-gas kinematics, and stellar populations are available for the regions within an effective radius (e.g. Emsellem et al., 2004; Sarzi et al., 2005; Kuntschner et al., 2006). They also have CO detections (Thronson et al., 1989; Sage & Wrobel, 1989; Lees et al., 1991; Combes et al., 2007), making them suitable for high spatial resolution comparisons of the stellar and molecular disks. Basic parameters of the galaxies are summarized in Table 1.
NGC 3032 is a relatively faint () field lenticular with complex stellar kinematics. Having high angular momentum per unit mass, it belongs to the so-called fast rotator class (Emsellem et al., 2007), and has a small counter-rotating core (; McDermid et al. 2006a). The ionised gas is co-spatial with dusty spiral arms extending to about an effective radius and is also counter-rotating (Sarzi et al., 2005). H emission is the strongest in the SAURON sample while the ratio [O III]/H is weakest (except in the very center). The absorption linestrength distributions are unusual, suggesting young stars everywhere with a lower metallicity and -enhancement in the center (Kuntschner et al. 2006; Kuntschner et al. 08, in prep.), probably indicating a recent starburst.
NGC 4150 belongs to the Coma I Cloud and is low-luminosity () lenticular in many respects similar to NGC 3032. It is a fast rotator (Emsellem et al., 2007) with moderate rotation and a dip in the central velocity dispersion (Emsellem et al., 2004), and also harbours a central counter-rotating core (McDermid et al., 2006b) where messy dust is found. Contrary to NGC 3032, however, the extended ionised gas is co-rotating with the bulk of the stars, although slightly misaligned (Sarzi et al., 2005). The linestrengths again indicate young stars everywhere, particularly in the center, but the metallicity and elements are rather flat (Kuntschner et al. 2006; Kuntschner et al. 08, in prep.).
NGC 4459 is an average () Virgo lenticular with rapid rotation and the pinch of the stellar isovelocity contours characteristic of decoupled central disks (Emsellem et al., 2004). This disk is co-spatial with a regular but flocculent dust disk and rapidly rotating ionised-gas with low [O III]/H ratio (except in the very center; Sarzi et al. 2005). The linestrengths indicate much younger stars and higher metallicity in the central disk (Kuntschner et al. 2006; Kuntschner et al. 08, in prep.).
NGC 4526 is a Virgo lenticular similar to NGC 4459 but slightly brighter (). It harbours what is probably the strongest decoupled central stellar disk in the SAURON sample (observed nearly edge-on), embedded in a more slowly rotating bulge (Emsellem et al., 2004). The bulge has a slight triaxiality which suggests the presence of a bar. A rather large but regular dust and ionised-gas disk is co-spatial with the stellar disk, and has uniformly low [O III]/H ratio (Sarzi et al., 2005). The linestrengths clearly show that the central disk is much younger and metal rich than the bulk of the galaxy (Kuntschner et al. 2006; Kuntschner et al. 08, in prep.).
The four galaxies studied here thus fall naturally into two classes. NGC 3032 and NGC 4150 are relatively faint and have low velocity dispersion, but harbour small counter-rotating cores and have extended marginally ordered gaseous disks with pervasive young stars. NGC 4459 and NGC 4526 have rapid rotation but even more rapidly co-rotating decoupled (and spatially well-constrained) central stellar disks, co-spatial with regular dust disk populated with young stars. The former thus point to a more troubled recent past, perhaps involving accretion or minor mergers, while the latter suggest a more peaceful immediate past dominated by secular evolution. The current molecular gas observations should thus allow to build on these data and test those ideas further.
| NGC 3032 | NGC 4150 | NGC 4459 | NGC 4526 | |
|---|---|---|---|---|
| RA (J2000.0) | 09 52 08.2 | 12 10 33.6 | 12 29 00.0 | 12 34 03.0 |
| Dec | +29 14 10 | +30 24 06 | 13 58 43 | 07 41 57 |
| Velocity (km s-1) | 1533 (5) | 226 (22) | 1210 (16) | 575 (24) |
| Distance (Mpc) | 21.4 | 13.4 | 15.7 | 16.4 |
| Type | SAB00(r) | S00(r)? | S0+(r) | SAB00(s): |
| 0.63 | 0.83 | 0.97 | 0.98 | |
| (″) | 9 | 18 | 35 | 44 |
| (km s-1) | 82 | 148 | 174 | 256 |
| CO flux () | 93 (18) | 26 (5) | 56 (11) | 180 (36) |
| H2 mass ( ) | 5.0 (1.0) | 0.55 (0.11) | 1.6 (0.3) | 5.7 (1.1) |
Note. — Data are taken from NASA’s Extragalactic Database (NED) and the Lyon Extragalactic Database (LEDA). The velocities are stellar measurements with the exception of NGC 3032’s, which is a HI velocity. Distance measurements are from Tonry et al. (2001) and Mei et al. (2005) and are taken from Emsellem et al. (2007). CO fluxes are derived from the present observations, and H2 masses use a CO-to-H2 conversion factor of 3.0 .
3. CO data
NGC 3032, NGC 4150, NGC 4459, and NGC 4526 were observed in the 12CO line with the 10-element Berkeley-Illinois-Maryland Association (BIMA) millimeter interferometer at Hat Creek, CA (Welch et al., 1996). These observations were carried out in the C configuration (projected baselines 3 to 34 k) in the spring and fall of 2003. Additional data for NGC 3032 and NGC 4526 were obtained in the B configuration (projected baselines 4 to 83 k) in March 2003. Total observing times were 8 to 17 hours per galaxy in the C configuration and 10 to 16 hours in the B configuration. A single pointing centered on the optical position was used for all galaxies. Each observation covered a velocity range of 1300 km s-1, and these data have sensitivity to structures from point sources up to objects 60–80″ in diameter. System temperatures were mostly in the 300–500 K range. Table 2 summarizes important parameters of these observations.
| Galaxy | Flux cal | Phase cal | Velocity Range | FOV | 3mm cont. |
|---|---|---|---|---|---|
| km s-1 | kpc | mJy | |||
| NGC 3032 | 3c273 | 0927+390, 0854+201 | (876, 2128) | 10.5 | 8 |
| NGC 4150 | 3c273 | 1159+292 | (455, 766) | 6.6 | 14 |
| NGC 4459 | 3c273 | 3c273 | (547, 1776) | 7.9 | 11 |
| NGC 4526 | Mars, 3c273 | 3c273 | (233, 1050) | 7.9 | 14 |
Note. — Field of view (FOV) is the FWHM of the primary beam (100″) at the distances in Table 1.
Reduction of the BIMA data was carried out using standard tasks in the MIRIAD package (Sault, Teuben, & Wright, 1995). Electrical line length calibration was applied to all tracks. The C configuration data for NGC 3032 and 60% of the C configuration data for NGC 4526 were also explicitly corrected for amplitude decorrelation on longer baselines using data from an atmospheric phase monitor and the MIRIAD task uvdecor (Lay, 1999; Akeson, 1998; Regan et al., 2001; Wong, 2001). The atmospheric decorrelation is estimated using a small interferometer with a fixed 100 meter baseline which measures the rms path length difference in the signal from a commercial broadcast satellite. Data requiring the decorrelation correction had rms path length differences in the range of 300 to 700 microns, and the median amplitude correction factor was about 13%. However, the longest baselines in these datasets were later flagged because of their very poor phase stability. The remainder of the tracks were taken in stabler weather and were not explicitly corrected for decorrelation, because normal amplitude calibration can take out most of the effect (Wong, 2001).
Absolute flux calibration was based on observations of Mars and 3C273, and comparisons of flux measurements on all the observed calibrators suggest that the absolute flux uncertainties are in the range of 15%–20%. Phase drifts as a function of time were corrected by means of a nearby calibrator observed every 30 to 40 minutes. Gain variations as a function of frequency were corrected by the online passband calibration system. Inspection of data for 3C273 indicate that residual passband variations are on the order of 10% or less in amplitude and 2° in phase across the entire band.
The calibrated visibility data were weighted by the inverse square of the system temperature and the inverse square of the amplitude decorrelation correction factor (if used), then Fourier transformed. Dirty images were lightly deconvolved with the Clark clean algorithm (Clark, 1980), as appropriate for these compact, rather low signal-to-noise detections. No continuum subtraction was needed. Integrated intensity and mean velocity maps were produced by the masking method: the deconvolved image cube was smoothed along both spatial and velocity axes, and the smoothed cube was clipped at times the rms noise in a channel. The clipped version of the smoothed cube was then used as a mask to define a three-dimensional volume in the original, unsmoothed cube in which the emission was integrated over velocity (Wong, 2001; Regan et al., 2001). Velocity maps were also constructed from Gaussian fits to the line profile at each position.
Integrated spectra were constructed by first using the integrated intensity (moment 0) maps to define the spatial extent of the emission, then integrating over that fixed extent for every channel. Continuum images were also made by averaging all of the line-free channels in the final spectral line cubes, but no continuum emission was detected. Table 2 gives 3 limits for point source continuum emission at the centers of the galaxies, and Table 3 gives beam size and sensitivity information for the final spectral line cubes.
| Galaxy | Beam | Beam | Chan. | noise | N(H2) |
|---|---|---|---|---|---|
| ″ | kpc | km s-1 | Jy bm-1 | 1020 cm-2 | |
| NGC3032 | 3.42.7 | 0.40.3 | 40.4 | 0.013 | 47.7 |
| 8.16.7 | 0.80.7 | 20.2 | 0.026 | 8.0 | |
| 6.15.0 | 0.60.5 | 12.12 | 0.025 | 8.3 | |
| NGC4526 | 5.03.8 | 0.40.3 | 20.08 | 0.021 | 18.1 |
| 4.33.1 | 0.30.2 | 40.16 | 0.018 | 45.5 | |
| NGC4150 | 8.55.1 | 0.60.3 | 40.04 | 0.021 | 15.9 |
| 8.55.1 | 0.60.3 | 20.03 | 0.029 | 11.0 | |
| NGC4459 | 9.05.5 | 0.70.4 | 40.31 | 0.014 | 9.4 |
| 9.05.5 | 0.70.4 | 20.14 | 0.020 | 6.7 |
Note. — The N(H2) limit is a sensitivity estimate corresponding to a 3 signal in one channel.
4. Results
4.1. Total CO fluxes
Comparisons of the total CO fluxes in the BIMA images and in previous single dish data show that the interferometer usually recovers all of the CO emission. In the case of NGC 4459, the best single dish flux is from a survey of the SAURON early-type galaxies made with the IRAM 30m telescope by Combes et al. (2007). That work finds 54.0 , with a statistical uncertainty of 2.4 and an absolute calibration uncertainty of 15% to 20%. The present BIMA data yield 56 11 . An earlier, much noisier detection by Thronson et al. (1989) found 120 55 . Thus, the single dish CO fluxes are entirely consistent with the flux measured from the interferometric map. We adopt here a CO-to-H2 conversion factor of 3.0 and distances from Tonry et al. (2001), scaled down by 3% following Mei et al. (2005). At 15.7 Mpc, the mass of NGC 4459 is (1.6 0.3) .
Our BIMA-derived CO flux of NGC 3032 (93 18 ) is also consistent with most of the previous single dish measurements. Thronson et al. (1989) measured 85 25 in the 45″ beam of the FCRAO 14m telescope, and Sage & Wrobel (1989) measured 92 10 in the 55″ beam of the NRAO 12m. However, the more recent measurements of Combes et al. (2007) give only 46.0 1.5 (again, with typically 15% to 20% absolute calibration uncertainty) in the 22″ beam of the IRAM 30m telescope. Since the BIMA data show emission over a region at least 25″ in diameter, it is plausible that some emission was missed by the 30m beam. At a distance of 21.4 Mpc, our flux corresponds to (5.0 1.0) of .
In contrast, the CO flux we find for NGC 4526 (180 36 ) is significantly larger than previous single dish measurements. Lees et al. (1991) quote a value of 11825 measured by Sage & Wrobel (1989) with the NRAO 12m telescope, and Combes et al. (2007) measured 118 4 (statistical) at the IRAM 30m telescope. Since the CO images show emission over a region nearly 30″ in diameter, the 30m telescope may have missed significant flux. Furthermore, the spectrum of Sage & Wrobel (1989) is quite asymmetric, which may indicate mispointing or an inaccurate spectral baseline (neither of which plague the interferometric fluxes). For a distance of 16.4 Mpc, our flux corresponds to a mass of (5.7 1.1) of . Thus, in NGC 3032, NGC 4459, and NGC 4526 the evidence suggests that the interferometric maps have recovered all of the CO emission.
There is some inconsistency in the single dish CO fluxes of NGC 4150, which makes it more difficult to judge whether the interferometric data are missing flux. The most recent 30m CO flux of NGC 4150 is 30.2 2.4 (statistical) 5 (calibration) from Combes et al. (2007), whereas the BIMA data yield 26 5 . These two measurements are in good agreement. Welch & Sage (2003) measured 45 2 7 , also with the IRAM 30m telescope, and this value may not be inconsistent with the previous two. However, a flux of 77 14 reported by Leroy et al. (2005) from the ARO 12m telescope (the old NRAO 12m telescope) is significantly higher, which might be due to an absolute calibration uncertainty, an underestimated baseline level, or even some extended molecular gas which is sampled by the 55″ beam of the 12m but not by the 22″ beam of the 30m. At a distance of 13.4 Mpc, our BIMA flux corresponds to an mass of (5.5 1.1) .
4.2. NGC 3032
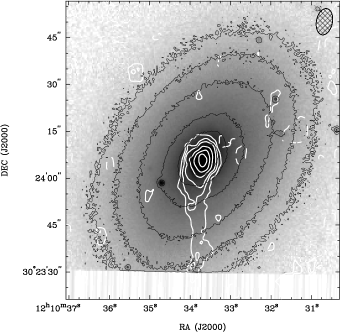
The CO in NGC 3032 is found in a centrally concentrated structure of rather narrow linewidth. Emission is detected over 145 km s-1 centered on a systemic velocity of 1555 km s-1 (Figure 1), so the CO systemic velocity is in good agreement with the stellar absorption line velocity measurements of 1555 41 km s-1 from Falco et al. (1999) and 1559 10 km s-1 from Emsellem et al. (2004). The diameter of the CO emission is approximately 30″, with a peak on the nucleus of the galaxy and a tail extending 15″ to the southeast (Figure 2). Based on a comparison with dust maps (see below), we infer that the molecular gas lies in a circular disk of radius 14″ (1.5 kpc), yielding an average surface density of pc-2 including helium. NGC 3032 is also known to contain 0.9 (1.0 ) of HI emission (Duprie & Schneider, 1996), giving M()/M(HI) .

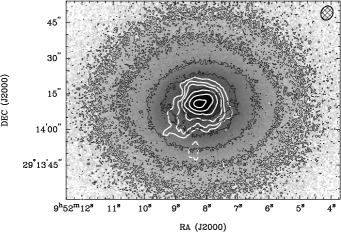
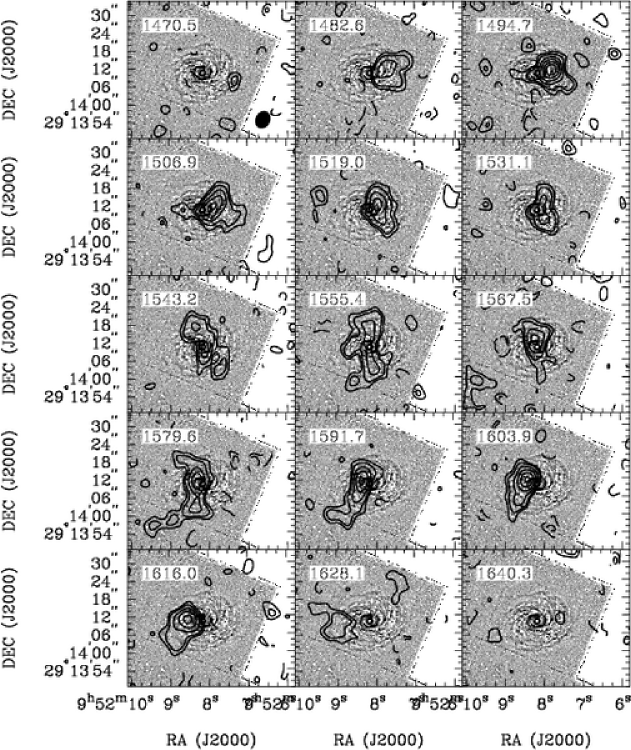
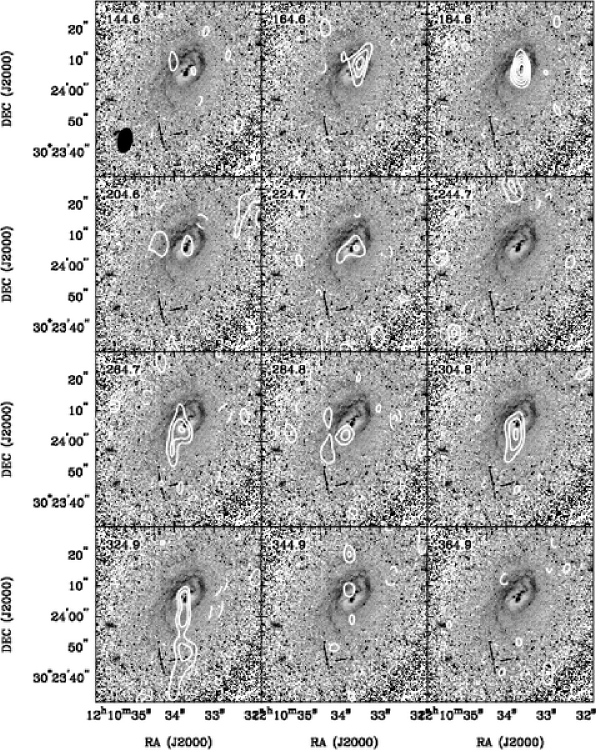
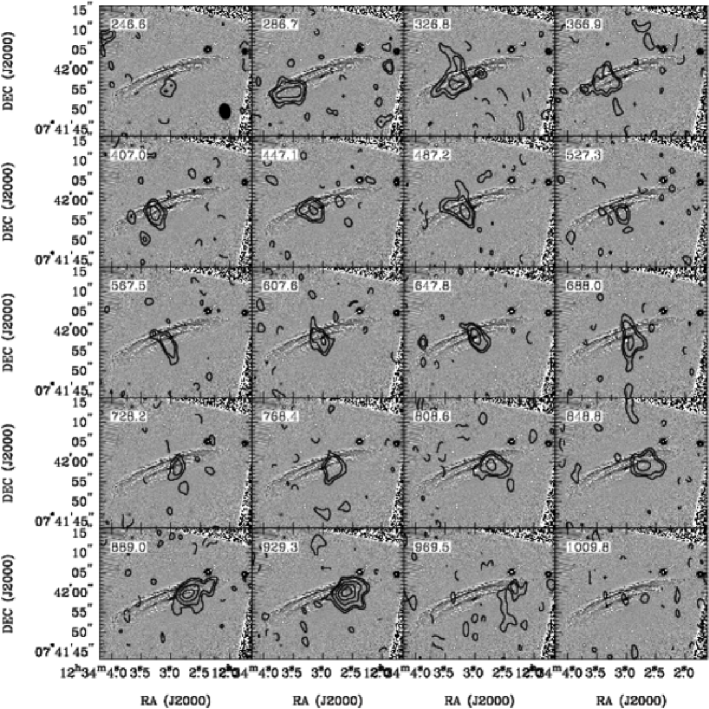
Individual CO channel maps (Figure 3) show good agreement between the distribution of molecular gas and dust in NGC 3032; dust and gas are both found in an inclined, rotating disk. An unsharp-masked WFPC2 image (Figure 3) shows a bright nucleus surrounded by a dark dusty ring (or two tightly wrapped arms) roughly 6″ in major axis diameter, and beyond that ring is a disk of flocculent spiral dust features interspersed with bright point sources. The dust features cover a region 28″ in diameter. CO channels have a butterfly-wing structure with compact emission in the end channels and central channels elongated in the direction of the kinematic minor axis. The extent of the CO emission matches that of the dust disk and the gas kinematic major axis matches the dust morphological major axis. The southeast “tail” of emission in Figure 2 is also visible in the channel maps at 1580 to 1616 km s-1 as emission at about the 75 level, smoothly tracking to smaller radii with increasing velocity; it does not appear to be associated with a dust feature.
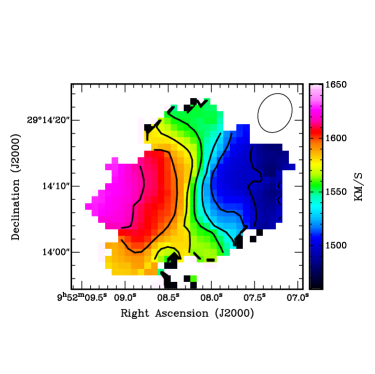
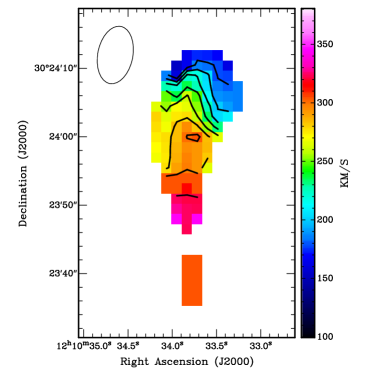
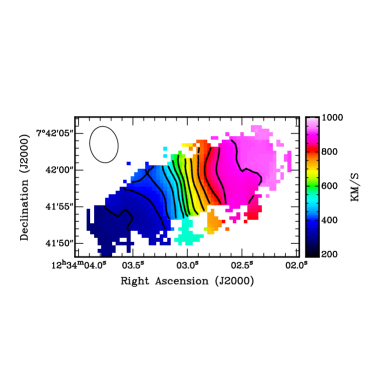
Kinematic analysis of the CO in NGC 3032 was made with several different techniques whose results are all in good agreement. To the velocity field shown in Figure 4 we fitted a model described by an inclined disk with the rotation curve , as encoded in the National Radio Astronomy Observatory’s AIPS task GAL. The details of the shape of this rotation curve are not critical, but it has the desired behavior of rising quickly at small radii and asymptotically flattening. We also employed the kinemetry analysis of Krajnović et al. (2006), and we made a tilted ring analysis with the rotcur task of the GIPSY package from the Kapteyn Institute, Rijksuniversiteit Groningen. In using the rotcur task we followed the procedure outlined by Swaters et al. (1999).
The fitted kinematic center positions are within an arcsecond of the optical nucleus measured from the SDSS image. The systemic velocity of the galaxy is also robustly fitted to be 1555 1 km s-1. The inclination of the disk is poorly constrained by the CO data, however, and is more accurately taken from the axis ratio of the dust disk which gives 44° 4°. The Jeans dynamical modeling we did in this work is consistent and suggests .
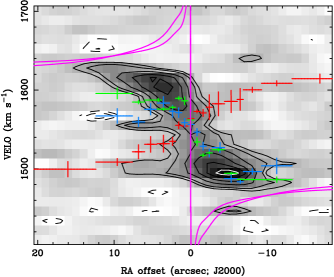
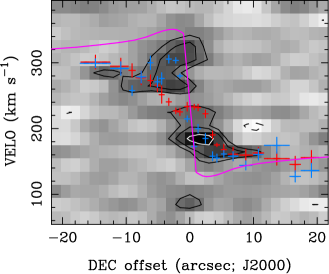
Measurements of the globally averaged CO kinematic position angle fall in the range 90° to 97°, measured to the receding major axis, while the tilted ring model and the kinemetry both suggest a gentle twist from 81° in the central resolution element to 97° at 8″ 14″. This twist is also suggested by the hint of an integral-sign shape in the zero velocity curve of the velocity field, although warping is not obvious in the images of the dust disk. A major axis position-velocity diagram sliced through the data cube at 95° is shown in Figure 5. This position-velocity diagram shows the typical pattern with a steeply rising inner portion followed by a flattening (especially noticeable on the eastern side of the galaxy) beyond radii 4″.
The kinematic position angle for the molecular disk is consistent with the photometric position angle, defined as that of the ellipse of inertia of the surface brightness (99.6°, Cappellari et al., 2007), but is 180° offset from the stellar kinematic angle of (Emsellem et al., 2004; Cappellari et al., 2007).111Cappellari et al. (2007) quote a stellar kinematic angle of , as they define it as it as the direction along which is maximum. The velocity fields shown in Emsellem et al. (2004) make it clear that this is to the stellar major axis on the approaching side rather than the receding side. Thus, the molecular gas in NGC 3032 is counterrotating with respect to the bulk of the stars in the galaxy. However, McDermid et al. (2006a, b) found a large radial age gradient in the galaxy and a counterrotating stellar core, which suggests recent star formation in the molecular disk. The sense of rotation of the molecular gas is consistent with that of the young counterrotating stars but inconsistent with that of the older, more extended population.
4.3. NGC 4150
NGC 4150 shows a relatively small amount of molecular gas in a very compact structure at the center of the galaxy. We fit the integrated spectrum in Figure 6 with a Gaussian whose central velocity is 239 20 km s-1, which we take as the systemic velocity of the CO emission. This CO velocity is in good agreement with the stellar velocity measurements of 226 22 km s-1 (Fisher et al., 1995), 208 30 km s-1 (Falco et al., 1999), and 219 10 km s-1 (Emsellem et al., 2004). CO emission is detected over a velocity range of 180 km s-1, and the bulk of this gas is within a few arcseconds of the nucleus of the galaxy (Figure 7).

Several dust structures are apparent in the center of NGC 4150 (Figure 8). A dark dust lane bisects the nucleus from northwest to southeast, and the galaxy has more dust clouds a few arcseconds northwest and east of the nucleus. There is an irregular dust ring, stronger in the north, of semimajor and semiminor axes 7.5″ 4″, with a fainter dust arm curving around the southeast side of the nucleus to radii 12″. The peaks in the channel maps suggest that most of the molecular gas is located in the bisecting dust lane, and the CO kinematic major axis roughly matches the major axis of the dust ring. Figure 7 shows a faint tail of emission stretching to 30″ south of the nucleus, also visible in the channel maps from 265 km s-1 to 325 km s-1. Morganti et al. (2006) show that the 2.5 of HI in the galaxy (M()/M(HI) = 23) is elongated roughly along the optical major axis in a structure of 1′ diameter, with additional HI to the south and southwest, so the similarities between the CO and HI lend credence to the reality of the CO tail.
Due to the small angular size of the CO emission the velocity field (Figure 9) does not offer good constraints on the kinematic parameters of the galaxy. Cappellari et al. (2007) quote both the photometric and stellar kinematic position angles as , with uncertainties of a few degrees. The orientation of the dust ring (Figure 8) is , and although the CO velocity field is complex, it is not inconsistent with this value. A slice at position angle gives the major axis position-velocity diagram of Figure 10. It appears that very little of the molecular gas is located beyond the turnover point in the rotation curve. The inclination of the galaxy is measured from the axis ratio of the dust ring to be 54°5°, consistent with the value of 52° from the dynamical modelling (Cappellari et al., 2006).
There is a counterrotating stellar core in the central arcseconds of NGC 4150 (McDermid et al., 2006a, b, and it is also visible in the position-velocity diagram of Figure 10). This counterrotating core is believed to have formed recently as the galaxy shows a very strong radial age gradient. Curiously, though, the core does not appear to have a counterpart in the molecular gas at the current resolution and sensitivity. The counterrotating core is also not obvious in the [O III] velocities of NGC 4150 (Figure 10), and indeed the CO velocities of this galaxy are a better match to the [O III] velocities than they are to the stellar velocities. A good match between CO velocities and ionized gas velocities suggests the possibility that the ionized gas could trace star formation activity, but the relationship to the counterrotating stellar core is not yet clear.
4.4. NGC 4459
The CO emission from NGC 4459 is also in a central disk, with hints of a double-horned structure in the integrated spectrum (Figure 11). A double-horned spectrum is typically produced by gas in the flat part of the rotation curve. Emission is detected over a velocity range of 400 km s-1 centered near a systemic velocity of 1210 20 km s-1 (but see below). The CO velocity is thus in good agreement with the stellar velocity of 1232 40 km s-1 from Falco et al. (1999) and 1200 10 km s-1 from Emsellem et al. (2004).

The integrated intensity map (Figure 12) shows a compact structure centered on the galaxy nucleus, no more than 20″ in diameter. Little structure is evident, and there is no strong evidence for arms or tails of molecular gas. The individual channel maps in Figure 13 again show a typical disk pattern with higher intensities at the extreme velocities than near the systemic velocity. The centroids of the emission in each channel show excellent agreement with the extent of the prominent, well-developed dust disk. The dust fills a flocculent disk with a rather sharp outer edge at a semimajor axis of 8.5″ and only a few faint spiral dust features beyond. From a radius of about 3.75″, two prominent dusty spiral arms can be traced inward to an inner ring of semimajor axis 2.0″. The larger disk has a major axis position angle of 102° but the inner ring appears to have a slightly different orientation, with position angle 90°. The bulk of the CO emission appears associated with the larger-scale, 8.5″ disk. For a circular disk of radius 8.5″ (670 pc), the average gas surface density is 170 pc-2, including helium. The north side of the disk must be the near side, suggesting that both the flocculent and inner spiral arms are trailing.

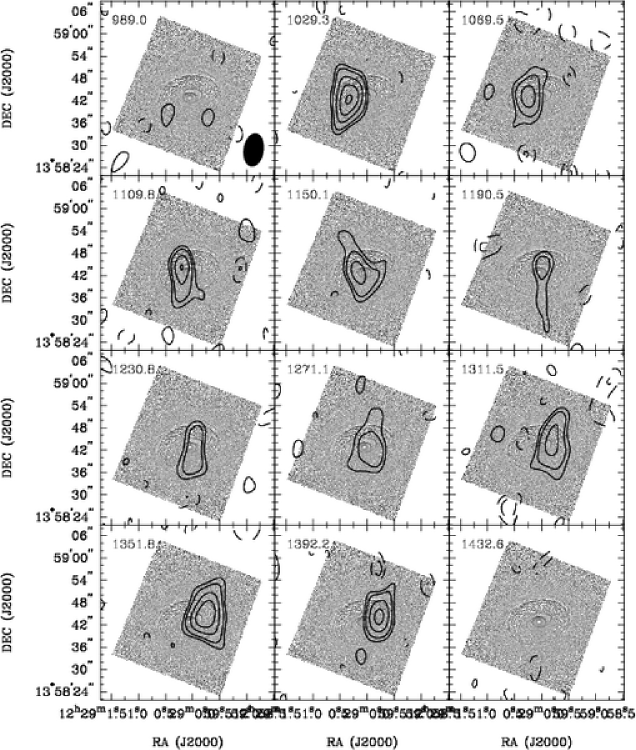
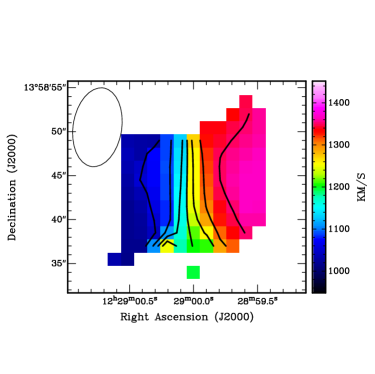
The velocity field (Figure 14) shows predominantly straight, parallel isovelocity contours, so again the inclination of the gas disk is better obtained from the dust disk than from the gas itself. The axial ratio of the dust disk gives an estimated inclination of , consistent with 47° from dynamical modelling (Cappellari et al., 2006). For the kinematic analysis we also constrain the kinematic center of the galaxy to be the position of the optical nucleus. Stellar isophotes have a position angle of 280° outside the dust disk, while a kinemetric analysis of the stellar velocities gives position angles of 280° outside the dust disk, decreasing to 274° inside it (Krajnović et al., 2006). A global kinematic position angle measurement for the molecular gas, measured both as in Krajnović et al. (2006) and by fitting a model velocity field, yields values in the range 269° to 273° to the receding major axis. The molecular gas kinematics are thus very well aligned with the stellar kinematics and the stellar isophotes. A tilted ring analysis suggests the systemic velocity to be 11962 km s-1. The major axis position-velocity diagram (Figure 15) is very strongly peaked at its maximum velocities, suggesting that the bulk of the molecular gas is located in the flat part of the galaxy’s rotation curve.
4.5. NGC 4526
In NGC 4526 the CO lies in a well-developed, nearly edge-on disk. The integrated CO profile shows the familiar double-horned shape (Figure 16), with both horns approximately equally bright. The systemic velocity of the galaxy is 613 10 km s-1 and emission is detected over a total width of 683 km s-1. A line width of this magnitude, while not unknown, is unusually large for lenticulars. In fact, we argue in section 5.3 that the galaxy’s maximum circular velocity is about 355 km s-1 and in the compilation of 243 galaxies (54 lenticulars) made by Courteau et al. (2007), NGC 4526’s circular velocity is exceeded by only two other lenticulars, one Sa galaxy, and 10 ellipticals.

The observed CO systemic velocity is consistent with the stellar velocity of 592 48 km s-1 given by Falco et al. (1999) and 626 10 km s-1 given by Emsellem et al. (2004), but is inconsistent with the HI velocity of 448 8 km s-1 (de Vaucouleurs et al., 1991; Davies & Lewis, 1973). In fact, a comparison of Figure 16 with the HI spectrum in Davies & Lewis (1973) shows that the latter authors only detected one “horn”, so their HI velocity is not a good estimate of the systemic velocity. Interferometric HI observations would undoubtedly be useful in revealing the relationships between atomic and molecular gas.
The CO distribution (Figure 17) is elongated in the direction of the optical major axis. Fitting a two-dimensional Gaussian to the integrated intensity image reveals that the disk is poorly resolved in the short dimension; the deconvolved minor axis FWHM is 4.3″, comparable to the beam size. The position angle of this gas disk is estimated as 1.8°.
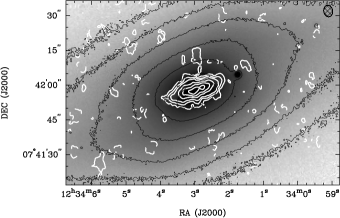
Individual channel maps (Figure 18) show a close correspondence between the CO and dust disks. Unsharp-masked HST images show that the dust is confined to radii less than 14″ – 15″. Although the inclination is quite high, there appear to be at least two dominant dust rings of radii 14″ and 10″. (These radii are uncertain because the features are most prominent along the minor axis.) The centroids of CO emission in the extreme channels suggest that the bulk of the CO may be associated with the inner of these two rings. Assuming the gas to be in a circular disk of radius 14″ (1.1 kpc), the average surface density is 200 pc-2 including helium.

As in the case of NGC 4459, the velocity field (Figure 19) shows straight, parallel isovelocity contours throughout; it constrains the kinematic position angle but not the inclination of the gas disk. However, the dynamical modelling of Cappellari et al. (2006) gives an inclination of 79° which is consistent with values of 75° 2° inferred from the axis ratio of the dust disk. Fits of a model exponential velocity field show that the kinematic center of the molecular gas is consistent with the position of the optical nucleus, within 0.5″. The global CO kinematic position angle, calculated from those fits and also via the method of Krajnović et al. (2006), is 3° to the receding major axis. More detailed kinemetric analysis suggests a gradual trend from PA in the inner resolution element to at radii 6″. In comparison, the stellar photometric major axis is and the stellar kinematic major axis is (Cappellari et al., 2007), so the molecular gas (especially at its outer radii) is aligned with the stellar body of the galaxy to within a few degrees. Figure 20, the major axis position-velocity diagram, clearly shows that the gas traces a turnover in the rotation curve with concentrations of gas near the turnover radius. There is a modest degree of asymmetry, with somewhat stronger CO emission on the receding (west) side of the major axis.
5. Discussion
5.1. Origins of the Molecular Gas
In NGC 4459 and NGC 4526 the molecular gas kinematics are consistent with both the stellar photometric axes and the stellar kinematic axes. The differences are on the order of a few degrees, which is the level of precision available from existing data. In NGC 4150 the molecular gas kinematics are more difficult to describe but the orientation of the dust ring is also consistent with the stellar photometric and kinematic axes to a degree or better. In NGC 3032 the molecular gas kinematic position angle is consistent with the photometric axis to within a few degrees, but it is nearly 180° away from the stellar kinematic axis. Despite the dramatic counterrotation of the gas in NGC 3032, these alignments imply that all four galaxies have nearly axisymmetric potentials and that the gas is well settled into the equatorial plane.
In NGC 4150, NGC 4459, and NGC 4526 the agreements between the sense of rotation of the molecular gas and stars also imply that the molecular gas could have originated in internal stellar mass loss. Such an internal origin is not required by the data, of course, as the gas could have been captured into prograde rotation from outside sources, and internal secular evolution over several dynamical timescales would gradually bring it to the galaxy’s equatorial plane. (Orbital periods are a few yr at the edges of the disks.)
In contrast to the other three galaxies, the conspicuous counterrotation of the molecular gas and stars in NGC 3032 provides clear evidence that this molecular gas could not have originated in internal stellar mass loss. The only scenario that could explain the counterrotation of internally produced gas is to invoke some gravitational interaction which strongly torques the gas (possibly at large radii) while leaving the remainder of the galaxy seemingly untouched. This scenario seems unnecessarily complex, however, so we suggest instead that the molecular gas was captured through “cold” accretion from the intergalactic medium or in an interaction or a minor merger with a gas-rich neighbor. Perhaps it is even a remnant of a major merger which formed the present galaxy. The high degree of regularity in the gas kinematics and stellar morphology suggests that this event did not occur recently, as the orbital period at the outer edge of the CO disk is on the order of yr. Furthermore, modeling the optical image (Section 5.2) shows that the isophotes are very regular to at least 70″ (7.3 kpc, or five times the radius of the molecular gas).
NGC 3032 is significant, then, because it is one of the few early-type galaxies in which the possibility of an internal origin for the molecular gas can be firmly excluded. It contradicts the picture outlined by Sage & Welch (2006), who suggested that most of the molecular gas in lenticulars should have an internal origin like that described by Temi, Brightenti, & Mathews (2007). The evidence for the suggestion of Sage & Welch (2006) came from contrasting the atomic and molecular properties of lenticulars: the atomic gas, which is usually more extended and shows different kinematics than the molecular gas, tends to dominate the gas content in gas-rich galaxies, whereas the molecular phase dominates in gas-poor galaxies. Thus Sage & Welch (2006) hypothesized that the atomic gas could be primarily attributed to external sources but the molecular gas to internal sources. While that picture may still be roughly correct, it cannot account for the molecular gas in NGC 3032.
On the other hand, it must still be true that the evolved stars in NGC 3032 expelled mass into the ISM. According to the models of Faber & Gallagher (1976) and Ciotti et al. (1991), given the galaxy’s present luminosity the stellar mass loss would amount to 4 to 6 over a Hubble time. We have not detected that gas yet, as it would show prograde rotation. The stellar mass loss must now be in the form of hot gas, or perhaps it has been removed from the galaxy entirely (e.g. Temi, Brightenti, & Mathews, 2007).
It is not unusual to find counterrotating ionized gas in lenticular galaxies. From their own data and a compilation of the literature, Bureau & Chung (2006) find that 15% 4% of all S0s contain counterrotating ionized gas while 23% 5% of the S0s with ionized gas have that gas in retrograde motion. Earlier work by Bertola et al. (1992) and Kuijken, Fisher, & Merrifield (1996) is in agreement with this result. A more detailed study of stellar - ionized gas misalignments was carried out by Sarzi et al. (2005) using integral-field observations. They find that among the lenticulars of the SAURON early-type sample, 9 of 20 galaxies have a star-gas kinematic misalignment greater than 30°. NGC 3032 is the only one of the 9 that has a misalignment 150°, though, so it is somewhat unusual in having ionized gas so nearly retrograde. We should be careful not to make assumptions about the behavior of the molecular gas based on the behavior of the ionized gas, however, since in general it is not obvious that these two phases of the interstellar medium are closely linked. For example, in NGC 4150 the ionized gas emission (Sarzi et al., 2005) is distributed over a much larger scale than the molecular gas; ionized gas fills the 30″ 40″ SAURON field of view whereas molecular gas is concentrated in the central 6″. Clearly, a larger sample of resolved molecular maps of lenticular galaxies will be required before we can make better judgments about the origin of their molecular gas.
5.2. Deriving circular velocities
Molecular gas is naturally cold and dissipational and therefore, in equilibrium in an axisymmetric potential, it should settle in circular orbits in the equatorial plane. To the extent that the velocity dispersion of the molecular gas is low (typically on the order of 10 to 20 km s-1) it should then provide an excellent tracer of the circular velocity of the galaxy. And the circular velocity is, ultimately, the dynamical indicator of the total matter content of a galaxy.
It is also possible to estimate the circular velocity from stellar kinematic data, with additional complications. For a given edge-on axisymmetric potential, dimensional arguments suggest that it may be possible to uniquely recover the three-dimensional (3D) orbital distribution of the stars in a galaxy with another 3D quantity, namely the knowledge of the stellar line-of-sight velocity-distribution at every position on the galaxy, as can be obtained with integral-field spectroscopy. It seems however unlikely that the axisymmetric potential itself, which is another two-dimensional function can also be uniquely recovered from the same 3D observations (see Section 3 of Valluri et al., 2004, for a discussion). In the stellar dynamical models either a constant mass-to-light ratio () or a parametric form for the potential are assumed. In this context it is worthwhile to compare the two different estimates of circular velocity in early-type galaxies coming from different assumptions.
Cappellari et al. (2006) have used the stellar kinematics presented in Emsellem et al. (2004) to derive high quality dynamical for a subset of the SAURON early-type galaxies, under the assumption of a constant . High resolution and wide-field images of the galaxies are modeled with a Multi-Gaussian Expansion (MGE; Emsellem et al., 1994; Cappellari, 2002) so that, if the inclination of the galaxy (assumed to be axisymmetric) is known, the fitted MGE model of the surface density can be deprojected and a three-dimensional stellar distribution can be estimated. Full two-dimensional maps of the stellar mean velocities, dispersions, and Gauss-Hermite – parameters within about an effective radius are then used in combination with the stellar distribution to construct self-consistent two-integral Jeans and three-integral Schwarzschild models. The data are consistent with the assumption of a constant dynamical within an effective radius, and in galaxies with regular dust disks the inclination inferred from the Jeans models is consistent with the axial ratio of the dust disk.
Here we compute the circular velocities:
where the gravitational potential is computed from the MGE models tabulated in Cappellari et al. (2006), deprojected at their best fitting inclination, and scaled by the constant best-fitting Schwarzschild’s . For NGC 3032 no previous dynamical model exist so the MGE model, inclination and were determined as described below. The circular velocity curves of the best-fit gravitational potentials for NGC 3032, NGC 4150, NGC 4459 and NGC 4526 are shown in Figures 5, 10, 15, and 20.
For NGC 3032 we constructed an MGE model for the photometry using the software of Cappellari (2002). To reduce the effect of dust extinction in the derivation of the stellar density distribution, in the MGE fit we combined an archival near-infrared HST/NICMOS/F160W (-band) image of the dusty central regions with a larger-field image taken with HST/WFPC2/F606W (-band). The -band image was adopted as photometric reference and used to converted the MGE model to the Johnson band using the calibration of Dolphin (2000). The distance-independent parameters of the PSF-deconvolved MGE models, corrected for galactic extinction following Schlegel et al. (1998), and adopting an absolute magnitude of the Sun mag (Table 2.1 of Binney & Merrifield, 1998), are given in Table 4.
We constructed a self-consistent two-integral axisymmetric MGE Jeans model for the second velocity moments of NGC 3032 and we determined the best-fitting and inclination , as in Cappellari et al. (2006). Using the color of Tonry et al. (2001) this translates into , which is among the lowest measured values for any SAURON galaxy (Cappellari et al., 2006). This is still consistent within the scatter with their relationship, considering the low value of km s-1 of NGC 3032 from Emsellem et al. (2007). The low dynamical is also expected from their relation between and the fact that NGC 3032 has the lowest average H line-strength among all the galaxies in the SAURON sample of E/S0 galaxies (Kuntschner et al., 2006). This confirms that the variations in the stellar populations are the main driver for the observed differences in the dynamical . However the self-consistent model does not provide a good fit to the data, so the fitted represents an average value for the central regions of the galaxy which are sampled by the SAURON kinematics. In particular the self-consistent two-integral model shows a much steeper radial decrease of along the major axis than observed. This is the opposite of what is generally measured in flattened galaxies and disks (e.g. Cappellari et al., 2007) and suggests that anisotropy cannot explain the discrepancy. An improved non-self-consistent model will be discussed in Section 5.3.
| (L☉,V pc-2) | (arcsec) | ||
|---|---|---|---|
| 1 | 6.055 | -1.426 | 0.895 |
| 2 | 5.117 | -0.775 | 0.895 |
| 3 | 4.236 | -0.485 | 0.895 |
| 4 | 3.882 | -0.019 | 0.840 |
| 5 | 3.005 | 0.282 | 0.950 |
| 6 | 2.797 | 0.597 | 0.863 |
| 7 | 1.769 | 0.913 | 0.950 |
| 8 | 2.060 | 1.098 | 0.800 |
| 9 | 1.635 | 1.532 | 0.806 |
Note. — is the peak surface brightness of the -th Gaussian, which has dispersion and observed axial ratio .
5.3. Comparing circular velocities with the observed CO velocities
We make a comparison between the stellar and the molecular indicators of circular velocity with tilted ring models, projected and convolved to the same resolution and sampling as the CO data. The GALMOD routine in the GIPSY software package is used to generate the models. We specify the rotation velocities of the rings as computed in Section 5.2 and listed in Tables 5, 6, and 7. The inclinations of the gas disks are also known, as described above, and the velocity dispersion in the molecular gas is assumed to be 10 km s-1. The exact value of the velocity dispersion used is not critical, as long as it is smaller than the channel width and consistent with the sharp cutoffs in emission at the outlying velocities. Nominally the rotation velocities should also be corrected for this finite velocity dispersion (the asymmetric drift effect), but as the rotation velocities are 100 to 350 km s-1 the correction is negligible. The optical dust images also suggest a very thin molecular disk, here assigned a scale height of 1″ (again the exact value is not critical as it is smaller than the spatial resolution). A gradual linear decrease in the gas surface density is assumed, with a sharp cutoff at the edge of the dust disk. The rotating disk model is then projected onto the plane of the sky at the specified inclination and the model emission is sampled at a pixel size and channel width matching the CO observations. The sampled cube is also spatially smoothed to have the same resolution as the CO beam. Finally the smoothed model cube is sliced along the galaxy major axis just as for the real data, and the slice is displayed with analogous contour levels (as percentages of the peak intensity, which is arbitrary).
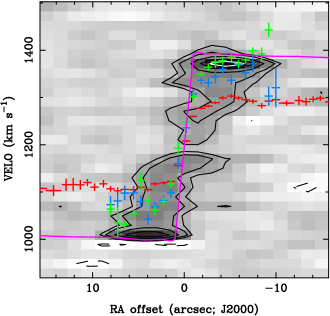
Figure 21 compares the data and the model position-velocity diagrams for NGC 4526. The assumed gas surface densities drop linearly by a factor of 5 between 1″ and 14″ and are zero beyond that. Placing the gas in rings rotating at the circular velocity produced a model with a bit too large velocity amplitude; the peaks in the model position-velocity diagram, tracing gas along the line of nodes, were separated by 703 km s-1 whereas in the data they are separated by 663 km s-1 (the difference is two channels). Therefore, Figure 21 actually shows a model in which the rotation velocity of each ring is 5% smaller than the circular velocities derived with the of Cappellari et al. (2006), and it shows that this model produces a very close match to both the ridgeline and the envelope of the observed emission. Even the rounded shoulder of the circular velocity curve (specifically, the relatively shallow but still rising slope in ) is confirmed by the CO data. We have not made an exhaustive search in the rotation velocity or gas distribution parameter space, so we certainly cannot claim to have made the unique best match to the observed position-velocity diagram. However, the good agreement between the model and the data should be regarded as independent confirmation that the circular velocities derived with the of Cappellari et al. (2006) are accurate to about 5%. The is thus accurate to about 10%, roughly consistent with the quoted uncertainty.
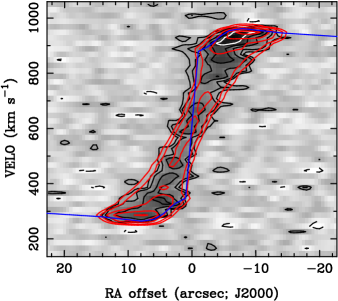
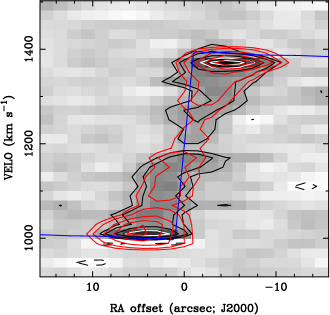
Figure 22 presents a similar comparison for NGC 4459. In this case the circular velocities obtained with the of Cappellari et al. (2006) are used without correction and an excellent match is achieved, indicating again the high degree of accuracy of the dynamical . Figures 15 and 20 also show that in NGC 4459 and NGC 4526 the molecular gas rotation speeds are 1.6 to 2.0 times larger than the mean stellar velocities at the same radii. In these galaxies the stars have significant pressure support, but the molecular kinematics and the stellar kinematics are both consistent with the same gravitational potential.
| Radius | |||
|---|---|---|---|
| ″ | km s-1 | km s-1 | |
| 1.34 | 289.0 | 274.6 | 1.00 |
| 1.80 | 295.2 | 280.4 | 0.97 |
| 2.42 | 302.7 | 287.6 | 0.93 |
| 3.26 | 318.0 | 302.1 | 0.88 |
| 4.37 | 343.3 | 326.1 | 0.81 |
| 5.88 | 366.4 | 348.1 | 0.72 |
| 7.90 | 373.8 | 355.1 | 0.59 |
| 10.62 | 366.6 | 348.3 | 0.43 |
| 14.26 | 356.8 | 339.0 | 0.20 |
Note. — The velocities are equal to the stellar-derived circular velocities, and .
| Radius | ||
|---|---|---|
| ″ | km s-1 | |
| 1.5 | 272.3 | 1.00 |
| 3.0 | 268.7 | 0.86 |
| 4.5 | 269.6 | 0.73 |
| 6.0 | 266.8 | 0.60 |
| 7.5 | 263.3 | 0.47 |
| 9.0 | 262.1 | 0.10 |
A broader implication of this agreement is that the molecular and stellar kinematics for galaxies like NGC 4459 and NGC 4526 can be used with confidence in studies of the circular velocity and the bulge velocity dispersion (e.g. Courteau et al., 2007), where it is necessary to probe the relationships between the two dynamical indicators. For example, several authors (e.g. Ho, 2007; Shields et al., 2006) have studied the development of the relationship between a galaxy’s black hole mass and its bulge velocity dispersion. They have advocated use of the CO line width to trace the galaxy’s maximum circular velocity, hence its velocity dispersion (especially at high redshift where it is currently easier to measure the CO line width than other dynamical indicators of the galaxy mass). These studies use a CO Tully-Fisher relation to demonstrate that the CO line widths do indeed trace their host galaxies’ maximum circular velocity. Our detailed comparison of molecular kinematics and circular velocities supports this claim when the CO velocities and circular velocities at large radii are considered, even for early-type galaxies where the Tully-Fisher relation is not traditionally applied.
Figure 10 compares the CO position-velocity diagram in NGC 4150 to the inferred circular velocity. In this case the total velocity range covered by the molecular gas is nearly as large as what would be expected from the circular velocity curve. The CO velocities are also nearly equal to the mean stellar velocities at radii 10″, which is qualitatively consistent with the fact that the observed stellar velocity dispersions are much smaller than in NGC 4459 and NGC 4526 (Emsellem et al., 2004). It is worth noting that the adopted inclination for the galaxy, while consistent with the axis ratio of the dust ring, may not be appropriate for the molecular gas which is concentrated in the nuclear dust lane. Detailed models are probably not yet useful for these data, and the most that can be said is that the inferred circular velocity curve is not inconsistent with the observed CO and stellar velocities.
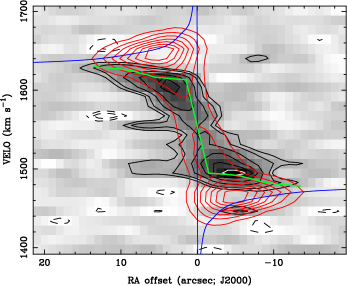
In contrast to the cases of NGC 4459 and NGC 4526, there are significant disagreements between the inferred circular velocity and the observed molecular gas rotation speeds of NGC 3032. Assuming a constant dynamical within an effective radius, the circular velocity rises quickly to a peak of 330 km s-1 at 0.08″ and makes a sharp, nearly Keplerian decline through the inner arcseconds. It drops by a factor of two to 157 km s-1 at 5″ and thereafter drops more slowly, passing through 132 km s-1 at 10″ which is nearly the edge of the molecular disk. But as Figure 5 shows, these velocities are much larger than the observed CO velocities especially interior to 5″.
The strong radial gradient in the H absorption line strength index of NGC 3032 (Kuntschner et al., 2006), and the young inferred central age (McDermid et al., 2006a) suggest that the stellar population might be better described with a variable . Indeed, if the line strength indices are interpreted with the models of Thomas et al. (2003) and Maraston (2005), the SAURON data are consistent with a decline of a factor of two to three in the local stellar from 10″ to 1″, even in the band (from which the MGE models are derived). Moreover the inability of the self-consistent Jeans model of Section 5.2 to qualitatively reproduce the observed kinematics also indicates the need for a varying dynamical (total) . Thus a second MGE model was constructed, with a variable , such that the deprojected Gaussian components having widths (dispersions) 1″ have M/L values half as large as the components with dispersions 10″, and the variation is logarithmic between those extremes. Using this mass model a non-self-consistent Jeans model was computed and again fitted to the observed SAURON stellar kinematics to derive a new . Interestingly this revised Jeans model, which has an gradient dictated by the stellar population measurements, now also well reproduces the observed SAURON stellar kinematics. The inferred circular velocity curve has a somewhat smaller peak velocity, 285 km s-1 at 0.08″, a steeper decline in the inner few arcseconds and a shallower slope at 10″, but its amplitude is the same at 10″ (132 km s-1) as for the model with the constant . Figure 23 shows the predicted CO velocities that would have been observed if the molecular gas in NGC 3032 were rotating at the inferred circular velocity (Table 7). Clearly the assumption of a variable M/L does not remove the discrepancy between observed and expected velocities.
A reasonably accurate measure of the discrepancy between observed and expected velocities can be made from a model which describes the CO velocities well. Table 7 and Figure 23 show the rotation velocities in this model; they have been altered by hand to reproduce the observed position-velocity diagram. As before, no formal fitting has been done so the model shown cannot be claimed unique or best and its gross properties should be trusted to a greater degree than its details. This “working” model has a rotation velocity of 98 km s-1 at 6.5″ and 113 km s-1 at 13.5″. At the outer edge of the CO disk its velocity is only 10% smaller than that of the inferred circular velocity curve. However, at 6.5″ (700 pc) its rotation velocity is only 70% of the circular velocity curve, which means that the enclosed mass is a factor of two smaller than that suggested by the circular velocity. The discrepancy is even worse at smaller radii, where the circular velocity is nearly a factor of three higher than the rotation velocities in the molecular gas and the implied mass difference is a factor of 10.
| Radius | |||
|---|---|---|---|
| ″ | km s-1 | km s-1 | |
| 1.5 | 183.6 | 88.7 | 1.0 |
| 2.7 | 166.1 | 89.8 | 0.9 |
| 3.6 | 155.3 | 90.9 | 0.8 |
| 4.5 | 148.8 | 92.0 | 0.7 |
| 5.5 | 144.5 | 93.2 | 0.6 |
| 6.5 | 141.4 | 97.6 | 0.5 |
| 7.5 | 138.7 | 101.0 | 0.4 |
| 8.7 | 135.7 | 106.3 | 0.3 |
| 10.0 | 132.4 | 108.8 | 0.2 |
| 11.6 | 129.1 | 111.0 | 0.1 |
| 13.5 | 126.1 | 113.3 | 0.0 |
Note. — The circular velocities are derived under an assumption of a variable stellar mass-to-light ratio, as described in the text. The CO rotation model provides a reasonably good (though fit by eye) match to the observed position-velocity diagram. In both cases the gas surface density is taken to be zero interior to 1.5″.
At present the source of the discrepancy between the observed CO velocities and the inferred circular velocity curve is not understood. The unusually strong peak in the circular velocity curve is driven by the very bright blue nucleus in optical images and by the high central stellar velocity dispersion. Therefore, one possibility is that the measured stellar mean velocity and/or velocity dispersion in the center of NGC 3032 are significantly overestimated. However, the velocity dispersion measurements in the central regions made by McDermid et al. (2006a) with the OASIS instrument are consistent with the SAURON data. Another striking possibility is that the molecular gas in NGC 3032 may not be rotating at the circular velocity. We argued above that the gas had to have been acquired from some external source, and perhaps it is still undergoing strong dynamical evolution as it settles into equilibrium. Yet if its velocities are 70% of the circular velocity its orbits would be highly noncircular, which seems inconsistent with the regular, symmetric appearance of the CO velocity field (Figure 4). Neither of these explanations is completely satisfactory.
In short, the CO velocities in NGC 4459 and NGC 4526 are in excellent agreement with the circular velocities inferred for those two galaxies. These matches indicate that the stellar and CO kinematics are well understood. In NGC 3032 and NGC 4150 at radii 10″, the observed CO velocities are nearly equal to the mean stellar velocities and 10% to 20% smaller than the inferred circular velocities. However, the CO velocities of NGC 3032 are conspicuously low when compared to its inferred circular velocity within 6″ of the nucleus, and it would be valuable to carry out this kind of a comparison in other galaxies with counterrotating molecular gas in order to ascertain whether NGC 3032 is unusual.
6. Molecular and Ionized Gas Velocities
In normal spiral galaxies, the bulk of the ionized gas emission traces HII regions recently formed out of the molecular gas and sharing the disky kinematics of the molecular gas. The effect is that in a major axis position-velocity diagram the ionized gas tends to trace the ridgeline of the molecular and atomic gas or to be displaced towards the high velocity envelope (due primarily to resolution effects). Examples can be seen in Kregel & van der Kruit (2004) and Young et al. (2006). Thus, comparisons between the molecular and ionized kinematics can help to elucidate the role of star formation activity (or the lack thereof) in producing the ionized gas.
Excluding the case of NGC 4150, which is discussed in SS4.3, there appears to be a systematic difference between ionized gas kinematics and molecular kinematics of these lenticulars. The rotation speeds of the ionized gas are 20% smaller than those of the CO. There is also a slight tendency for the [O III] velocities to be smaller than H velocities; this latter feature is most obvious at radii 5″ in NGC 4526 (Figure 20). Lower velocities in the ionized gas than in the molecular gas is the opposite situation to what is usually observed in the disks of spirals and is also in the opposite sense to the effects of beam smearing on the CO velocities. These data suggest that there may be a kinematic component of the ionized gas which is not dynamically cold and not related to star formation. They also imply that if the ionized gas in early-type galaxies is to be used for a measurement of the galaxy’s circular velocity, an asymmetric drift correction may be significant (e.g. Cretton, Rix, & de Zeeuw, 2000). By way of a caveat, though, we note that these lenticulars are dusty and NGC 4526 in particular has a high inclination (79°), so the observed CO and ionized gas velocities may be biased by projection and optical depth effects. The details of the relationships between cold and warm ionized phases of the interstellar medium are not yet clear, and they deserve closer scrutiny for the insights they may give into the evolution of the ISM in early-type galaxies.
7. Summary
We present resolved images of the CO emission in the four lenticular galaxies NGC 3032, NGC 4150, NGC 4459, and NGC 4526. These are some of the most CO-rich galaxies in the SAURON survey of early type galaxies, so they are prime targets for investigations which use cold gas to trace the interaction/merger history of early type galaxies and also to document morphological change through star formation and disk growth. Their inferred masses are in the range 5 to 5 . The molecular gas is located in kpc-scale disks (in excellent agreement with the distribution of dust visible in broadband optical images), the smallest being NGC 4150 with a radius of 500 pc and the largest being NGC 3032 with a radius of 1.5 kpc. Average molecular surface densities (including helium) are 100 to 200 pc-2.
In three of the four galaxies (NGC 3032, NGC 4459, and NGC 4526) the molecular gas is distributed in disks which show regular rotation and little sign of recent disturbance. The kinematic major axes are well aligned with the host galaxies’ photometric and (stellar) kinematic major axes, suggesting that the gas has settled into the equatorial plane of nearly axisymmetric potentials. The velocity field of NGC 4150 shows a kinematic major axis in rough agreement with the galaxy’s optical major axis, but better spatial resolution will be necessary in order to assess the regularity of the CO kinematics. Furthermore, in NGC 3032 the molecular gas’s kinematic position angle is 180° offset from the stellar kinematic position angle; this dramatic counterrotation indicates that the molecular gas was acquired from an external source or perhaps is leftover from a major merger, but it cannot have been produced through internal stellar mass loss. The sense of the CO rotation in NGC 3032 is consistent with that of the young kinematically decoupled core, however, which suggests that this is an example of a stellar substructure forming through dissipational processes.
In two cases (NGC 4459 and NGC 4526) the CO kinematics provide powerful, independent confirmation of the dynamical mass-to-light ratios inferred by Cappellari et al. (2006). The mass-to-light ratios were derived from the SAURON stellar kinematic data via two-integral Jeans and three-integral Schwarzschild dynamical models and were used to infer circular velocity curves. Simple tilted ring models are presented in which the molecular gas rotates at the circular velocity (or, in NGC 4526, 95% of the circular velocity, a decrease which is roughly consistent with the uncertainty in the mass-to-light ratio). Comparison of the model and observed major axis position-velocity diagrams indicates that the circular velocity inferred from stellar kinematics alone is consistent with the behavior of the molecular gas. The agreement is significant because it is rare to be able to make this kind of an independent check of the stellar dynamical analysis.
Several puzzling results of this work deserve further study; these are disagreements between the gaseous and the stellar kinematics at sub-kpc scales. For example, in NGC 4150 the CO velocities appear to be inconsistent with those of the young (counterrotating) stellar core. In NGC 3032 the observed CO velocities are significantly lower than the circular velocity curve (amounting to an implied factor of two less mass interior to 700 pc and even more at smaller radii). At present it is not known whether the stellar kinematic data give an overestimated circular velocity for this galaxy or whether the recently accreted molecular gas is not following circular orbits. Higher resolution CO observations will also be necessary to check whether NGC 4150 shows an inconsistency between CO velocities and circular velocities. Finally, the relationships between molecular gas and ionized gas should contribute valuable insights into star formation and the evolution of the ISM in these lenticulars.
References
- Akeson (1998) Akeson, R. 1998, BIMA memo series #68
- Baldry et al. (2004) Baldry, I. K., Glazebrook, K., Brinkmann, J., Ivezi/’c, Z., Lupton, R. H., Nichol, R. C., and Szalay, A. S., 2004, ApJ, 600, 681
- Bertola et al. (1992) Bertola, F., Buson, & Zeilinger, 1992, ApJ, 401, L79
- Binney & Merrifield (1998) Binney, J., & Merrifield, M. R. 1998, Galactic Astronomy. Princeton Univ. Press, Princeton, NJ
- Brighenti & Mathews (1996) Brighenti, F., & Mathews, W. G. 1996, ApJ470, 747
- Brighenti & Mathews (1997) Brighenti, F., & Mathews, W. G. 1997, ApJ490, 592
- Bureau & Chung (2006) Bureau, M., & Chung, A. 2006, MNRAS, 366, 182
- Cappellari (2002) Cappellari, M. 2002, MNRAS, 333, 400
- Cappellari et al. (2006) Cappellari, M., Bacon, R., Bureau, M., Damen, M. C., et al. 2006, MNRAS, 366, 1126
- Cappellari et al. (2007) Cappellari, M., Emsellem, E., Bacon, R., et al. 2007, MNRAS, 379, 418
- Ciotti et al. (1991) Ciotti, L., Pellegrini, S., Renzini, A., & D’Ercole, A. 1991, ApJ, 376, 380
- Clark (1980) Clark, B. G. 1980, A&A, 89, 377
- Combes et al. (2007) Combes, F., Young, L. M., & Bureau, M. 2007, MNRAS, 377, 1795
- Condon (1992) Condon, J. J. 1992 ARAA 30, 575
- Courteau et al. (2007) Courteau, S., McDonald, M., Widrow, L. M., & Holtzman, J. 2007, ApJ, 655, L21
- Cretton, Rix, & de Zeeuw (2000) Cretton, N., Rix, H.-W., & de Zeeuw, P. T. 2000, ApJ, 536, 319
- Das et al. (2005) Das, M., Vogel, S. N., Verdoes Kleijn, G. A., O’Dea, C. P., & Baum, S. A. 2005, ApJ, 629, 757
- Davies & Lewis (1973) Davies, R. D., & Lewis, B. M. 1973, MNRAS, 165, 231
- de Zeeuw et al. (2002) de Zeeuw, P. T., et al. 2002, MNRAS, 329, 513
- de Vaucouleurs et al. (1991) de Vaucouleurs, G., de Vaucouleurs, A., Corwin Jr., H.G., Buta, R. J., Paturel, G., & Fouque, P. 1991, Third Reference Catalogue of Bright Galaxies, Version 3.9
- Dolphin (2000) Dolphin A.E., 2000, PASP, 112, 1397
- Duprie & Schneider (1996) Duprie, K., & Schneider, S. E. 1996, AJ, 112, 937
- Emsellem et al. (1994) Emsellem, E., Monnet, G., & Bacon, R. 1994, A&A, 285, 723
- Emsellem et al. (2004) Emsellem, E., et al. 2004, MNRAS, 352, 721
- Emsellem et al. (2007) Emsellem, E., et al. 2007, MNRAS, 379, 401
- Faber & Gallagher (1976) Faber, S. M. & Gallagher, J. S. 1976, ApJ, 204, 365
- Falco et al. (1999) Falco, E. E., et al. 1999, PASP, 111, 438
- Fisher et al. (1995) Fisher, K. B., Huchra, J. P., Strauss, M. A., Davis, M., Yahil, A., & Schlegel, D. 1995, ApJS, 100, 69
- Ho (2007) Ho, L. C. 2007, ApJ, 669, 821
- Huchtmeier, Sage, & Henkel (1995) Huchtmeier, W., Sage, L. J., & Henkel, C. 1995, A&A, 300, 675
- Kaviraj et al. (2006) Kaviraj, S., Schawinski, K., Devriendt, J. E. G., et al. 2006, ApJ, submitted (astro-ph/0601029)
- Knapp et al. (1994) Knapp, G. R., the revised IRAS fluxes which are quoted in NED
- Knapp & Rupen (1996) Knapp, G. R. & Rupen, M. P. 1996, ApJ, 460, 271
- Krajnović et al. (2006) Krajnović, D., Cappellari, M., de Zeeuw, P. T., & Copin, Y. 2006, MNRAS, 366, 787
- Kregel & van der Kruit (2004) Kregel, M., & van der Kruit, P. C. 2004, MNRAS, 352, 787
- Kuntschner et al. (2006) Kuntschner, H., Emsellem, E., Bacon, R., Bureau, M., et al. 2006, MNRAS, 369, 497
- Kuijken, Fisher, & Merrifield (1996) Kuijken, C., Fisher & Merrifield, M. 1996, MNRAS, 283, 543
- Lay (1999) Lay, O. 1999, BIMA memo series # 72
- Lees et al. (1991) Lees, J. F., Knapp, G. R., Rupen, M. P., & Phillips, T. G. 1991, ApJ, 379, 177
- Leroy et al. (2005) Leroy, A., Bolatto, A. D., Simon, J. D., & Blitz, L. 2005, ApJ, 625, 763
- Maraston (2005) Maraston, C. 2005, MNRAS, 362, 799
- McDermid et al. (2006a) McDermid, R. M., Emsellem, E., Shapiro, K. L., et al. 2006a, MNRAS, 373, 906
- McDermid et al. (2006b) McDermid, R. M., et al. 2006b, in Adaptive Optics-Assisted Integral-Field Spectroscopy, eds. R. G. M. Rutten, C. R. Benn, & J. Mendez, New Astr. Rev., 49, 521
- Mei et al. (2005) Mei, S., et al. 2005, ApJ, 625, 121
- Morganti et al. (2006) Morganti, R., de Zeeuw, P. T., Osterloo, T. A., McDermid, R. M., Drajnović, D., Cappellari, M., Kenn, F., Weijmans, A., & Sarzi, M. 2006, MNRAS, 371, 157
- Okuda et al. (2005) Okuda, T., Kohno, K., Iguchi, S., & Nakanishi, K. 2005, ApJ, 620, 673
- Regan et al. (2001) Regan, M. W., Thornley, M. D., Helfer, T. T., Sheth, K., Wong, T., Vogel, S. N., Blitz, L., & Bock, D. C.-J. 2001, ApJ, 561, 218
- Sage & Wrobel (1989) Sage, L. J., & Wrobel, J. M. 1989, ApJ, 344, 204
- Sage & Welch (2006) Sage, L. J., & Welch, G. A. 2006, ApJ, 644, 850
- Sage, Welch, & Young (2007) Sage, L. J., Welch, G. A., & Young, L. M. 2007, ApJ, 657, 232
- Sakamoto et al. (1999) Sakamoto, K., Okumura, S. K., Ishizuki, S., & Scoville, N. Z. 1999, ApJ, 525, 691
- Sarzi et al. (2005) Sarzi, M., Falcón-Barroso, J., Davies, R. L., Bacon, R., Bureau, M., et al. 2005, MNRAS, 366, 1151
- Sault, Teuben, & Wright (1995) Sault, R. J., Teuben, P. J., & Wright, M. C. H. 1995, in ASP Conf. Ser. 77, Astronomical Data Analysis Software and Systems IV, ed. R. A. Shaw, H. E. Payne, & J. J. E. Hayes (San Francisco: ASP), 433
- Schlegel et al. (1998) Schlegel, D. J., Finkbeiner, D. P., & Davis, M. 1998, ApJ, 500, 525
- Shields et al. (2006) Shields, G. A., Menezes, K. L., Massart, C. A., & Vanden Bout, P. 2006, ApJ, 641, 683
- Swaters et al. (1999) Swaters, R. A., Schoenmakers, R. H. M., Sancisi, R., & van Albada, T. S. 1999, MNRAS304, 330
- Temi, Brightenti, & Mathews (2007) Temi, P., Brighenti, F., & Mathews, W. G. 2007, ApJ, 660, 1215
- Thomas et al. (2003) Thomas, D., Maraston, C., & Bender, R. 2003, MNRAS, 339, 897
- Thronson et al. (1989) Thronson, H. A., Tacconi, L., Kenney, J., Greenhouse, M. A., Margulis, M., Tacconi-Garman, L., & Young, J. S. 1989, ApJ, 344, 747
- Tonry et al. (2001) Tonry, J. L., Dressler, A., Blakeslee, J. P., et al. 2001, ApJ, 546, 681
- Valluri et al. (2004) Valluri, M., Merritt, D., & Emsellem, E. 2004, ApJ, 602, 66
- Wardle & Knapp (1986) Wardle, M., & Knapp, G. R. 1986, AJ, 91, 23
- Welch et al. (1996) Welch, W. J. et al. 1996, PASP, 108, 93
- Welch & Sage (2003) Welch, G. A., & Sage, L. J. 2003, ApJ, 584, 260
- Wong (2001) Wong, T. 2001, Ph.D. thesis, University of California at Berkeley.
- Yi et al. (2005) Yi, S. K., Yoon, S.-J., Kaviraj, S., et al. 2005, ApJ, 619, L111
- Young (2002) Young, L. M. 2002, AJ124, 788
- Young et al. (2006) Young, L. M., Rosolowsky, E., van Gorkom, J. H., & Lamb, S. A. 2006, ApJ, 650, 166
- Yun, Reddy, & Condon (2001) Yun, M. S., Reddy, N. A., & Condon, J. J. 2001 ApJ 554, 803