Near-Infrared observations of the type Ib Supernova SN2006jc: evidence of interactions with dust
Abstract
In the framework of a program for the monitoring of Supernovae in the Near-Infrared (NIR) carried out by the Teramo, Rome and Pulkovo observatories with the AZT-24 telescope, we observed the Supernova SN2006jc in the photometric bands during a period of 7 months, starting days after its discovery. Our observations evidence a NIR re-brightening, peaking days after discovery, along with a reddening of and colors until 120 days from discovery. After that date, seems to evolve towards bluer colors. Our data, complemented by IR, optical, UV and X-ray observations found in the literature, show that the re-brightening is produced by hot dust surrounding the supernova, formed in the interaction of the ejecta with dense circumstellar matter.
1 Introduction
One of the main aims in the astronomical research on Supernovae (SNe) has been the study of hydrogen-deficient objects, among them Type Ib SNe (helium-rich) and Type Ic SNe (helium-deficient; see Filippenko 1997 for a review on SNe classification). These two subclasses of events are of great interest because, more than for all other types into which SNe have been classified, there are still many issues open about them, both in terms of observational properties and concerning their progenitors and the physics of the explosion. A number of different models have been proposed to account for the observed characteristics of SNe Ib/c. The most agreed scenario is that of the core-collapse (CC) of massive stars. It is now believed that their progenitors are Wolf-Rayet stars, i. e., highly evolved stars that have shed their H envelopes (or He envelopes in the case of SNe Ic progenitors) due to mass transfer in a binary system or by means of a stellar wind (for an updated review, see Crowther 2007). However, no observational evidence has been found to date allowing one to identify an explosion picture.
Since supernovae are believed to be a major source of dust in galaxies (Todini & Ferrara 2001, and references therein), events showing signatures of interactions with circumstellar matter are of great interest to study how dust forms around these objects. In particular, NIR observations until late epochs are instrumental in providing information on the ongoing processes. As an example, IR traces of dust condensation were found in the ejecta of SN1987A starting days after the outburst (see, e. g., Bouchet & Danziger 1993). Unfortunately, only in few cases good NIR light curves spanning until late epochs are available. The observatories of Teramo (Italy), Rome (Italy) and Pulkovo (Russia) are involved in a program aimed at providing accurate light curves of SNe in the Near-Infrared (Di Carlo et al. 2002, Di Paola et al. 2002, Valentini et al. 2003) by using a dedicated 1m class telescope equipped with a Near-Infrared camera. In the framework of this program, we present the results of our NIR follow-up of SN2006jc, discovered on 2006 October 9.752 UT (Nakano et al. 2006) in the Galaxy UGC 4904. The earliest photometric and spectroscopic observations (Crotts et al. 2006; Itagaki et al. 2006; Modjaz et al. 2006) already identified the object as a peculiar Type Ib SN a few days past maximum light. The main feature of SN2006jc in the NIR is a late re-brightening in the corresponding Light Curves (LCs), making SN2006jc an intriguing event, that gives us a huge opportunity for a study of dust formation around CC SNe and allows to deepen our knowledge on how massive stars die.
Nakano et al. (2006) soon drew attention to an LBV-like luminous flare that had been detected in the same position as SN2006jc two years before. The spatial coincidence of the two events was carefully analyzed by Pastorello et al. (2007).
Both the character of the event and the preceding flare occurrence, led many groups to carry out ground-based and satellite observations from many facilities and over a wide range of wavelengths, providing a wealth of data. Arkharov et al. (2006) were the first ones to note that the NIR brightness of the SN was undergoing a steady increase after the optical maximum, suggesting some kind of relation with dust. Immler, Modjaz & Brown (2006) also suggested this, based on X-ray observations. It can be hypothesized that as a result of the LBV-like flare in 2004, a dense circumstellar medium was originated within which the supernova exploded. However, LBV stars are supposed to be massive stars in a brief and unstable evolutionary phase from core H-burning to He-burning (WR stage). So, stellar evolution theories do not predict that a star in this phase can become a Supernova after only two years or that a WR star would produce such a luminous eruption (Eldridge & Tout 2004; Heger et al. 2003). Pastorello et al. (2007) suggest as an alternative picture that the SN progenitor was part of a binary system and that the LBV-like eruption actually occurred in the companion star of the SN2006jc progenitor. Nevertheless, the SN would have exploded in a dense CSM, as testified by the evidence of interactions with it. Tominaga et al. (2007) used the available observations from the X-ray to the optical, complemented with our NIR photometry, and modeled the event as the explosion of a WR star that was during its main sequence phase. Dust carbonaceous grains would then have formed within the ejecta.
This is one of the peculiarities of SN2006jc, since dust signature is hardly found in Type Ib/c SNe. One of the few instances of Ib SNe whom dust may have been associated with is SN1990I. However, in this case the presence of dust was only indirectly inferred from the optical data (missing NIR information) around day 250 (Elmhamdi et al. 2004). SN2006jc is probably the very first instance of a Type Ib SN showing clear evidence of interaction with a dusty circumstellar environment, be the dust newly-formed or pre-existing.
The paper is organized as follows. We first describe the observations and data reduction (Sect. 2). Then we present the NIR light curves and color evolution of SN 2006jc, and describe the construction of a bolometric (uvoir) LC (Sect. 3). Finally, in Sect. 4 we discuss the most likely origin of the NIR emission and its main constraints to the circumstellar medium.
2 Observations and data reduction
The observations of the SN 2006jc were performed with the 1.1m AZT-24 Telescope at the Campo Imperatore Observatory (Italy), equipped with the Near-Infrared SWIRCAM camera (Brocato & Dolci 2003), which is based on a HgCdTe NICMOS3-class array (PICNIC). The detector is sensitive to radiation in the spectral range from 0.9 to 2.5 m and, at the focus of AZT-24, yields a scale of arcsec pixel-1, resulting in a field of view of arcmin2.
A single set of observations in one of the ,, bands consists of 3–5 off-source images and 5 on-source images. During a night, for each band the number of sets acquired was selected based on the source brightness in that band. The on-source images in a same set are dithered with maximum shifts of and the individual integration times are 30 seconds. Off-source frames are offset by and were taken with the same observational procedure and exposure times as the on-source ones, but using a wider () dithering. For each set, sky images were obtained as a median of the closest dithered off-source frames and subtracted from each on-source image in the same set.
A number of frames were acquired at twilight and used to obtain normalized flat-field images using the differential flat technique, as described in Di Carlo et al. (2002). Each sky-subtracted image was flat-field divided accordingly. To correct for residual low spatial frequency inhomogeneities in the system response over the frame, we used a set of observations of a standard star with many different pointings covering a grid of regularly-spaced positions on the detector area plus 7 more positions at the center. For each of the 56 frames, a ”sky” image was constructed by median-filtering together the 12 frames closest to it in time. Each sky was then removed from the corresponding frame and the obtained images were corrected for flat-field. Aperture photometry of the standard star was carried out on each image, yielding a flux (in counts) as a function of the position on the grid. We fitted a polynomial of 2nd degree to the grid and transformed it into a frame that, once normalized to the value at the centermost location, was used as a ”super-flat”. Therefore, after flat-fielding, each frame was further divided by the super-flat. The super-flats evidence large-scale smooth variations of at most mag from the frame center to its edge.
At last, the relevant scientific images were then obtained by removing the bad pixels, and finally registering and averaging together the dithered exposures using a threshold.
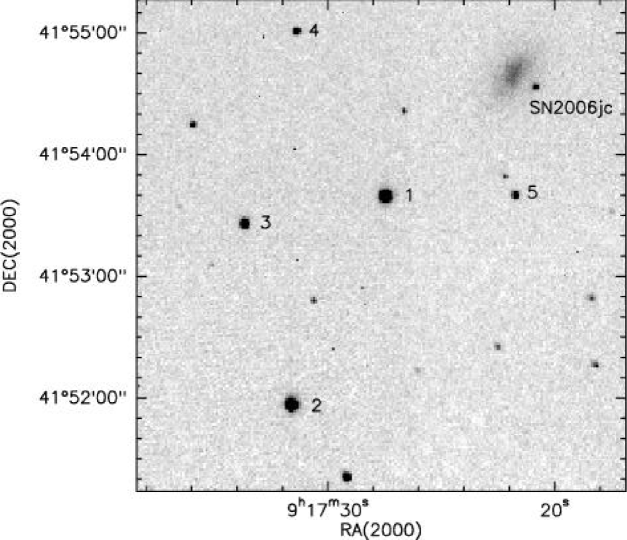
Photometric observations in the bands began on November 15, 2006, going on until June 6, 2007. The standard star AS20 (Hunt et al. 1998) was observed to calibrate a sequence of secondary standards properly selected in the supernova field among the ones with the highest S/N (stars 1–5 in Fig. 1). We checked the calibrated magnitudes of the stars in the local sequence against the 2MASS catalog and found that they are in general within mag of their 2MASS magnitudes. Only the two faintest ones exhibit larger differences in some of the band. Also, we found that the relative magnitudes of the local sequence remain constant within a few mag.
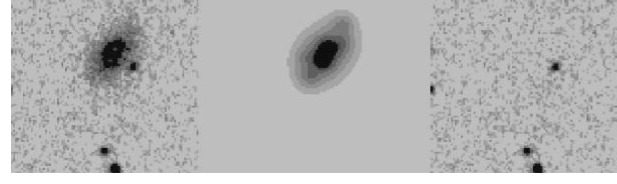
The magnitudes of SN2006jc and the secondary standards in the field, were obtained by Point-Spread Function photometry, using the ROMAFOT package (Buonanno et al. 1979). The procedure adopted to remove the contribution of the galaxy background diffuse emission is sketched in Fig. 2 and consisted of modeling the galaxy by a set of several (5–8) gaussians with variable Full-Width at Half-Maximum. The analytical reconstruction of the galaxy was subtracted from the original image and the background residual around the SN was checked interactively. Finally, the SN photometry was carried out on the subtracted image showing the flattest background distribution. Table 1 lists the results of our photometry. The uncertainties due to photon statistics and fitting are also indicated.
3 Results
3.1 The Near-Infrared Light Curves
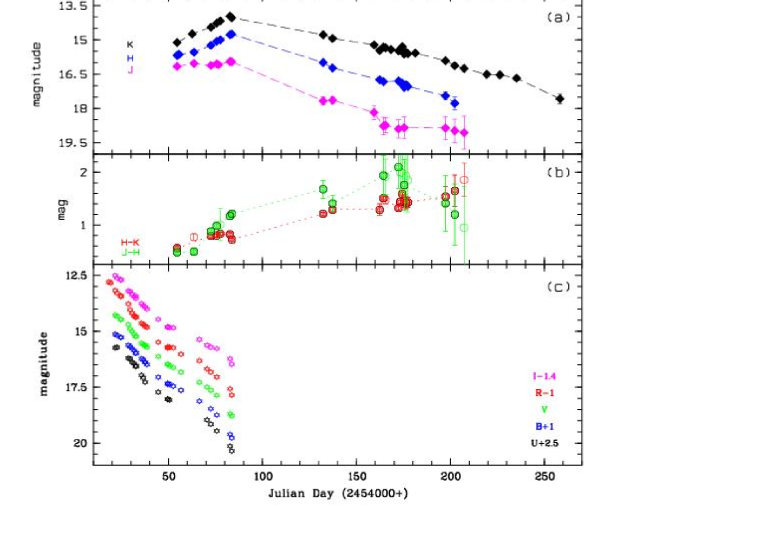
The Light Curves of SN 2006jc are shown in Fig. 3. Unfortunately, no NIR data are available around the optical maximum, the coverage starting roughly 36 days after discovery. The NIR LCs span a period of about 7 months and exhibit a clear peak (hereby, the re-brightening) around JD2454083 or shortly after (i. e., 60–70 days after discovery) that is correlated with a slope decrease in the light curves at optical wavelengths (see Fig. 3). In days, and became brighter by at least 1 mag, whereas in only a plateau is evident (or a small brightness increase, mag). Hence, the re-brightening mostly affected the NIR wavelengths and its effects became smaller and smaller at shorter wavelengths. Then, while and faded by mag in 120 days, dimmed by mag in 176 days. Note that the SN was brighter in than it was in and , so could be followed longer in this band. Two optical spectra taken around the re-brightening (Smith et al. 2007) exhibit a red continuum (along with a blue emission) that confirms excess emission in the NIR.
3.2 NIR color evolution
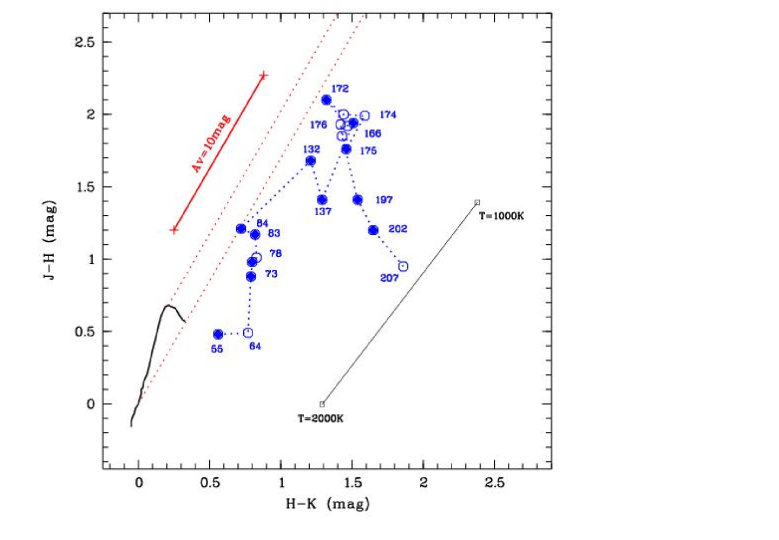
The evolution of the NIR colors ( and ) is also shown in Fig. 3. A reddening with time is evident, with having steadily increased by mag in days, whereas increased by mag in days and then decreased by mag, although with larger errorbars, in the last days of the plotted color curve. The evolution of NIR colors can be better studied in a color-color diagram, where it can be compared with cooling and extinction of known stellar sources. As shown in Fig. 4, the NIR colors of the SN mainly evolve along a track that is in practice parallel to the reddening vector. However, at the latest epochs plotted in the diagram, the blueing of evidenced above causes the SN colors to move in a different direction, roughly perpendicular to an extinction vector. Although the errors in become large at these late epochs, this change in color evolution might be real. Anyway, we are mainly concerned with the color evolution in the earlier phase shown in our diagram, i. e., during the re-brightening time, when the photometric errors are smaller.
This behavior in the NIR colors during the re-brightening is not only totally at odds with that of other non-stellar objects like SNe Ia (e. g., Valentini et al. 2003), where dust is expected to play quite a marginal role in the light emission, but also different, e. g., from that of a “dusty” core-collapse SN like the IIn-type 1999el (Di Carlo et al. 2002). In the latter case, dust is expected to be the main cause of the observed NIR excess and, in fact, the NIR colors evolve below the reddening band of the stellar main sequence in an vs. diagram. But the spread that it exhibits in the space of colors is much less than in the case of SN2006jc. Indeed, this evidence points to the fact that most of the NIR emission of SN2006jc at the epochs considered in this work, is likely to arise due to warm dust.
Two processes may be envisaged to explain the reddening trend with time of the NIR colors: steady formation of dust in front of a NIR source (which would cause the extinction to increase with time), or cooling of hot (i.e., K -K) dust shells surrounding the SN (irrespective whether formed in the ejecta or pre-existing in the circumstellar matter).
As for the first scenario, i. e., steady formation of dust in front of a NIR source, it leads to an extinction that is inconsistent with the optical and NIR light curves and it can be discarded (see Sect. 4). Nevertheless, it allows one to roughly derive an upper limit to the total mass of dust around the SN in the hypothesis of a spherically symmetric distribution of dust forming in the SN ejecta. From Fig. 4, the track in the color-color diagram spans roughly mag and this can be roughly assumed as the maximum extinction that dust may cause. From this, we can make an order-of-magnitude estimate of the dust mass involved. By using Eq. (7–18) from Spitzer (1978), assuming and a dust-to-gas mass ratio of 0.01, we obtain that the dust mass column density as a function of is given by:
| (1) |
where is the mass of a hydrogen atom. Note that the dust-to-gas mass ratio is only used to derive the dust mass column density from the gas column density in a galactic environment; as long as the dust properties are the same, the above relation holds in every other environment irrespective of the actual dust-to-gas ratio there. If we assume that the dust is homogeneously distributed in a spherical volume of radius , then the total dust mass is given by ; we can estimate cm, where is the ejecta velocity and is the time from the explosion (we adopted km s-1 and days). The dust mass needed to produce mag would then be . If the dust was concentrated in a thin shell at distance , it is easy to see that the mass would be increased by a factor 3. Also, we can expect that the grains are smaller than in the interstellar medium, then lowering their effective cross sections and further raising the mass.
In the framework of the second scenario, the NIR emission would be due to cooling dust. By assuming the dust to be homogeneously distributed in a plane-parallel geometry and at a constant temperature (although decreasing with time), from the radiative transfer equation we obtain , where is the dust emission efficiency, is the brightness of a blackbody at temperature and is the dust optical depth at a wavelength . We can then use the Wien approximation and see that the NIR colors are given by:
| (2) |
where every dependence on dust properties and opacity now lies in the term and, so, the dependence on is explicit. Once “starting” colors are given (for any initial , they are accounted for only in ), it is obvious that the cooling “sequence” causes a shift roughly in the same direction as the reddening vector. In particular, dust cooling from 2000 K to 1000 K would cause to redden by 1.2 mag and by 1.5 mag, enough to account for the total change in NIR colors observed. This is also shown in Fig. 4. The choice of the temperature interval is such to roughly agree with the determinations of grain temperatures at different epochs discussed in the following. Furthermore, the upper limit is determined by the dust sublimation temperature, that is K (e. g., Draine & Lei 2002).
The late color evolution, perpendicular to the reddening and to the blackbody sequence, cannot be explained either by extinction or by dust cooling. The most likely cause is a major change in the geometry of the source, in temperature gradients and/or in the grains properties.
3.3 Bolometric light curve
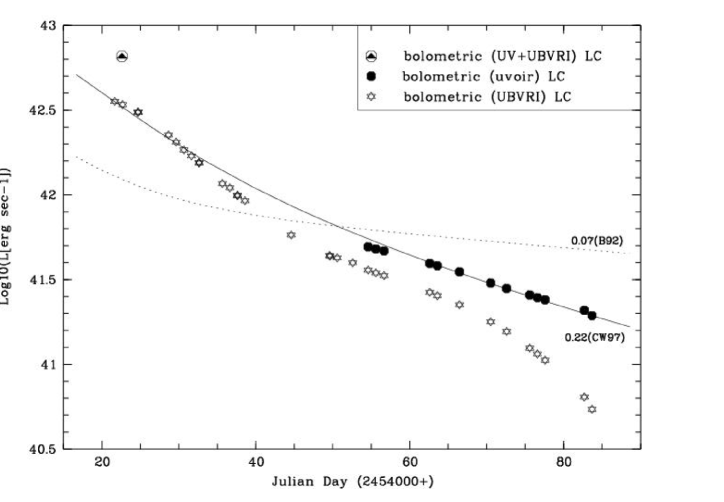
We used our photometry and the published photometry, listed in Pastorello et al. (2007), to construct both a “uvoir” (when the two datasets overlap) bolometric curve and a (quasi-)bolometric light curve. We assume a distance modulus of Mpc and a galactic extinction , as estimated by Pastorello et al. (2007). Measurements in all bands were first dereddened according to the extinction law from Cardelli et al. (1989), adopting that gives mag. The optical magnitudes were converted to fluxes according to Bessel (1979), while the NIR ones were converted according to Tokunaga & Vacca (2005), following the standard of the UK InfraRed Telescope. Note that ARNICA standards were defined using UKIRT standards (Hunt et al. 1998). We used spline fits to the LCs in order to have a homogeneous set of data at all wavelengths for each phase. The total flux at each epoch was computed by simply “connecting” the fluxes at the isophotal wavelengths and determining the total area. The results are listed in Table 2 and shown in Fig. 5. The error on the derived bolometric luminosity is dominated by that on the distance and the one due to the limited band used to calculate the total flux. As for the first, it is easy to see that it amounts to a % of the bolometric luminosity. Being systematic, it causes a shift of the bolometric light curve as a whole. The second contribution is more difficult to estimate, but it may be quite significant and may vary with time. However, it is likely to cause only small deformations of the logarithmic bolometric light curve, the major effect being a shift of the curve, as well.
It is clear from the figure that the inclusion of the NIR fluxes change significantly the slope of the bolometric LC, their contribution increasing with time from a factor 1.35 to a factor 3.6 of that from .
Figure 5 also shows the bolometric luminosity obtained on
JD2454022.6 by
adding the UV fluxes measured with Swift/UVOT (Brown et al. 2006);
the UV contribution amounts to % of that from .
We roughly estimated the UV fluxes111We used zero points, wavelengths
and count to flux ratioes as given in the Swift WEB page, at
http://heasarc.gsfc.nasa.gov/docs/heasarc/caldb/swift/docs/uvot/index.html
We also assumed in all three UV bands to estimate the
reddening correction for the UV flux.
on other dates from the figure shown
in Holland et al. (2007). We found that the UV to optical
plus NIR luminosity ratio appears to remain constant with time, although
it is also roughly equal to the ratio of UV to optical luminosity as calculated at
the discovery time, when NIR data are not available. Anyway,
we decided not to scale the bolometric luminosity by including a constant
contribution from UV emission, lacking a conclusive list of UV fluxes.
The point marked in Fig. 5 allows one to shift the bolometric light
curve as a whole if a constant fraction of UV contribution is assumed.
4 Discussion and conclusions
Among the two proposed scenarios to explain the NIR color evolution, that of pure extinction can be easily ruled out. Firstly, in the time interval when optical and NIR observations overlap, the extinction should have increased up to mag. This can be easily estimated from Fig. 4, exploiting the labeled dates. Since in this interval the increase in is “only” mag, the background emitting region should have steadily increased its brightness to “compensate” for the remaining mag of extinction. This can be obviously excluded. Secondly, even considering the much longer interval spanned by the NIR observations, a pure extinction scenario can be discarded on similar grounds. From Table 1 it can be seen that, e. g., increased by mag from the epoch of the re-brightening peak to the latest dates plotted in the color-color diagram. Since on this time-scale the extinction should have increased by mag, that translates into an increase of by mag, then the growth of would be fully explained by the extinction. Hence, the re-brightening would have needed again a source in the background of the newly-formed dust whose NIR flux at first increased and then remained almost constant.
The simpler way to explain the NIR re-brightening is that the shock or the UV-flash radiation engulfed a distant dense shell of circumstellar matter from a past eruptive episode of the progenitor, either forming new warm dust in the dense post-shock gas, or warming pre-existing dust. Smith et al. (2007) show that if this eruptive episode is related to the 2004 flare event, than the shock would have reached the corresponding shell in days, comparable with the epoch of the re-brightening. Whereas the bulk of the dust cooled behind, the shock or the UV flash would have yielded new layers of hot dust. We explored this possible mechanism by solving the transfer equation under the same assumptions as in Sect. 3.2, but adding a a plane-parallel outer layer of warmer dust around the emitting volume. If we adopt the reddening law by Rieke & Lebofsky (1985), then the variation of both magnitudes and NIR colors depends only on the temperatures of the two regions and their opacities (in the band). We checked that, by suddenly heating up the outer layer, a magnitude decrease of mag (in the bands) and a blueing in , of only few tenths of a mag can be yielded. This just using slightly different temperatures in the two regions (around 1500 K) and an optically thin outer envelope (). It is noteworth also that an optically thin inner layer produces better results. This would agree with what found by Foley et al. (2007), i. e., that there is little mass in the CSM, although there is evidence that it is quite dense. Our results are roughly consistent with both the magnitude decrease and the behavior around the re-brightening epoch, but fail to fit the apparent reddening of around peak evident in Fig. 4 (at , ). We also checked that two thicker layers (), with the outer one a little thicker and pre-existing, would fit better the data, since now is reddened by few tenths of a magnitude (along with , that however is less reddened). This may suggest that a shock proceeding in a moderately thick shell of circumstellar matter could fit marginally better the NIR data, although it does not agree with the estimated limit to the extinction. However, our two-layer model is too rough to help us deciding which is the best selection of physical parameters. Accurate modeling including dust properties (the adopted reddening law by Rieke & Lebofsky is likely not to fit newly-formed grains) and the actual distribution of the circumstellar matter around the SN is then needed to carefully investigate the proposed processes.
Sakon et al. (2007) observed SN2006jc in the NIR and MIR with IRC, on board the AKARI satellite, 200 days after discovery. They showed that the 2–5 m spectrum is well fitted by thermal emission from amorphous carbon grains at K. Smith et al. (2007) also suggest that some observational evidence gathered roughly 79 days after discovery, points to hot ( K) dust formation (carbonaceous grains) in a dense circumstellar shell engulfed by the shock. These confirm our scenario of dust cooling from K to K. According to Sakon et al. (2007), their derived temperature 200 days after discovery is consistent with newly formed dust; the total mass in carbonaceous grains at that date has been estimated to be . This is of the same order of the upper limit to the dust mass we have derived in Sect. 3.2 and may suggest that dust is not distributed with spherical symmetry. However, by using the same grain properties as in Sakon et al. (2007), we obtain a slightly lower opacity (in the band) than our estimated limit even in spherical symmetry.
Our NIR data alone do not allow us to discern between newly formed dust in dense post-shock gas and heating of pre-existing dust. But this issue can be addressed by comparing optical and NIR observations. In Fig. 5, the curve of luminosity from the radioactive decay of 56Ni and 56Co has been drawn (Branch 1992) for an initial mass of 56Ni. This process is believed to power the light curve at late epochs. No wonder that radioactive decay does not fit the slopes of the uvoir and (quasi-)bolometric curves, since an increasing escape probability of gamma rays with time is expected (Clocchiatti & Wheeler 1997). A simple model accounting for this effect in an expanding envelope has been developed by Clocchiatti & Wheeler (1997); it can be seen in Fig. 5 that by modifying the radioactive decay curve by including the decrease of -ray trapping, we obtain a good fit to the uvoir bolometric curve from JD2454060 on. Here we have assumed an initial mass of 56Ni, a kinetic energy erg s-1, an ejecta mass of and JD2454005 as the explosion date. These values are the same as the parameters derived by Tominaga et al. (2007) through one of their explosion models. However, note that our uvoir curve does not include the UV contribution, that appears to be a consistent fraction of the total radiated energy.
We draw attention to the clear steepening of the (quasi-)bolometric curve around JD2454070, after being roughly parallel to the modeled bolometric curve for days. This is obviously not matched by the uvoir bolometric curve and reflects an analogous steepening of the LCs around the same date (see Fig. 4). This has not been found in other Ib/c SNe, where the decline rate both of the band LC and of the (quasi-)bolometric curve, although larger than the slope of radioactive decay curve, remains constant until later epoch (Elmhamdi et al. 2004, Pastorello et al. 2007, Valenti et al. 2007). I. e., they usually are correlated to the radioactive decay curve (when -ray trapping is accounted for) until late epochs. The drop of the curve is riminiscent of what found for SN1990I significantly later, around 250 days after maximum, and attributed to dust formation (Elmhamdi et al. 2004). Since in the case of SN2006jc the drop is well correlated with the re-brightening, in our view it also is the signature of incipient dust formation, occurring earlier than in the case of SN1990I. The drop of the (quasi-)bolometric curves is also evident in Fig. 9 of Tominaga et al. (2007), where it clearly departs from their modeled bolometric curves from the same date on. Note that the analogous drop in the band LC is less than that in the band LC (see Fig. 4), as is expected from the extinction law. The amount of extinction at maximum can be roughly derived by fitting a linear relation to the (quasi-)bolometric curve in the period JD2454050–2454070 and measuring the difference between the actual curve and this line. This implies an mag, or of dust assuming it is homogeneously distributed in a spherical volume of radius (as defined in Sect. 3.2). This values are much lower than those involved in our pure extinction scenario, then consistent with its rejection.
The last open issue is that of the source of energy fueling the re-brightening. As shown, the uvoir bolometric curve appears to be consistent with the curve of radioactive decay, once modified by including the simple -ray trapping model developed by Clocchiatti & Wheeler (1997). This would accord with Tominaga et al. (2007), that propose the radioactive decay as the major energy input powering the LCs. Nevertheless, the presence of UV excess in two spectra taken during the re-brightening (Smith et al. 2007) would indicate the shock as the major contributor to grain heating, leading to the NIR re-brightening. This is also suggested by the concomitant brightening of X-ray emission, from days to days after discovery (Immler et al. 2007). Holland et al. (2007) observed SN2006jc through the three UV bands (UVW1, UVM2, UVW2) allowed by UVOT on board the Swift satellite. Although still tentative, their data seem to show a decrease in the slope of the corresponding LCs during the re-brightening and they found evidence that the UV color became bluer with time. As shown in Sect. 3.3, the UV to the optical plus NIR luminosity ratio appears to remain constant with time; since the NIR increases in fraction with respect to the optical, then the UV fraction has also to increase with respect to the optical. Pending a refinement of data reduction, the available UV and X-ray data point to a correlation with the NIR re-brightening that would confirm the occurring of an interaction of the ejecta with circumstellar matter.
In summary, the case for a strong interaction of SN2006jc ejecta and
a dense circumstellar medium leading to the formation of hot dust
in the post-shock denser gas,
appears well supported by the available dataset of multi-wavelength observations.
This work is supported by governmental grant PRIN-MIUR 2006, under the scientific project: “Fasi finali dell’evoluzione stellare - Nucleosintesi in Supernovae.“ This publication makes use of data products from the Two Micron All Sky Survey, which is a joint project of the University of Massachusetts and the Infrared Processing and Analysis Center/California Institute of Technology, funded by the National Aeronautics and Space Administration and the National Science Foundation.
References
- Arkharov et al. (2006) Arkharov, A., Efimova, N., Leoni, R., Di Paola, A., Di Carlo, E., Dolci, M. 2006, ATel, 961, 1
- Bessel (1979) Bessel, M. S. 1979, PASP, 91, 589
- Bouchet & Danziger (1993) Bouchet, P., & Danziger, I. J. 1993, A&A, 273, 451
- Branch (1992) Branch, D. 1992, ApJ, 392, 35
- Brocato & Dolci (2003) Brocato, E. & Dolci, M. 2003, Mem. SAIt Suppl. 74, 110
- Brown et al. (2006) Brown, P., Immler, S., Modjaz, M. 2006, ATel 916, 1
- Buonanno et al. (1979) Buonanno, R., Corsi, C. E., De Biase, G. A., Ferraro, I. 1979, International Workshop on Image Processing in Astronomy. Proceedings of the 5th. Colloquium on Astrophysics, held in Trieste, Italy, June 4-8, 1979. Editors, G. Sedmak, M. Capaccioli, R. J. Allen; Publisher, Osservatorio Astronomico di Trieste, Trieste, Italy, 1979. ISBN # NONE. LC # QB51.3.E43 C64 1979, P. 354, 1979 354
- Cardelli et al. (1989) Cardelli, J. A., Clayton, G. C. & Mathis, J. S. 1989, ApJ, 345, 245
- Clocchiatti & Wheeler (1997) Clocchiatti, A. & Wheeler, J. C. 1997, ApJ, 491, 375
- Crotts et al. (2006) Crotts, A., Eastman, J., Depoy, D., Prieto, J. L., Garnavich, P. 2006, CBET, 672
- Crowther (2007) Crowther, P. A. 2007, ARA&A, 45, 177
- Di Carlo et al. (2002) Di Carlo, E., Massi, F., Valentini, G., et al. 2002, ApJ, 573, 144
- Di Paola et al. (2002) Di Paola, A., et al. 2002, A&A, 393, L21
- Draine & Lei (2002) Draine, B. T. & Lei, H. 2002, ApJ, 569, 780
- Elhamdi et al. (2004) Elmhamdi, A., Danziger, I. J., Cappellaro, E., et al. 2004, A&A, 426, 963
- Eldridge & Tout (2004) Eldridge, J. J. & Tout, C. A. 2004, MNRAS, 353, 87
- Filippenko (1997) Filippenko, A. V. 1997, ARA&A, 35, 309
- Foley et al. (2007) Foley, R. J., Smith, N., Ganeshalingam M., Li, W., Chornock, R., & Filippenko, A. V. 2007, ApJL, 657, 105
- Heger et al. (2003) Heger, A., Fryer, C. L., Woosley, S. E., Langer, N. & Hartmann, D. H. 2003, ApJ, 591, 288
-
Holland et al. (2007)
Holland, S.,et al. 2007, Supernova
1987A: 20 Years After: Supernovae and Gamma-Ray Bursters. Ed. S. Immler, K. W. Weiler and R. McCray (AIP: New York), in press. The poster paper is
available at:
http://astrophysics.gsfc.nasa.gov/conferences/supernova1987a/Hollandposter.pdf - Hunt et al. (1998) Hunt, L. K., Mannucci, F., Testi. L., Migliorini, S., Stanga, R. M., Baffa, C., Lisi, F., & Vanzi, L. 1998, AJ, 115, 2594
- Immler, Modjaz & Brown (2006) Immler, S., Modjaz, M. & Brown, P. J. 2006, ATel 934, 1
- Immler et al. (2007) Immler, S., et al. 2007 ApJ submitted
- Itagaki et al. (2006) Itagaki, K. et al. 2006, IAUC 8762
- Koornneef (1983) Koornneef, J. 1983, A&A, 128, 84
- Modjaz et al. (2006) Modjaz, M. et al. 2006, CBET, 667
- Nakano et al. (2006) Nakano, S., Itagaki, K., Puckett, T., & Gorelli, R. 2006, CBET, 666
- Pastorello et al. (2007) Pastorello, A., Smartt, S. J., Mattila, S., et al. 2007, Nature, 447, 829
- Rieke & Lebofsky (1985) Rieke, G. H., & Lebofsky, M. J. 1985, ApJ, 288, 618
- Sakon et al. (2007) Sakon, I., et al. 2007, submitted to ApJ (arxiv:0711.4801)
- Smith, Foley & Filippenko (2007) Smith, N., Foley, R. J. & Filippenko, A. V., 2007, ApJ submitted (astro-ph 0704.2249)
- Spitzer (1978) Spitzer, L. 1978, Physical processes in the Interstellar Medium, John Wiley & Sons, New York
- Todini & Ferrara (2001) Todini, P., & Ferrara, A. 2001, MNRAS, 325, 726
- Tokunaga & Vacca (2005) Tokunaga, A. T. & Vacca, W. D. 2005, PASP 117, 421
- Tominaga et al. (2007) Tominaga, N., et al. 2007, ApJ submitted [arXiv: astro-ph/0711.4782]
- Valenti et al. (2007) Valenti, S. et al. 2007, MNRAS in Press [arXiv: astro-ph/0710.5173]
- Valentini et al. (2003) Valentini, G. et al. 2003, ApJ, 595,779
| Julian Day | ||||||
|---|---|---|---|---|---|---|
| (2454000+) | (mag) | (mag) | (mag) | (mag) | (mag) | (mag) |
| 54.6 | 16.16 | 0.04 | 15.68 | 0.04 | 15.12 | 0.03 |
| 55.6 | 15.64 | 0.04 | ||||
| 62.6 | 14.74 | 0.04 | ||||
| 63.6 | 16.03 | 0.05 | 15.54 | 0.03 | ||
| 72.6 | 16.12 | 0.05 | 15.24 | 0.02 | 14.45 | 0.04 |
| 75.6 | 16.05 | 0.04 | 15.07 | 0.02 | 14.27 | 0.02 |
| 76.6 | 16.09 | 0.05 | ||||
| 77.6 | 15.00 | 0.02 | 14.17 | 0.02 | ||
| 82.7 | 15.95 | 0.06 | 14.78 | 0.02 | 13.96 | 0.02 |
| 83.7 | 15.96 | 0.04 | 14.75 | 0.02 | 14.03 | 0.02 |
| 132.3 | 17.67 | 0.17 | 15.99 | 0.03 | 14.78 | 0.02 |
| 137.3 | 17.64 | 0.15 | 16.23 | 0.03 | 14.94 | 0.03 |
| 159.4 | 18.18 | 0.31 | 15.22 | 0.04 | ||
| 162.4 | 16.75 | 0.05 | 15.46 | 0.10 | ||
| 164.4 | 18.77 | 0.38 | 16.83 | 0.03 | 15.32 | 0.05 |
| 165.5 | 18.74 | 0.33 | 15.35 | 0.05 | ||
| 168.4 | 15.42 | 0.06 | ||||
| 172.4 | 18.90 | 0.40 | 16.80 | 0.02 | 15.48 | 0.05 |
| 173.4 | 16.87 | 0.02 | 15.43 | 0.06 | ||
| 174.4 | 16.89 | 0.02 | 15.30 | 0.07 | ||
| 175.4 | 18.84 | 0.48 | 17.0 8 | 0.04 | 15.62 | 0.12 |
| 176.4 | 16.96 | 0.03 | 15.54 | 0.11 | ||
| 177.4 | 17.04 | 0.02 | 15.61 | 0.09 | ||
| 181.3 | 15.58 | 0.11 | ||||
| 197.4 | 18.86 | 0.50 | 17.45 | 0.17 | 15.91 | 0.09 |
| 202.3 | 18.98 | 0.51 | 17.78 | 0.28 | 16.13 | 0.11 |
| 207.3 | 19.06 | 0.72 | 16.25 | 0.13 | ||
| 219.3 | 16.51 | 0.11 | ||||
| 226.3 | 16.53 | 0.11 | ||||
| 235.2 | 16.68 | 0.11 | ||||
| 258.3 | 17.58 | 0.21 |
| Julian Day | ||
|---|---|---|
| (2454000+) | [erg s-1] | [erg s-1] |
| 21.66 | 42.55 | |
| 22.68 | 42.53 | |
| 24.68 | 42.48 | |
| 24.70 | 42.49 | |
| 28.65 | 42.35 | |
| 29.64 | 42.31 | |
| 30.66 | 42.26 | |
| 31.63 | 42.23 | |
| 32.63 | 42.19 | |
| 32.63 | 42.19 | |
| 35.66 | 42.07 | |
| 36.62 | 42.04 | |
| 37.61 | 42.00 | |
| 37.62 | 41.99 | |
| 38.59 | 41.96 | |
| 44.60 | 41.76 | |
| 49.58 | 41.64 | |
| 49.64 | 41.64 | |
| 50.58 | 41.63 | |
| 52.59 | 41.60 | |
| 54.60 | 41.56 | 41.69 |
| 55.60 | 41.54 | 41.68 |
| 56.67 | 41.52 | 41.67 |
| 62.60 | 41.43 | 41.59 |
| 63.60 | 41.41 | 41.58 |
| 66.47 | 41.35 | 41.55 |
| 70.53 | 41.25 | 41.48 |
| 72.60 | 41.19 | 41.45 |
| 75.60 | 41.10 | 41.41 |
| 76.60 | 41.06 | 41.39 |
| 77.60 | 41.02 | 41.38 |
| 82.70 | 40.81 | 41.32 |
| 83.70 | 40.73 | 41.29 |