Modelling background intensity in Affymetrix Genechips
Abstract
DNA microarrays are devices that are able, in principle, to detect and quantify the presence of specific nucleic acid sequences in complex biological mixtures. The measurement consists in detecting fluorescence signals from several spots on the microarray surface onto which different probe sequences are grafted. One of the problems of the data analysis is that the signal contains a noisy background component due to non-specific binding. This paper presents a physical model for background estimation in Affymetrix Genechips. It combines two different approaches. The first is based on the sequence composition, specifically its sequence dependent hybridization affinity. The second is based on the strong correlation of intensities from locations which are the physical neighbors of a specific spot on the chip. Both effects are incorporated in a background functional which contains free parameters, fixed by minimization on a training data set. In all data analyzed the sequence specific parameters, obtained by minimization, are found to strongly correlate with empirically determined stacking free energies for RNA/DNA hybridization in solution. Moreover, there is an overall agreement with experimental background data and we show that the physics-based model proposed in this paper performs on average better than purely statistical approaches for background calculations. The model thus provides an interesting alternative method for background subtraction schemes in Affymetrix Genechips.
pacs:
87.15.-v, 82.39.PjI Introduction
DNA microarrays have become a powerful tool to monitor the gene expression level of thousands of genes simultaneously on a genome-wide scale (for a recent review see for instance Ref. Stoughton (2005)). Microarrays are based on the hybridization between the surface-bound DNA sequences (called probes) and DNA or RNA sequences in solution (called targets). The probes are designed to have a sequence exactly complementary to that of the desired target sequence one wishes to detect in solution. As the target molecules in solution are labelled with fluorescent markers, the amount of hybridized targets can be determined by means of optical measurements. The fluorescence intensity measured at a specific spot on the microarray reflects the concentration of complementary targets in the used sample solution.
One of the most prominent commercial platforms of DNA microarrays is provided by Affymetrix Lipshutz et al. (1999). By virtue of in-situ photolithographic techniques Affymetrix produces arrays in which more than one million different probes are grafted on a single chip. The probes are 25 nucleotides long sequences of single-stranded DNA. As a single 25-mer may not provide reliable measurements of the expression level of one specific gene, Affymetrix chooses 10-16 fragments of different regions for each gene, which together form a so-called probe set. Each probe set is to uniquely characterize a given gene.
One of the problems of the data analysis is that the measured fluorescence signal does not only contain information about the concentration of a specific gene in solution, but also of other sources of hybridization with fragments which only partially overlap with the surface-bound sequence. Thus, the measured fluorescence of a given probe site can be written as
| (1) |
where is the specific contribution of the signal which depends on the concentration of the complementary target in solution and is a background signal. The aim of this work is to introduce a new model which is based upon inputs from physical chemistry for the calculation of for Affymetrix arrays. Identifying the main sources of background intensity is crucial in order to make accurate and reliable estimates of gene expression levels mainly for weakly expressed genes, for which .
A peculiarity of Affymetrix Genechips is that probes come in pairs: a probe, the so-called perfect match (PM), has a sequence exactly complementary to the sequence in solution. A second probe, physically located as neighbor of the PM in the chip, has a single non-complementary base with respect to the specific target. The latter is known as mismatch (MM). Originally, MM’s were supposed to estimate only the non-specific hybridization, i.e. it was expected that , so that from eq. (1) one could have estimated . However, this approach experiences some difficulties as in some chips as many as of the MM intensities are higher than the corresponding PM’s Naef and Magnasco (2003) (although this seems to occur predominantly in low intensities regimes, where both PM and MM signals may be dominated by non-specific hybridization Binder and Preibisch (2005)). Moreover, it has been found that also depends on the concentration in solution of the almost complementary target sequence. Hence the background adjustment based on the difference currently does not receive much consensus and other strategies have been devised Gentleman et al. (2003). For a discussion of MM hybridization see also Refs. Carlon et al. (2006); Naef et al. (2006); Ferrantini and Carlon (2007).
Due to its central importance, the modeling of background intensities is not new. One can distinguish here between models using purely statistical treatment Irizarry et al. (2003a); aff (a, b); Li and Wong (2001) and others where physical inputs coming from equilibrium thermodynamics were employed Zhang et al. (2003); Held et al. (2003); Hekstra et al. (2003); Carlon and Heim (2006); Irizarry et al. (2003b). A more extensive discussion of previous studies in relation with our results is postponed to the final section of this paper.
In this paper we present a new method to estimate the background noise of Affymetrix gene expression arrays. We construct a functional which contains parameters, fixed by minimization on a set of training data. The functional takes into account the physical chemistry of hybridization by a subset of the parameters. These parameters depend on sequence composition and which are equivalent to the stacking free energies in the nearest-neigbor model Bloomfield et al. (2000). We also exploit the observation that the background signal of a given site strongly correlates with the intensities measured on neighboring sites. The accuracy of the results is tested on a set of spike-in data in which transcripts are added in solution at known concentration. In particular, being interested in the accuracy of our background predictions, we focus on the data at zero concentration. The model developed in this paper reproduces the spike-in data very well and in this particular case it performs better than other popular algorithms used for background adjustment in Affymetrix expression chips.
This paper is organized as follows: the background functional is introduced in Sec. II. The results of the minimization are given in Sec. III, where they are tested on the spike-in data set and compared with the prediction of other algorithms. Finally in Sec. IV we present a general discussion of the results obtained and provide some general conclusions.
II Model
Our approach to estimate the background intensity is twofold. First, we make use of the property of Affymetrix microarrays that neighboring probes have similar sequences, and hence also similar affinities for non-specific binding. We recall that a fluorescence image from an Affymetrix chip is contained in a file giving the coordinate of the probe and the corresponding measured intensity. By setup a PM probe is located at , with odd , and the corresponding MM probe is located at . Hence the chip is arranged in rows of PM and MM sequences, as shown in Fig. 1. PM and MM pair probes share all nucleotides but the middle (13th) one. Hence there is a strong sequence correlation between the rows with odd and the rows at . But the sequences of neighbors along the -direction are also correlated, as part of the microarray design.

The main idea of our approach is to use MM intensities as background estimates for the PM signals only for genes that are sufficiently low expressed, i.e. for which both PM and MM signals are low on the global scale of intensities in Affymetrix chips. An estimator is built up and optimized around these low-intensity data (to be defined more precisely later), which can then be applied to the whole chip, thus also in the high intensity regimes. Let us consider a MM at position . Because of correlations with the neighboring sequences its intensity value will be correlated to the intensities of the neighboring sites in the chip. In particular, we consider the weighted average of intensities of the two neighboring MM’s at positions , of the corresponding PM and of the two PM’s at positions , as shown in Fig. 1. Differences in sequences tend to cause gaussian fluctuations in the effective affinities, hence in the logarithm of the intensities , rather than in the intensities. The local dependence of the background functional takes thus the form
| (2) | |||||
in which are weight factors, constrained by .
A completely different indicator of the background intensity is purely based on the probe sequence. A well-known model to estimate the affinity between a DNA probe and its complementary RNA target is the nearest-neighbor model Bloomfield et al. (2000). Here, the affinity is given by a summation over pairs of neighboring nucleotides, in which each term can take 16 different values, depending on whether the sequence is AA, AC, AG, AT, , GG. We expect that the background signal is due to the binding to the probe sequence of short fragments of sequences from other genes, which are complementary to the probe over some fraction of its total length. We introduce 16 pair-strengths (with ) as fitting parameters.
To approximately incorporate the effects of “unzipping” of the DNA/RNA hybrid on its top and bottom, we add a parabolic weighting as a function of the position along the probe, around the middle of the probe at . In the fabrication of the chip the majority of probes does not reach its full length of nucleotides. The effect of length variation is modeled by linear deviations in this weighting function as well. In total, this yields
| (3) |
with and where
| (4) |
Here indicates the -th oligonucleotide of the sequence of a total length of 25 letters. Summing over all possible letters is equivalent to counting the frequency of each pair within a given sequence . The 16 parameters reflect the influence of each pair on the background intensity. According to the nearest-neighbor model, the parameters can be used to describe the formation of RNA/DNA hybrid duplexes Sugimoto et al. (1995). Also here, we expect that our approximations lead to a more or less gaussian spreading in the effective affinities. The sequence-based estimation of the background intensity is then given by .
We then combine the two different estimates for the background affinity with arbitrary weights:
| (5) |
where the relative weight for the first estimate is absorbed in the parameters — we no longer inforce the restriction — and the relative weight for the second estimate in the parameters .
We proceed by constructing a cost function whose minimization allows to obtain estimates of the 24 parameters in Eq.( 5). We write the cost function as an average over all probes of the squared difference between the actual background affinity and the prediction :
| (6) |
Here, is a subset of sequences which includes only sequences of those MM intensities whose corresponding PM intensities are below a certain threshold (in Affymetrix units) and which themselves do not exceed to exclude bright MMs from the analysis Naef and Magnasco (2003).
Equation (6) incorporates Affymetrix’ original idea of using MM intensities as background measures. Strict selection rules need to be imposed on the input data () to ensure that only those experimentally obtained values of are used which can be clearly attributed to background noise, and not to hybridization with the target complementary to the corresponding PM probe. But how do we find a criteria which identifies and filters the undesired probes? Fortunately, the Spike-In data at concentration (for details, see III.1) can be used as reference for background noise. By comparing the histograms of the input and Spike-In data (), a threshold intensity can be found such that both histograms are strongly correlated. In the present work, the threshold intensity is set to resulting in a discard of of the data. For comparison, saturated probes have intensities around 12,000.
The optimization algorithm used to perform the minimization of the cost function given in Eq. (6) is steepest descent with damped newtonian dynamics, in which Eq. (6) is interpreted as potential energy. The value obtained from the minimization procedure can be used as a measure for the quality of the attained minimum.
III Results
III.1 Experimental data
In the present work, we analyze data from Affymetrix microarray experiments which are publicly available under lat ; geo . The results (scanned intensities) of each experiment are saved in a so-called “CEL-file” (extension .CEL). For each probe, the CEL-file contains information about its physical location on the chip (- and -coordinate) and the mean intensity. The CEL-file does not contain any information about the probe set name or sequence. For further processing the so-called CDF-file (chip description file) is needed. Each CEL-file is associated with a CDF-file which allows to retrieve the information necessary to map each probe to its corresponding probe set. The sequence information can be found in the probe-tag-file. The probe-tag-file contains the name of each probe, its location, an Affymetrix specific probe interrogation position, the sequence and the target strandedness. The latter file is particularily useful if one wishes to investigate the sequence dependence of the measured intensities.
Affymetrix offers a large palette of gene expression arrays for different organisms. In this work, we focus on the analysis of two human genome chipsets, namely HGU95A and HGU133A, and two non-human organisms, the african clawed frog (Xenopus Laevis) and the zebrafish (Danio Rerio). All four chipsets are used, in a first step, to investigate and validate the correlation between well-known hybridization stacking energies and the 16 parameters of Eq. (5) (see Section III.3). As second step, we focus our attention to a subset of the HGU95A and HGU133A datasets, the so-called Latin Square Experiments lat . Those experiments serve as calibration experiments as some target sequences are added at controlled concentrations (“spiked-in”) to a background reference solution. The target concentrations range from 0 pM to 1024 pM. Since the spike-in experiments at zero concentration measure pure background, we use them as benchmark for our background functional Eq. (5).
III.2 Neighbor-dependent parameters
As discussed in Section II, the intensities of neighboring probes can be used to estimate the non-specific binding of a given probe, because of the design of Affymetrix microarrays. However, Eq. (2) takes only five neighbors into account although each spot on the array is surrounded by in total eight neighbors — four direct and four diagonal neighbors. Eq. (2) originally included eight parameters but it turned out that the intensity correlations with the “top” neighbors at (see Fig. 1) on the background intensity are much smaller than the row. The analysis of the correlation between sequences which are neighbors in the array explains why the neighbors are less useful.
For the HGU133A array all four nucleotides are roughly equally present, i.e. A, C, G, T densities are , , and . A consequence is that with two randomly chosen nucleotides, the probability of finding the same letter is . However, the probability of finding the same letter at the -th position at sites in and (or equally at ) is . This probability increases to when considering the neighbors and , for even y, which is not surprising as the probes at these locations are a pair of PM and MM, which share 24 out of 25 oligonucleotides. The probability of finding the identical nucleotide at for even is . We thus see that the sequence correlation along the -direction clearly exceeds the correlation along the -direction except when considering corresponding PM and MM probes. Because of this, the three “top” neighbors were not considered any further in order to restrict the computational effort to a minimum (see Fig. 1).
The functional minimization shows another interesting pattern: the three closest neighbor parameters , and are positively correlated with the background signal, while the diagonal neighbors and show negative correlations (the correspondence between and positions can be deduced from Eq. (2)). This result (i.e. , , and , ) is found in all chips analyzed. Typical average outputs on human genome chips of the Latin Square experiments are
| (7) |
The interpretation is as follows: The MM signal is most strongly correlated with its corresponding PM, as reflected by the magnitude of . The sequence at is closely correlated with the two MM neighbors (parameters and ), i.e. a strong background intensity at corresponds to a strong background at . However, a strong signal of the MM probes at may also be caused by the presence of complementary target molecules at high concentrations in solution. The functional corrects for this with negative coefficients for the signals at positions (parameters and ).
III.3 Sequence dependent parameters
The nearest-neigbor model is widely used to describe the thermodynamics of duplex formation of nucleic acids in solution as it yields good approximations of the sequence dependence of duplex stability (see e.g. Bloomfield et al. (2000)). It is based on the assumption that the stability of each base pair depends on the identity and orientation of the adjacent base pairs. For a given sequence of nucleotides the hybridization free energy is given by:
| (8) |
where are the stacking free energies associated to a pair of nucleotides ; counts the frequency of the pairs along the sequence and was defined in Eq. (4). In Eq. (8) we have added a term which depends on the end nucleotides and and it is referred to as helix initiation parameter .
The parameters and from which one obtains are known from hybridization experiments in solution. Due to symmetry considerations, there are only independent in the case of DNA/DNA duplexes (see Table 2 of SantaLucia Jr. (1998)). There are no such symmetries in RNA/DNA duplexes hence there are in total parameters, which were determined experimentally by Sugimoto et al. Sugimoto et al. (1995). Even though the nearest-neighbor model was originally developed to calculate duplex free energies in solution, it provides reasonable approximations to describe the energetics involved in the hybridization processes on Affymetrix microarrays Held et al. (2003); Carlon and Heim (2006). A recent experimental study Weckx et al. (2007) on a class of spotted arrays in which hybridization of perfect matching and multiple mismatching probes were analyzed, showed that the data are well described by nearest-neighbor parameters for duplex formation in solution.


Our approach to model the background intensity involves the determination of 24 parameters of which the 16 parameters reflect the influence of each pair on the background intensity. The relationship between the 16 parameters and the 16 stacking parameters is quickly derived. According to the Langmuir model the measured intensity at a given site is related to the hybridization free energy via
| (9) |
Recalling that the sequence dependent functional given in Eq. (3) is fitted to the logarithm of the intensity (see Eq. (5)) one expects that the parameters are linearly related to the the stacking free energy parameters . To verify inhowfar this linear relationship holds, all 16 parameters are calculated for each CEL-file, i.e. each chip by the minimization of the cost function Eq. (6). Then, each is averaged over all available CEL-files of a given chipset and plotted as a function of given in Ref. Sugimoto et al. (1995). Two of these plots for the Latin square set are shown in Fig. 2. The plots indicate that the linear relationship between and is approximately verified. The correlation coefficients for the linear fit are typically about . The Table 1 reports the correlation coefficients for H. Sapiens, X. Laevis and D. Rerio chipsets. The results show that our ansatz to include the nearest-neighbor model in the background estimation is justified and the influence of the pairs is not to be neglected.
| Chipset | # of CEL-files | Corr. coeff |
|---|---|---|
| HGU95A (1521) | 19 | 0.870 |
| HGU95A (1532) | 19 | 0.869 |
| HGU95A (2353) | 19 | 0.861 |
| HGU133A | 42 | 0.791 |
| XL (GSE 3334) | 6 | 0.805 |
| XL (GSE 3368) | 20 | 0.806 |
| XL (GSE 4448) | 31 | 0.792 |
| DR (GSE 5048) | 6 | 0.847 |
III.4 Benchmark: Spike In Data
To test the accuracy of the predicted background signal as given in Eq. (5), we turn our attention to the spike-in data. Concerning background analysis, we are naturally most interested in the spike-in data as the measured signal is pure background noise. By virtue of Eq. (5) we calculate the background signal for a given probe set of the Latin Square data for the chipsets HGU95A and HGU133A.
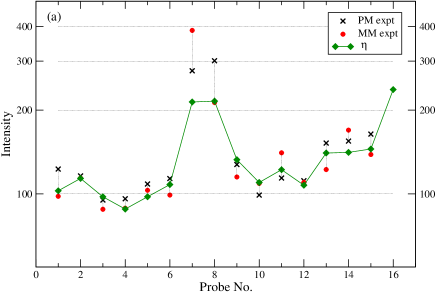
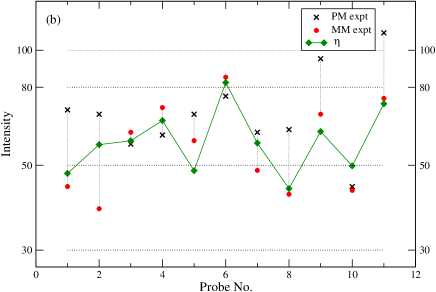
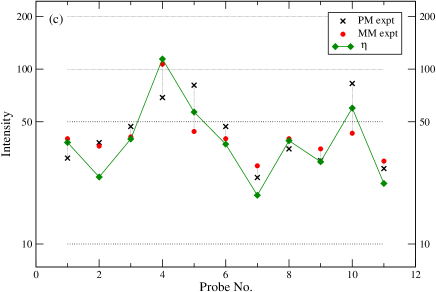
Fig. 3 is representative for the results of HGU95A and HGU133A. In general, we find that the predicted background intensity nicely follows the PM/MM intensities of the spike-in experiments at zero concentration and hence really describes the shape of the background. One would expect the PM and MM values at zero concentration to be almost identical; this is mostly the case as the median value of the difference for HGU95A shows. This value is even smaller for the HGU133A chipset, i.e. . Exceptions where either the PM or MM intensity clearly exceeds the median difference suggest the presence of transcript fragments which are complementary to the probe over a length of more nucleotides than one would statistically expect when considering background issues. Especially the origin of bright MM’s has been investigated intensively in the recent past (see e.g. Naef and Magnasco (2003); Carlon et al. (2006); Naef et al. (2006)).
III.5 Comparison to other approaches
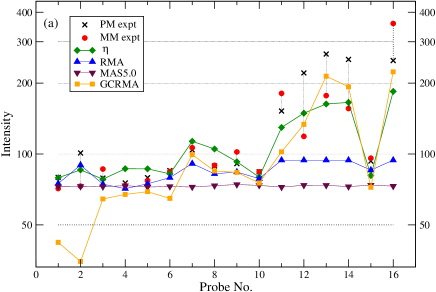
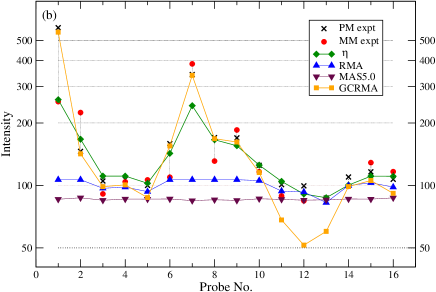
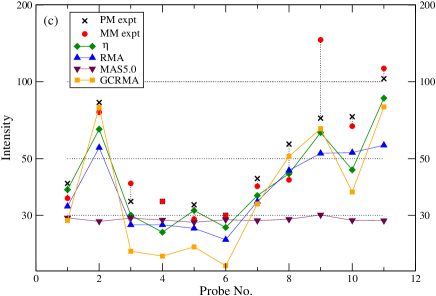
Figure 4 compares the performance of our background functional to three of the most commonly used algorithms, namely MAS5.0 aff (a, b), RMA Irizarry et al. (2003b) and GCRMA Wu et al. (2004). MAS5.0 is a commercial software for data analysis developed by Affymetrix. For our calculations we used the free version of MAS5.0 available under the open project Bioconductor Gentleman et al. (2003). RMA and GCRMA are two variants of the same type of algorithm, both freely available from Bioconductor.
In order to compare the performance of the background subtraction schemes, we calculated
| (10) |
i.e. the average squared deviation of the predicted background signal from MAS5.0, RMA, GCRMA and from our algorithm with respect to the experimental background intensity . The sum in Eq. (10) runs over all probes in the Affymetrix spike-in experiments at concentration .
The examples of Fig. 4 show that MAS5.0 underestimates the background values and hardly deviates from a straight line. MAS5.0 uses the lowest 2% of probe intensities of each region of a chip to estimate a background value. Each probe intensity is then background corrected based upon a weighted average of each of the background values. A detailed description can be found in aff (a, b). The background adjustment method used by RMA Irizarry et al. (2003b) uses a global model for the distribution of probe intensities. It is based on empirical findings on the distribution of probe intensities and only considers PM values as input as well as output. However, RMA does not take non-specific binding into account which often leads to an underestimation of the background. GCRMA Wu et al. (2004) is based on RMA and includes sequence information to calculate a so-called affinity measure. The results of GCRMA excel those of RMA and MAS5.0. However, we have found that in some cases after background subtraction GCRMA gives a higher value of the intensity compared to the original data, which signifies a negative background correction. For these points we have set in Eq. (10).
Table 2 reports the value of the mean squared deviation calculated from Eq. (10). Smaller values of this parameter signify a more accurate algorithm for the background estimation. The Table indeed shows that globally our physical-chemistry based algorithm, indicated as column , outperforms the three other statistical-based algorithms. As already anticipated by the graphs in Fig. 4, the performance of GCRMA is generally far better than MAS5.0 and RMA. Our algorithm improves further on GCRMA in all cases analyzed, except for the last set (HGU95A expertiment 2353) of Table 2.
| RMA | MAS5.0 | GCRMA | ||
|---|---|---|---|---|
| HGU133A | 0.161 | 0.521 | 1.589 | 0.194 |
| HGU95A-1521 | 0.163 | 0.760 | 1.127 | 0.200 |
| HGU95A-1532 | 0.203 | 0.698 | 1.041 | 0.343 |
| HGU95A-2353 | 0.099 | 0.508 | 0.777 | 0.088 |
IV Discussion
We have introduced a new model to predict background intensities in Affymetrix GeneChips. Our model takes into account the physical-chemistry involved in hybridization as well as the influence of the design of Affymetrix microarrays. The background functional developed in this paper contains two terms given by Eq. (2) and Eq. (3) that reflect these two contributions.
The sequence-based background estimate (Eq. (3)) includes 16 pair-strength-parameters . Physical-chemistry arguments suggest that these parameters are correlated to the hybridization free energies for the corresponding couple of nucleotides. One expects an approximate linear relationship between the two. The fact that the parameters are indeed linearly correlated to the hybridization free energies in solution, as shown in Fig. 2, suggests that the model presented here captures the origin of the background correctly. We recall that hybridization in Affymetrix expression arrays is between a DNA strand at the microarray surface and an RNA strand in solution, therefore the hybridization free energies to compare with are those for RNA/DNA duplexes. These were determined experimentally by Sugimoto et al. Sugimoto et al. (1995). It is worth mentioning that a previous study Zhang et al. (2003) of microarray data analysis using physical-chemistry inputs, although in a different way than what is depeloped here, reported a weaker correlation () between fitted affinities and the experimental parameters by Sugimoto et al. Sugimoto et al. (1995). In the experimental data considered in this study we find a correlation coefficient ranging from to (see Table 1) for the three different organisms analyzed. In our opinion, a good correlation with experimental stacking free energies provides a first important test of reliability of the analysis.
In our model, a second contribution to the background functional is given by the intensities at the locations that are physical neighbors on the microarray (Eq. (2)). The neighbors influence is understood as coming from the fact that neighboring locations have similar sequences, as a consequence of the design of Affymetrix microarrays: similar sequences imply similar background contributions. The local contribution to the background depends on five parameters which measure the strength of the correlations. As pointed out in Sec. III.2 the magnitude and signs of these parameters can be understood in terms of sequences similarities.
We compared the background intensities predicted by the functional presented in this paper with the experimental data. The latter are spike-in Affymetrix data lat in which few sequences are added in solution at known concentration. The spike-in data set is used to develop and test algorithms for Affymetrix microarrays data analysis. In particular we considered the data at zero spike-in concentration, which measure pure background. We used these data to compare the performance of our algorithm to the other algorithms MAS5.0, RMA and GCRMA. This comparison is summarized in Table 2, showing the average squared deviation from the logarithm of the intensities at zero spike-in concentration. The results show that our algorithm and GCRMA perform much better than both MAS5.0 and RMA. In the tests performed we noticed that GCRMA follows closely the experimental background, but it may “fail” substantially in few probes of a probe set. This can also be seen in the examples of Fig. 4. These failures lower the performance of GCRMA, compared to the physical-chemistry algorithm presented here.
In conclusion, the algorithm developed in this paper provides good quality results for background estimates compared to existing algorithms and provides an interesting alternative for background subtraction schemes in Affymetrix Genechips. Even though we have shown that the performance of our background functional is satisfying, hopefully there is still room for improvement.
Acknowledgment. We acknowledge financial support from the Van Gogh Programme d’Actions Intégrées 08505PB of the French Ministry of Foreign Affairs and Grant No. 62403735 and by the Netherlands Organization for Scientific Research (NWO). Support from Fonds voor Wetenschappelijk Onderzoek (FWO) Grant No. G.0297.06 is also gratefully acknowledged.
References
- Stoughton (2005) R. Stoughton, Annu. Rev. Biochem. 74, 53 (2005).
- Lipshutz et al. (1999) R. J. Lipshutz, S. P. A. Fodor, T. R. Gingeras, and D. J. Lockhart, Nat. Genet. 21, 20 (1999).
- Naef and Magnasco (2003) F. Naef and M. O. Magnasco, Phys. Rev. E 68, 011906 (2003).
- Binder and Preibisch (2005) H. Binder and S. Preibisch, Biophys. J. 89, 337 (2005).
- Gentleman et al. (2003) R. Gentleman, V. Carey, W. Huber, R. Irizarry, and S. Dudoit, Bioinformatics and Computational Biology Solutions Using R and Bioconductor, Statistics for Biology and Health (Springer, 2003).
- Carlon et al. (2006) E. Carlon, T. Heim, J. Klein Wolterink, and G. T. Barkema, Phys. Rev. E 73, 063901 (2006).
- Naef et al. (2006) F. Naef, H. Wijnen, and M. Magnasco, Phys. Rev. E 73, 063902 (2006).
- Ferrantini and Carlon (2007) A. Ferrantini and E. Carlon, On the relationship between perfect matches and mismatches in Affymetrix Genechips, submitted
- Irizarry et al. (2003a) R. A. Irizarry et al., Biostatistics 4, 249 (2003a).
- aff (a) Statistical algorithms reference guide. Technical report, Affymetrix, Santa Clara, CA (2001).
- aff (b) Affymetrix Microarray Suite Users Guide. Affymetrix, Santa Clara, CA, version 5.0 edition (2001b).
- Li and Wong (2001) C. Li and W. H. Wong, Proc. Natl. Acad. Sci. 98, 31 (2001).
- Zhang et al. (2003) L. Zhang, M. F. Miles, and K. D. Aldape, Nature Biotech. 21, 818 (2003).
- Held et al. (2003) G. A. Held, G. Grinstein, and Y. Tu, Proc. Natl. Acad. Sci. 100, 7575 (2003).
- Hekstra et al. (2003) D. Hekstra, A. R. Taussig, M. Magnasco, and F. Naef, Nucleic Acids Res. 100, 1962 (2003).
- Carlon and Heim (2006) E. Carlon and T. Heim, Physica A 362, 433 (2006).
- Irizarry et al. (2003b) R. A. Irizarry, B. Hobbs, F. Collin, Y. D. Beazer-Barclay, K. J. Antonellis, U. Scherf, and T. P. Speed, Biostatistics 4, 249 (2003b).
- Bloomfield et al. (2000) V. A. Bloomfield, D. M. Crothers, and I. Tinoco, Jr., Nucleic Acids Structures, Properties and Functions (University Science Books, Mill Valley, 2000).
- Sugimoto et al. (1995) N. Sugimoto et al., Biochemistry 34, 11211 (1995).
- (20) Data freely available from the site: http://www.affymetrix.com/ support /technical /sample_data/datasets.affx.
- (21) Data freely available from GEO (Gene Expression Omnibus): http://www.ncbi.nlm.nih.gov/geo/.
- SantaLucia Jr. (1998) J. SantaLucia Jr., Proc. Natl. Acad. Sci. 95, 1460 (1998).
- Weckx et al. (2007) S. Weckx, E. Carlon, L. De Vuyst, and P. Van Hummelen, J. Phys. Chem. B 111, 13583 (2007)
- Wu et al. (2004) Z. Wu, R. Irizarry, R. Gentleman, F. M. Murillo, and F. Spencer, J. Am. Stat. Assoc. 99, 909 (2004).