Quasi-Particle Dynamics in Superconducting Aluminum
Abstract
The response of superconducting aluminum to electromagnetic radiation is investigated in a broad frequency (45 MHz to 40 GHz) and temperature range (), by measuring the complex conductivity. While the imaginary part probes the superfluid density (Cooper-pairs), the real part monitors the opening of the superconducting energy gap and – most important here – the zero-frequency quasi-particle response. Here we observe the full temperature and frequency dependence of the coherence peak. Varying the mean free path gives insight into the dynamics, scattering and coherence effects of the quasi-particles in the superconducting state.
pacs:
74.25.Gz, 74.25.Nf, 74.70.Ad, 74.78.DbI Introduction
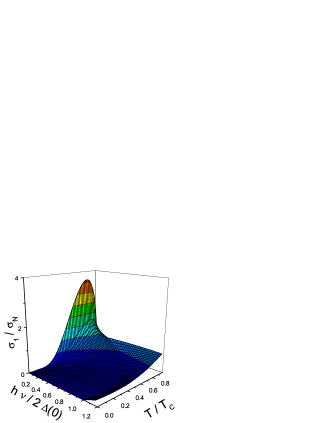
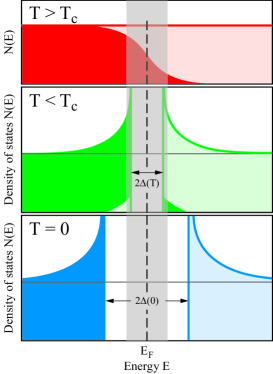
Microwave and optical experiments have played a prominent role in the elucidation of the superconducting state for more than fifty years, because they provide information on the single-particle excitations as well as on the response of the Cooper pairs.Tinkham96 ; DresselGruner02 The electrodynamic properties of superconductors can be calculated on the basis of the BCS theory,BCS as first worked out by Mattis and Bardeen;Mattis58 and there exist precise predictions on the temperature and frequency dependence of the complex conductivity. One of the hallmarks of the superconducting state is the opening of an energy gap in the density of states right below the critical temperature ; both are related by mean-field theory: . In the 50s and 60s of the last century, enormous efforts were undertaken to explore the microwave and THz absorption of superconductors, like Al, In, or Sn, in order to obtain the conductivity in the region of the superconducting gap.Richards60 Much less is known about the response of the quasi-particles in the superconducting state where, at energies below the energy gap, a maximum in the electromagnetic absorption – the so-called coherence peak – is expected for temperatures slightly below the superconducting transition (Fig. 1).
The analog feature in nuclear magnetic resonance, i.e. the presence of a maximum in the nuclear-spin relaxation-rate of aluminum below ,Hebel57 was one of the crucial experiments for the quick success of the BCS theory. By now, this Hebel-Slichter peak has been found in a large number of superconductors. In the case of the electrodynamic response, the experimental confirmation of the coherence peak turned out to be much more difficult Waldram64 and it was only in the 1990s, that a maximum in the temperature dependent conductivity was observed by studying Pb and Nb in a microwave cavity at 60 GHz.Holczer91 ; Klein94 The complete mapping of the conductivity coherence peak, in particular its frequency dependence, has not been performed experimentally, even fifty years after the BCS theory.
During recent years the issue of the quasi-particle dynamics has attracted considerable interest in the field of high-temperature superconductors.Basov05 While a general agreement exists that no well-defined superconducting gap opens, there remain questions of the residual absorption and the narrow quasi-particle mode which evolves with an extremely small scattering rate at low temperatures.Pimenov99 ; Turner03 It therefore seems worth to revisit the issue of quasi-particle response in a conventional superconductor. Here we give the first report on the temperature and frequency dependence of the complex conductivity of aluminum in a very wide energy range ( and ); we investigate the dynamics of the quasi-particles and the influence of the mean free path.
| (nm) | (Torr) | () | (cm) | (nm) | (m) | (K) | (nm) | (nm) | |
|---|---|---|---|---|---|---|---|---|---|
| A | 40 | 1.65 | 32 | 5.0 | 15 | 1.70 | 61 | 200 | |
| B | 30 | 1.25 | 43 | 3.7 | 17 | 1.75 | 53 | 228 | |
| C | 50 | 2.90 | 87 | 1.8 | 24 | 1.90 | 35 | 310 |
II Experiment
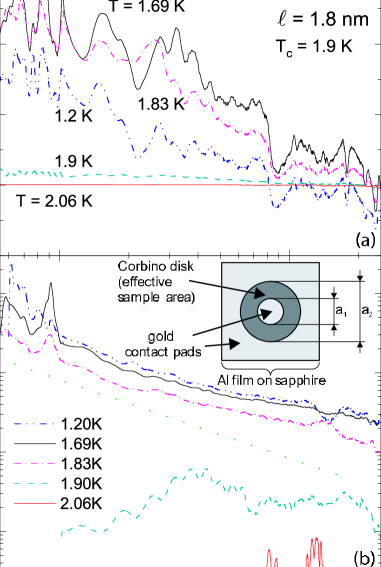
Aluminum films of different thickness (30 to 50 nm) were thermally evaporated (rate 1 nm/s) onto sapphire substrates. The film thickness was determined by a quartz microbalance, atomic force microscopy, and ellipsometry. In order to vary the mean free path, the films were prepared at different partial pressures of oxygen, as listed in Tab. 1. For technical reasons, the films were exposed to air, resulting in an Al2O3 layer of approximately 2 nm, before electrical contacts were made by evaporating 100 nm thick gold pads which adapt the geometry of the coaxial connector used for the high-frequency measurements (cf. inset of Fig. 2). The critical temperature was determined from the resistance between the contacts; the width of the superconducting transition is typically 10 mK.
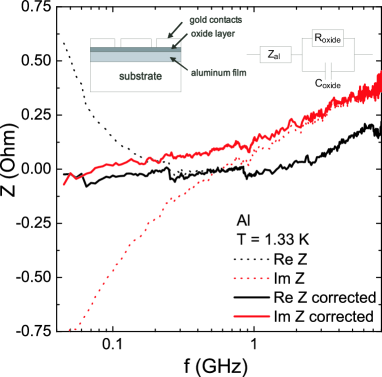
The microwave conductivity was measured with a Corbino spectrometer based on a HP8510C vector network analyzer in the range from 45 MHz to 40 GHz.Scheffler05 ) The data analysis – from complex reflection coefficient via sample impedance to complex conductivity – is done for each frequency separately and requires no additional assumptions except the sample being thin compared to the skin depth (which in the complete frequency and temperature range exceeds m). For cryogenic measurements ( K) a full three-standards calibration was performed. Bulk aluminum and a teflon disk were used as short and open end, respectively. NiCr films (25 nm thickness, 80% Ni and 20% Cr) serve as a frequency-independent load (). The calibration by the short is most crucial; checks in the normal state of aluminum (where the impedance is frequency independent) and data analysis with different calibrations rule out artifacts. The thin oxide layer between the Al film and the Au contacts acts as a capacitor with a noticeable but correctable effect below 5 GHz; its influence vanishes for higher frequencies. The influence of the oxide layer is temperature independent and the additional impedance can be subtracted from the sample impedance. Fig. 3 demonstrates the effect of the additional capacitor in the superconducting state. While at higher frequency the curves become identical, the corrections are appreciable at low frequencies.
The mean free path of our films is evaluated from the dc resistivity in the normal state: with the carrier concentration and mass ( is the free electron mass). Ashcroft76 The coherence length is related to the transition temperature: , where cm/s is the Fermi velocity. The values are listed in Tab. 1. Because the samples are in the so-called dirty local limit,Tinkham96 ; DresselGruner02 both the effective coherence length and penetration depth are larger than the London penetration depth of bulk aluminum nm. For all films the condition is easily fulfilled. Our results are in good agreement with previous investigations of granular Al films.Cohen68
III Results
III.1 Conductivity
The frequency-dependent real and imaginary parts of the normalized conductivity are plotted in Fig. 2 for the film C, as an example. For the metallic state conductivity, we have chosen independent of frequency. increases rapidly as the temperature is reduced below K, it goes through a maximum around 1.69 K and then drops again. Theory Tinkham96 ; DresselGruner02 predicts a frequency behavior of the maximum, and experimentally we observe this with the roughly linear curve for K in Fig. 2a. An even better description is obtained by a Drude response with a non-monotonous temperature dependence of the spectral weight as will be discussed below (inset of Fig. 9 and Fig. 7).
The imaginary part describes the response of the Cooper pairs to the electric field. For small frequencies
| (1) |
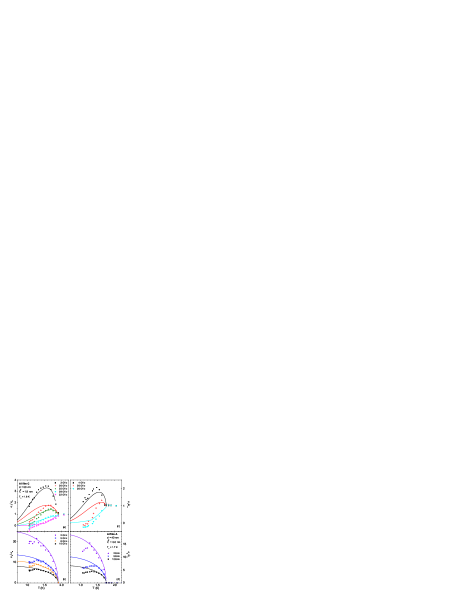
in good agreement with our findings plotted in Fig. 2b, in particular the linear contribution can be seen by comparing with the dotted line in that figure. In Fig. 4b and d, is plotted for various frequencies as a function of temperature. Not too close to , when , the temperature dependence of basically follows the opening of the superconducting gap , according to Eq. (1). For all frequencies, the behavior can be fitted by the BCS prediction, assuming for Film A and 0.03 for Film C, in fair agreement with the values calculated in Tab. 1.
Figs. 4a and c show data (taken on Sample C and A at different frequencies) of the temperature dependence of the real part of the conductivity. is governed by charge carriers thermally excited across the gap; their density of states diverges at the gap edge as depicted in Fig. 6. Right below , is small: the thermal energy but also the photon energy are sufficient to break up Cooper pairs.
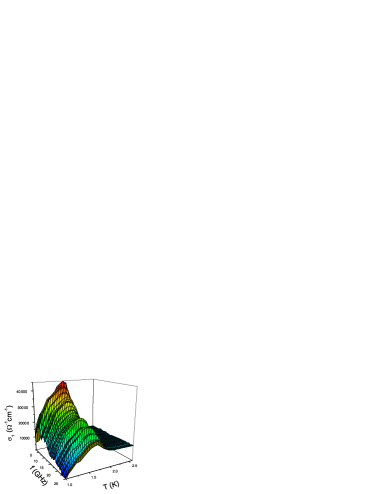
The coherence factor , which describes the quasi-particle scattering, depends on their energy and . If summed over all k values, it reads Tinkham96 ; only for energies close to the gap , this factor is appreciable: . Hence the coherence peak is seen as a maximum in at approximately in the low-frequency limit; it becomes smaller with increasing frequency and shifts to higher temperatures; this is clearly observed in Fig. 4. Above 28 GHz [corresponding to ] the peak is completely suppressed, and for higher frequencies monotonously drops below . Our findings of the frequency- and temperature-dependent conductivity of Al are summarized in the three-dimensional representation of Fig. 5; we can follow the evolution of the coherence peak over a substantial part of the temperature-frequency space.
III.2 Spectral Weight
Based on general electrodynamics,DresselGruner02 the spectral weight
| (2) |
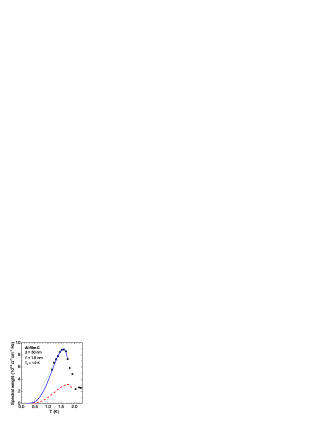
is a measure of the charge carrier density . In Fig. 7 we plot the spectral weight for the superconducting state by integrating the experimental data of between 1 and 40 GHz. remark1 We see that the effective carrier concentration increases below the transition temperature, passes through a maximum around 1.6 K and vanishes for in an exponential fashion. This behavior is perfectly explained by the BCS theory (dashed and full curve in Fig. 7). Here Fig. 6 may serve as an illustration: As the temperature drops below the superconducting gap opens gradually. Due to the finite temperature , there are still states occupied above the gap and empty states below. These are subject to single particle excitation at arbitrarily small energies, which leads to the quasi-particle contribution in the optical conductivity. The divergence in the density of states causes the increase of that part of spectral Of course, there is a second contribution to given by the electrons excited across the superconducting gap (but not accessed in our experiment).
The corresponding conductivity is plotted in Fig. 8. The calculations are done according to the BCS model,Zimmermann91 using the formulas of Mattis and Bardeen.Mattis58 To closely simulate the behavior of aluminum, we assume a transition temperature K; the superconducting energy gap is given by GHz. As the temperature drops slightly below , a narrow zero-frequency mode builds up which grows continuously until it reaches a maximum around K. As the temperature is reduced further, two effects cause the spectral weight (as summed over the experimentally accessible frequency range, the shaded region in Fig. 8) of the single-particles to decrease: the energy gap becomes larger and the Fermi distribution sharpens. Consequently, the number of quasi-particles available for transport, and accordingly , decreases and finally vanishes for . As demonstated in Fig. 7 the theoretical curve (solid line) nicely describes the experimental findings (squares).
We can describe the drop of spectral weight by the exponential freezing out of the normal carriers; as demonstrated by the dotted line in Fig. 7. Since the total spectral weight has to be conserved DresselGruner02 this drop has to be recovered. The Tinkham-Glover-Ferrell sum rule Glover56 ; Ferrell58 states that the spectral weight
| (3) |
missing in the superconducting state below the gap is transferred to the -peak at .
III.3 Scattering Rate
By now we have assumed that the real part of the conductivity is solely determined by the density of states and coherence factor; i.e. the quasi-particle concentration increases and eventually vanishes according to the temperature dependence of the spectral weight defined in Eq. (2): . Also the spectral behavior of the conductivity is given by the density of states . In the course of exploring the microwave properties of high-temperature superconductors, a debate arose whether information on the quasi-particle scattering can be obtained.Bonn92 ; Klein94c ; Bonn94 In fact, we can fit the real part of the optical conductivity by the Drude formula DresselGruner02
| (4) |
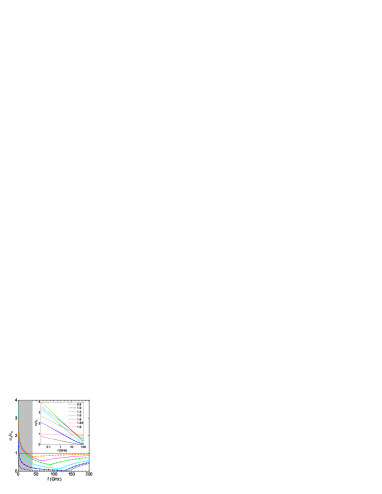
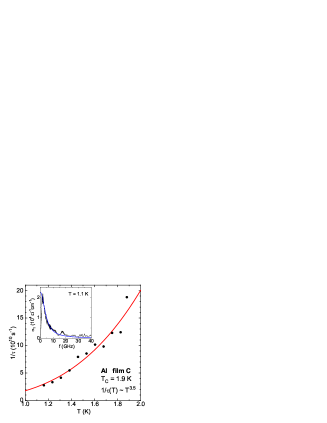
quite well at least for the lowest temperatures (inset of Fig. 9) and may extract a width which is related to the scattering rate within this model. The results for Film C are plotted in Fig. 9 for different temperatures. The temperature-dependent scattering rate can be fitted by a power-law with the power . Similar observations for the case of niobium have been reported previously.Klein94 ; Klein94c It should be pointed out, however, that this approach assumes a constant density of states, which might change with temperature according to the two-fluid model or similar models, but exhibits no energy dependence in the vicinity of the Fermi energy .
III.4 Influence of the Mean Free Path
In order to get more information on the scattering effects, we prepared films with different defect concentration. The mean free path of the normal state carriers strongly influences the superconducting behavior and the dynamics of the quasi-particles. Accordingly the complex conductivity appreciably varies for samples with different . Let be the maximum of the coherence peak and the width, defined as the temperature difference for which again. In Fig. 10a the peak width is plotted as a function of mean free path as obtained from Al films grown with different oxygen pressure. Since also the critical temperature and the energy gap depend on the thickness and quality of the films (Tab. 1), is normalized to the effective coherence length. The width of the coherence peak is a measure of how fast the energy gap opens. But it also tells how significant the coherence factor is in the scattering process: with increasing the finite-frequency conductivity decreases more rapidly.
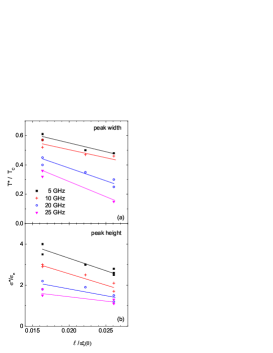
The height of the coherence peak is displayed in Fig. 10b, for the different films. When gets larger, decreases; or with other words, with increasing sample quality the coherence peak becomes smaller. The effect is more dramatic for lower frequencies. The ratio of mean free path and coherence length basically indicates whether the scattering takes place within the range in which the phase coherence of the superconducting wavefunction is observed; only then coherence effects matter. Eventually we approach the clean-limit superconductor, for which changes in the ac conductivity below become increasingly difficult to detect.Turner03 In a clean-limit superconductor, less spectral weight is transferred from the gap region to the -peak.Tinkham96 According to , the reduced spectral weight of the -peak is in agreement with an increase of the penetration depth, as listed in Tab. 1.
IV Conclusions and Outlook
In conclusion, by performing high-precision microwave experiments in a large spectral range down to low temperatures, we were able to map the frequency and temperature dependence of the conductivity coherence peak of aluminum with intentionally reduced mean free path. The influence of the quasi-particle scattering summarized in the coherence effects are elucidated by varying the mean free path of the carriers. For large , aluminum approaches a clean-limit superconductor and the coherence peak vanishes. The Tinkham-Glover-Ferrell sum rule is obeyed. Our experiments provide a unique possibility to investigate within one material system how scattering and the variation of the mean free path influences the superconducting properties.
Our experiments show that microwave spectroscopy allows for a detailed observation of coherence and scattering properties in superconductors. While our present work focussed on the well-known, conventional superconductor aluminum, future studies can be devoted to unconventional superconductors.
V Acknowledgments
We thank M. Dumm, J. Pflaum, and E. Ritz for help and discussions. The theoretical curves were created by the FORTRAN program of E.H. Brandt (Stuttgart). The work was supported by the DFG.
References
- (1) M. Tinkham, Introduction to Superconductivity, 2nd edition, (Mc Graw-Hill, New York, 1996).
- (2) M. Dressel and G. Grüner, Electrodynamics of Solids (Cambridge University Press, Cambridge, 2002).
- (3) J. Bardeen, L.N. Cooper, and J.R. Schrieffer, Phys. Rev. 108, 1175 (1957).
- (4) D. Mattis and J. Bardeen, Phys. Rev. 111, 412 (1958).
- (5) R.E. Glover and M. Tinkham, Phys. Rev. 108, 243 (1957); D.M. Ginsberg, P.L. Richards, and M. Tinkham, Phys. Rev. Lett. 3, 337 (1959); M.A. Biondi and M.P. Garfunkel, Phys. Rev. 116, 853 (1959); D.M. Ginsberg and M. Tinkham, Phys. Rev. 118, 990 (1960); P.L. Richards and M. Tinkham, Phys. Rev. 119, 575 (1960); L.H. Palmer and M. Tinkham, Phys. Rev. 165, 588 (1968).
- (6) W. Zimmermann, E.H. Brandt, M. Bauer, E. Seider, and L. Genzel, Physica C 183, 99 (1991).
- (7) L.C. Hebel and C.P. Slichter, Phys. Rev. 107, 901 (1957); Phys. Rev. 113, 1504 (1959).
- (8) J. R. Waldram, Adv. Phys. 13, 1 (1964).
- (9) K. Holczer, O. Klein and G. Grüner, Solid State Commun. 78, 875 (1991)
- (10) O. Klein, E.J. Nicol, K. Holczer, and G. Grüner, Phys. Rev. B 50 6307 (1994).
- (11) D.N. Basov and T. Timusk, Rev. Mod. Phys. 77, 721 (2005).
- (12) A. Pimenov, A. Loidl, G. Jakob, and H. Adrian, Phys. Rev. B 59, 4390 (1999).
- (13) P.J. Turner, R. Harris, S. Kamal, M.E. Hayden, D.M. Broun, D.C. Morgan, A. Hosseini, P. Dosanjh, G.K. Mullins, J.S. Preston, R. Liang, D.A. Bonn, and W. N. Hardy, Phys. Rev. Lett. 90, 237005 (2003).
- (14) M. Scheffler and M. Dressel, Rev. Sci. Instrum. 76, 074702 (2005); M. Scheffler, S. Kilic, and M. Dressel, Rev. Sci. Instrum. 78, 086106 (2007); E. Ritz and M. Dressel, J. Appl. Phys. 103, 084902 (2008).
- (15) N.W. Ashcroft and N.D. Mermin, Solid State Physics (Saunders College Publishing, Philadelphia, 1976)
- (16) R.W. Cohen and B. Abeles, Phys. Rev. 168, 444 (1968).
- (17) Extrapolating the data to zero-frequency and expanding the integration below 1 GHz does not change the findings qualitatively. The error in absolute value remains below 5%. As depicted in Fig. 1, the upper cutoff frequency falls right in the range where the quasi-particle contribution to the optical conductivity is already considerably reduced: .
- (18) R.E. Glover and M. Tinkham, Phys. Rev. 104, 844 (1956); Phys. Rev. 108, 243 (1957).
- (19) R.A. Ferrell and R.E. Glover, Phys. Rev. 109, 1398 (1958).
- (20) D.A. Bonn, P. Dosanjh, R. Liang, and W.N. Hardy, Phys. Rev. Lett. 68, 2390 (1992); A. Hosseini, R. Harris, S. Kamal, P. Dosanjh, J. Preston, R. Liang, W.N. Hardy, and D.A. Bonn, Phys. Rev. B 60, 1349 (1999).
- (21) O. Klein, Phys. Rev. Lett. 72, 1390 (1994).
- (22) D.A. Bonn, K. Zhang, S. Kamal, R. Liang, P. Dosanjh, W.N. Hardy, C. Kallin, and A.J. Berlinsky, Phys. Rev. Lett. 72, 1391 (1994).