Mechanical detection of carbon nanotube resonator vibrations
Abstract
Bending-mode vibrations of carbon nanotube resonator devices were mechanically detected in air at atmospheric pressure by means of a novel scanning force microscopy method. The fundamental and higher order bending eigenmodes were imaged at up to with sub-nanometer resolution in vibration amplitude. The resonance frequency and the eigenmode shape of multi-wall nanotubes are consistent with the elastic beam theory for a doubly clamped beam. For single-wall nanotubes, however, resonance frequencies are significantly shifted, which is attributed to fabrication generating, for example, slack. The effect of slack is studied by pulling down the tube with the tip, which drastically reduces the resonance frequency.
pacs:
85.85.+j, 73.63.Fg, 81.16.Rf, 85.35.KtCarbon nanotubes offer unique opportunities as high-frequency mechanical resonators for a number of applications. Nanotubes are ultra light, which is ideal for ultralow mass detection and ultrasensitive force detection APoncharalScience1999 ; AReuletPRL2000 . Nanotubes are also exceptionally stiff, making the resonance frequency very high. This is interesting for experiments that manipulate and entangle mechanical quantum states ABlencowePhysReports2004 ; AHayeScience2004 ; AKnobelNature2003 . However, mechanical vibrations of nanotubes remain very difficult to detect. Detection has been achieved with transmission or scanning electron microscopy APoncharalScience1999 ; ABabicNanoLett2003 ; Meyer ; AJensenPRL2006 , and field-emission APurcellPRL2004 . More recently, a capacitative technique has been reported ASazanovaNature2004 ; APengPRL2006 ; Witkamp that allows detection for nanotubes integrated in a device, and is particulary promising for sensing and quantum electromechanical experiments. A limitation of this capacitive technique is that the measured resonance peaks often cannot be assigned to their eigenmodes. In addition, it is often difficult to discern resonance peaks from artefacts of the electrical circuit. It is thus desirable to develop a method that allows the characterization of these resonances.
In this letter, we demonstrate a novel characterization method of nanotube resonator devices, based on mechanical detection by scanning force microscopy (SFM). This method enables the detection of the resonance frequency () in air at atmospheric pressure and the imaging of the mode-shape for the first bending eigenmodes. Measurements on single-wall nanotubes (SWNT) show that the resonance frequency is very device dependent, and that dramatically decreases as slack is introduced. We show that multi-wall nanotube (MWNT) resonators behave differently from SWNT resonators. The resonance properties of MWNTs are much more reproducible, and are consistent with the elastic beam theory for a doubly clamped beam without any internal tension.
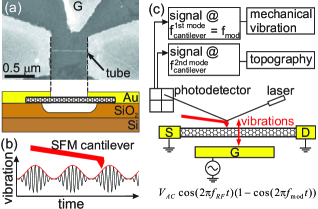
An image of one nanotube resonator used in these experiments is shown in Fig. 1(a). The resonator consists of a SWNT grown by chemical-vapour deposition AKongNature1998 or a MWNT synthesized by arc-discharge evaporation ABonardAdvMater1997 . The nanotube is connected to two Cr/Au electrodes patterned by electron-beam lithography on a high-resistivity Si substrate () with a thermal silicon dioxide layer. The nanotube is released from the substrate during a buffered HF etching step. The Si substrate is fixed for SFM measurements on a home-made chip carrier with transmission lines.
A schematic of the measurement method is presented in Fig. 1(b). The nanotube motion is electrostatically actuated with an oscillating voltage applied on a side gate electrode. As the driving frequency approaches the resonance frequency of the nanotube, the nanotube vibration becomes large. In addition, the amplitude of the resonator vibration is 100% modulated at , which can be seen as sequentially turning on and off the vibration. The resulting envelope of the vibration amplitude is sensed by the SFM cantilever. Note that the SFM cantilever has a limited bandwidth response so it cannot follow the rapid vibrations at NSFMMicro .
The SFM is operated in tapping mode to minimize the forces applied on the nanotube by the SFM cantilever. The detection of the vibrations is optimized by matching to the resonance frequency of the first eigenmode of the SFM cantilever. As a result, the first cantilever eigenmode is excited with an amplitude proportional to the nanotube amplitude, which is measured with a lock-in amplifier tuned at . The second eigenmode of the SFM cantilever is used for topography imaging in order to suppress coupling between topography and vibration detections (see Fig. 1(c)). Note that in-plane nanotube vibrations can be detected by means of the interaction between the nanotube and the tip side, or asperities at the tip apex.
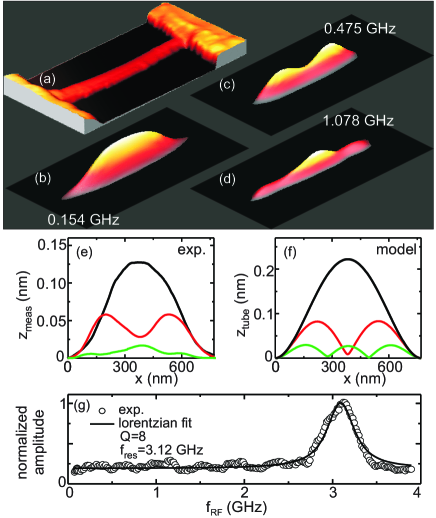
We start discussing measurements on MWNTs. Suspended MWNTs stay straighter than SWNTs and are thus more suitable to test the technique. Figures 2(a-e) show the topography and the nanotube vibration images obtained at different actuation frequencies. The different shapes of the vibrations are attributed to different bending eigenmodes. Zero, one, and two nodes correspond to the first, second and third order bending eigenmodes.
Figure 2(g) shows the resonance peak of the fundamental eigenmode for another MWNT device. The resonance frequency at is remarkably high. It is higher than the reported resonance frequency of doubly clamped resonators based on nanotube or other materials APengPRL2006 ; AHuangNature2003 . The quality factor is . The quality factor of the other tubes that we have studied is 3-20.
We now compare these results with the elastic beam theory for a doubly clamped beam. The displacement is given by BClelandFoundationsNanomechanics
| (1) |
with the density of graphite, the radius, the Young modulus, the momenta of inertia, and the tension in the tube. Assuming that , , and at and , the resonance frequencies are BClelandFoundationsNanomechanics
| (2) |
with , , , and the length.
Table 1 shows the resonance frequency for all the measured MWNTs remark . Measured span over two orders of magnitudes, between 51 MHz and 3.1 GHz. Eq. 2 describes rather accurately these measured when is set at . This value of is consistent with results on similarly prepared MWNT devices ALefevrePRL2005 .
![[Uncaptioned image]](/html/0712.3196/assets/x3.png)
Such a good agreement is remarkable, since rather large deviations from Eq. 2 have been reported for nanoscale resonators made of other materials BClelandFoundationsNanomechanics ; AHussainAPhysLett2003 . These deviations have been attributed to the tension or slack (also called buckling) that can result during fabrication. Our measurements suggest that tension and slack have little effect on the resonances of MWNTs. We attribute this to the high mechanical rigidity of MWNTs, which makes deformation difficult to occur AHertelPRB1998 . This result may be interesting for certain applications, such as radio-frequency signal processing AWangIEEE2004 , where the resonance frequency has to be predetermined.
We now look at the spatial shape of the vibrations. The maximum displacement is given by with solution of Eq.1 with , BClelandFoundationsNanomechanics
| (3) |
with -1.017, -0.9992, and -1.00003. When damping is described within the context of Zener’s model, we have BClelandFoundationsNanomechanics
| (4) |
with being the quality factor measured for each eigenmode, and the external force. and are the DC and the AC voltages applied on the gate, and the capacitance between the gate and the tube. The precise estimate of is very challenging due to the difficulty of determining . The most difficult task is to account for the asymmetric gate and for the screening of the clamping electrodes. As a simplification, we use along a certain portion of the tube, and otherwise. We use and as fitting parameters. A third fitting parameter is the linear conversion of the displacement of the tube into the one of the cantilever that is measured remark2 . Fig. 2(f) shows the results of the calculations. The model qualitatively reproduces the overall shape of the measured eigenmodes as well as the ratio between the amplitudes of the different eigenmodes. In addition, the model predicts that the displacement at the nodes is different from zero, as shown in the measurements. This is due to the low , so the first eigenmode contributes to the displacement even at of the second or the third eigenmode.
These calculations allow for an estimate of the tube displacement, which is 0.2 nm for the fundamental eigenmode (Fig. 2(f)). We emphasize that this estimate indicates only the order of the magnitude of the actual vibration amplitude, since crude simplifications have been used for . The vibration amplitude for the other devices is estimated to be low as well, between 0.1 pm and 0.5 nm. Notice that we find that is quite comparable to (Fig. 2(g,f)). We are pursuing numerical simulations taking into account the microscopic tube-tip interaction that support this.
We turn our attention to the quality factor. The low may be attributed to the disturbance of the SFM tip. Note, however, that the topography feedback is set at the limit of cantilever retraction, for which the tube-tip interaction is minimum. Moreover, we have noticed no change in the quality factor as the amplitude setpoint of the SFM cantilever is reduced by 3-5% from the limit of cantilever retraction, which corresponds to the enhancement of the tube-tip interaction. This suggests that the tip is not the principal source of dissipation.
The low may be attributed to collision with air molecules. Indeed, previous measurements in vacuum on similarly prepared resonators show a between 10 and 200 ASazanovaNature2004 ; Witkamp , which is larger than 3-20, the we have obtained. In addition, we can estimate in the molecular regime using with the effective mass of the beam, ms-1 the velocity of air molecules, and the pressure erkinci . We get for the tube in Fig. 2(a), which is not too far from , the value we have measured. Note that the molecular regime holds for a mean free path of air molecules that is larger than the resonator dimensions. 65 nm at 1 atm, so we are at the limit of the applicability of this regime. Overall, a more systematic study should be carried out to clearly identify the origin of the low .
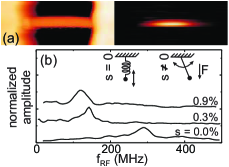
Having shown that SFM successfully detects mechanical vibrations of MWNTs, we now look at SWNTs (Fig. 3(a)). Table 1 shows poor agreement between the measured resonance frequencies and the values expected from a doubly clamped beam. We attribute this to tension or slack. When the tube is elongated by due to tension, the resonance frequency increases and becomes when ASapmazPRB2003 . The measured frequency of the long SWNT in Tab. 1 is 128% larger than what is expected for a beam without tension. This deviation can be accounted by elongation ( is 0.2 pm). This suggests that even a weak elongation can dramatically shift the resonance frequency. Such an elongation can result, for example, from the bending of the partially suspended Cr/Au electrodes.
Table 1 shows that the resonance frequencies of other SWNTs can be below the one expected from a doubly clamped beam. This may result from the additional mass of contamination adsorbed on the tube APoncharalScience1999 ; AReuletPRL2000 . This may also be the consequence of slack, which occurs when the tube is longer than the distance between the electrodes AUstunel2005 .
To further investigate the effect of slack, we have introduced slack in a non-reversible way by pulling down the tube with the SFM cantilever. Figure 3(b) shows that can be divided by two for a slack below 1%. The slack is defined as with being the tube length and the separation between the clamping points.
Taking into account slack, Eq. 1 has been solved analytically only for in-plane vibrations (plane of the buckled beam) Nayfeh . Recent numerical calculations have extended this treatment to out-of-plane vibrations AUstunel2005 . It has been shown that of the fundamental eigenmode can even be zero when no force is applied on the beam. The schematic in Fig. 3(b) shows the physics of this effect. For zero slack, the beam motion can be described by a spring with the spring force that results from the tube bending. When slack is introduced, the fundamental eigenmode is called ”jump rope” AUstunel2005 . It is similar to a mass attached to a point through a massless rod of length . does not depend on bending anymore but is with being an external force, which can be the electrostatic force between the tube and the side gate. We get for .
We estimate the reduction of when the slack passes from 0.3 to 0.9% in Fig. 3(b). Assuming that stays constant, and using AUstunel2005 , we expect a reduction by a factor of about 1.3, which is consistent with the experiment, since passes from 142 to . More studies should be done, in particular to relate to , but also to understand the effect of the boundary conditions at the clamping points. The section of the nanotube in contact with the electrodes may be bended, especially after SFM manipulation, so that at and .
Overall, these results show that SFM, as a tool to visualize the spatial distribution of the vibrations, is very useful to characterize eigenmodes of SWNT resonator devices. In addition, SFM detection provides unique information about the physics of nanotube resonators such as the effect of slack. Further studies will be carried out on slack for which interesting predictions have been reported AUstunel2005 . For example, the number of nodes of higher eigenmodes is expected to change as slack is increased. We anticipate that the reported SFM detection will be very useful to study NEMS devices made of other materials, such as graphene Bunch or microfabricated semiconducting Illic resonators.
We thank J. Bokor, A.M. van der Zande, J. Llanos, and S. Purcell for discussions. The research has been supported by an EURYI grant and FP6-IST-021285-2.
∗ corresponding author: adrian.bachtold@cnm.es
References
- (1) P. Poncharal, et al., Science 283, 1513 (1999)
- (2) B. Reulet, et al., Phys. Rev. Lett. 85, 2829 (2000)
- (3) M. Blencowe, Physics Reports 395, 159 (2004)
- (4) R.G. Knobel, A.N. Cleland, Nature 424, 291 (2003)
- (5) M.D. LaHaye, et al., Science 304, 74 (2004)
- (6) B. Babic, et al., Nano Lett. 3, 1577 (2003)
- (7) J.C. Meyer, M. Paillet, S. Roth, Science 309, 1539 (2005)
- (8) K. Jensen, et al., Phys. Rev. Lett. 96, 215503 (2006)
- (9) S.T. Purcell, et al., Phys. Rev. Lett. 89, 276103 (2002)
- (10) V. Sazonova, et al., Nature 431, 284 (2004)
- (11) H.B. Peng, et al., Phys. Rev. Lett. 97, 087203 (2006)
- (12) B. Witkamp, M. Poot, and H.S.J. van der Zant, Nano Lett. 6, 2904 (2006).
- (13) J. Kong, et al., Nature 395, 878 (1998)
- (14) J.M. Bonard, et al., Adv. Mater. 9, 827 (1997)
- (15) The SFM microscope is a Dimension 3100 from Veeco. The SFM tips from Olympus have a spring constant and a resonance frequency for the first mode. The amplitude setpoint of the topography feedback is set lower than the free amplitude ( nm). The time constant of the lock-in is about 10 ms.
- (16) X.M.H. Huang, et al., Nature 421, 496 (2003)
- (17) A.N. Cleland, Foundations of Nanomechanics (Springer, Berlin 2003)
- (18) We did not observe a change of as is varied. This is attributed to the low and the short . For instance, to see a change for the device in Fig. 2(a), we estimate that should be larger than 13 V ASapmazPRB2003 .
- (19) S. Sapmaz, et al., Phys. Rev. B 67, 235414 (2003).
- (20) R. Lefevre, et al., Phys. Rev. Lett. 95, 185504 (2005)
- (21) A. Husain, et al., Appl. Phys. Lett. 83, 1240 (2003).
- (22) T. Hertel, R.E. Walkup, and P. Avouris, Phys. Rev. B 58, 13870 (1998)
- (23) W. Jing, Z. Ren, and C.T.C. Nguyen, IEEE Trans. Ferro. Freq. Control 51, 1607 (2004)
- (24) We observed that depends linearly on . In addition, is expected to be linear with in the linear regime. This suggests that is linearly proportional to .
- (25) K.L. Ekinci, M.L. Roukes, Rev. Sci. Instrum. 76, 061101 (2005)
- (26) H. Ustunel, D. Roundy, and T.A. Arias, Nano Lett. 5, 523 (2005)
- (27) A.H. Nayfeh, W. Kreider, T.J. Anderson, AIAA J. 33, 1121 (1995).
- (28) J. Scott Bunch, et al., Science 315, 490 (2007)
- (29) B. Ilic, S. Krylov, L.M. Bellan, H.G. Craighead, J. Appl. Phys. 101, 044308 (2007).