CANGAROO-III Observations of the 2006 Outburst of PKS 2155304
Abstract
We have used the CANGAROO-III imaging atmospheric Cherenkov telescopes to observe the high-frequency-peaked BL Lacertae (HBL) object PKS 2155304 between 2006 July 28 (MJD 53944) and August 2, triggered by the H.E.S.S. report that the source was in a high state of TeV gamma-ray emission. A signal was detected at the level in an effective live time of 25.1 hours during the outburst period. The flux of Very High Energy gamma-rays from the CANGAROO-III observations shows the variability on the time scale of less than a few hours. The averaged integral flux above 660 GeV is which corresponds to of the flux observed from the Crab nebula. Follow-up observations between August 17 (MJD 53964) and 25 indicate the source activity had decreased.
1 Introduction
The most astonishing contribution from the ground-based IACTs has been the detection of AGNs at energies above several hundred GeV. To date, 19 active galactic nuclei have been reported to emit Very High Energy (VHE) gamma-rays (Hinton, 2007), most of them classified as high-frequency-peaked BL Lacs (HBLs) (Padovani & Giommi, 1995). Some, such as Mrk 421 and Mrk 501, have been targets of simultaneous multi-wavelength campaigns since their first TeV detection (Punch et al., 1992; Quinn et al., 1996), and are well studied. The derived broadband spectral energy distributions (SEDs) show that they have two components. The lower energy component is believed to be synchrotron emission produced by relativistic electrons in the jet, and the higher energy component, although relatively poorly understood, is probably explained by the inverse-Compton scattering of seed photons (either synchrotron or ambient photons) by the same population of electrons (see e.g., Jones, O’dell & Stein, 1974; Ulrich, Maraschi, & Urry, 1997; Dermer & Schlickheiser, 1993; Sikora, Begelman & Rees, 1994).
Multi-wavelength observations of HBLs have also shown that the fluxes are extremely variable, particularly in the higher energy bands. Flux variations on a wide range of time scales from months to two minutes are reported at TeV energies (e.g., Gaidos et al., 1996; Krawczynski et al., 2001; Aharonian et al., 2002, 2005c; Blazejowski et al., 2005; Aharonian et al., 1999; Gliozzi et al., 2006; Albert et al., 2007a). Time variability is a very useful way to probe the emission mechanism in the jet. Characteristic time scales, which can be employed as a measure of super-massive black hole mass at the center of HBL, have been studied with X-ray data using statistical techniques such as power spectra, structure functions, etc (e.g., Hayashida et al., 1998; Zhang et al., 1999; Kataoka et al., 2001; Cui, 2004). A good correlation of the X-ray and the TeV fluxes has also been reported (e.g., Buckley et al., 1996; Takahashi et al., 1996; Djannati-Atai et al., 1999; Takahashi et al., 2000; Sambruna et al., 2000; Krawczynski et al., 2002; Albert et al., 2007a). Recently, however, poor correlations or a total lack of correlation between the X-ray and TeV fluxes of individual flares have been observed (e.g., Blazejowski et al., 2005; Aharonian et al., 2005c), and even TeV flares with no X-ray counterpart have been found (Blazejowski et al., 2005; Krawczynski et al., 2004). Spectral hardening with flux in the TeV energy range has been reported for Mrk 421 (Aharonian et al., 2002; Krennrich et al., 2002; Albert et al., 2007a) and Mrk 501 (Albert et al., 2007b).
PKS 2155304 ( (Falomo et al., 1993)) is one of the brightest BL Lacs in the X-ray (Brinkmann et al., 1994; Kubo et al., 1998; Giommi et al., 1998; Vestrand & Sreekumar, 1999; Nicastro, 2002; Zhang et al., 2005) and EUV (Marshall, Carone, & Fruscione, 1993) bands. Since the discovery of X-ray emission from this object (Griffiths et al., 1979; Schwartz et al., 1979), it has been repeatedly observed over a wide range of frequencies from radio to Very High Energy (VHE) gamma-rays (e.g., Treves et al., 1989; Vestrand, Stacy, & Sreekumar, 1995; Zhang & Xie, 1996; Pian et al., 1997; Piner & Edwards, 2004; Dominici et al., 2004; Aharonian et al., 2005a).
In 1997 November, a gamma-ray and X-ray outburst from PKS 2155304 was detected by EGRET (Sreekumar & Vestrand, 1997), BeppoSAX (Chiappetti et al., 1999) and RXTE (Vestrand & Sreekumar, 1999). During this active phase, the Durham group observed PKS 2155304 using their Mark 6 telescope, and reported the first detection of VHE gamma-rays at the 6.8 level above 300 GeV (Chadwick et al., 1999a) at the time of BeppoSAX observation. However they found no evidence for TeV gamma-ray emission during observations in 1998 (Chadwick et al., 1999b) when the X-ray flux level was low. PKS 2155304 was observed with the CANGAROO-I 3.8 m telescope in 1997, though poor weather resulted in minimal overlap with the Durham observations. No gamma-ray signal above 1.5 TeV was detected (Roberts et al., 1999). PKS 2155304 was further observed in 1999, 2000 and 2001 with the CANGAROO-II telescope. It remained in a low state of X-ray activity in those periods, and was not detected above the energy threshold of 420 GeV (Nishijima et al., 2001; Nishijima, 2002; Nakase et al., 2003). PKS 2155304 was confirmed as a TeV gamma-ray source by the H.E.S.S. group in 2004. They reported a 45 detection at energies greater than 160 GeV in July and October, 2002, and June–September, 2003 (Aharonian et al., 2005a). The flux variability on time scales of months, days, and hours were also reported, and the monthly-averaged flux above 300 GeV was between 10% and 60% of Crab flux. The energy spectrum was characterized by a steep power law with a time-averaged photon index of . Multi-wavelength observations in 2003 in a low state showed no correlation between the X-ray and the gamma-ray fluxes, or between any other wavebands, even though the fastest ever X-ray flare in this object, with a sec timescale, was detected (Aharonian et al., 2005b).
In July 2006, the H.E.S.S. group reported that PKS 2155304 had been detected at historically high TeV flux levels of up to several crab (Benbow et al., 2006; Raue et al., 2006). They also presented very rapid flux variability with one-minute time scale resolution and found well-resolved bursts varying on timescales of seconds (Aharonian et al., 2007). The H.E.S.S. report triggered multi-wavelength Target of Opportunity (ToO) observations, including the observations with the CANGAROO-III telescopes from 2006 July 28 (MJD 53944) described in this paper.
Numerous multi-wavelength campaigns of PKS 2155304 have been carried out (e.g., Edelson et al., 1995; Urry et al., 1997; Aharonian et al., 2005b), and many physical implications for the emission mechanisms have been reported (e.g., Chiappetti et al., 1999; Kataoka et al., 2000; Edelson et al., 2001; Tanihata et al., 2001; Zhang et al., 2002, 2006). However, these models are still face challenges in explaining the complex and different patterns of multi-wavelength variations for each epoch.
For objects like PKS 2155304 which show rapid and complex time variability, continuous monitoring is very important for modeling the emission mechanisms. The difference in longitude between the H.E.S.S. and CANGAROO-III sites is , corresponding to an 8 hour time difference. Thus the H.E.S.S. and the CANGAROO-III data complement one another. Northern hemisphere blazars, such as Mrk 421, Mrk 501 and 1ES 1959650, have been observed at TeV energies continuously with more than two geographically distant telescope systems (e.g., Rebillot et al., 2006; Gliozzi et al., 2006; Krawczynski et al., 2004), providing greatly improved time coverage, but PKS 2155304 is the first object in the southern sky for which such studies have been made.
2 Detector and Observations
The CANGAROO-III imaging atmospheric Cherenkov telescope system which consists of four telescopes are operated in Woomera, South Australia (longitude E, latitude S, 160 m a.s.l.). They have parabolic reflectors of 10 m diameter with an 8 m focal length. Each reflector consists of 114 small spherical mirrors of 80 cm diameter, which are made of Fiber Reinforced Plastic. The imaging cameras have 427 pixels of size and a total field of view of . These telescopes use altitude-azimuth mounts and are placed at the corners of a diamond with 100 m sides. The details of the mirror, the camera, and the total performance of the light collecting system are described in Kawachi et al. (2001), Kabuki et al. (2003), and Enomoto et al. (2006a).
The CANGAROO-III observations of PKS 2155304 during this outburst period were made on five moonless nights between July 28 (MJD 53944) to August 2 in 2006. There were no observations on August 1, and the July 29 observations were affected by cloud. Three (T2, T3, T4) of the four telescopes were used in these observations. For each telescope, when the number of hit pixels exceeds four within a 20 nsec coincidence window, a local trigger is sent to the stereo trigger system through an optical link. In the stereo trigger system, determination of stereo events is done by requiring that at least two local trigger signals coinciding for at least 10 nsec within a 650 nsec time window, taking the geometrical time delay, which depends on the telescope pointing direction, into consideration(Kubo et al., 2001; Nishijima et al., 2005).
These observations were made using wobble mode in which pointing position of each telescope was shifted in declination between from the center of PKS 2155304 alternatively every twenty minutes. Due to a mechanical tracking problem with the T3 telescope during this period, stereo observations with three telescopes were done only after culmination. Stereoscopic observations using T2 and T4, which are located on the long diagonal of the diamond, were performed before culmination from July 28 to July 31.
The details of the CANGAROO-III observations of PKS 2155-304 are summarized in Table 1. The typical trigger rates, the mean zenith angle, and the total observation time of two-fold coincidences of T2–T4 were 20 Hz, , and 11.4 hours, respectively. The typical trigger rate of three-fold coincidences was 12 Hz, with a mean zenith angle for these observations of and a total observation time of 17.6 hours. The daily observation time , average zenith angle , and trigger rate are shown in Table 1 for both T2–T4 and three-fold data. The zenith angles of observations ranged from to for T2–T4 data, and from to for three-fold data.
Follow-up observations were made with the same system on six moonless nights between August 17 (MJD 53964) and 25. These data were taken only after culmination using three-fold coincidences. The zenith angle during these observations ranged from to with a mean of , and a total observation time of 19.1 hours. These observations are also summarized in Table 1.
3 Analysis
In order to calibrate the relative gain and the timing for each pixel, the data taken by illuminating the focal plane uniformly with LED photons were used. Conversion factors from ADC value to photoelectrons for each pixel are determined using the LED system in the camera vessel, and the timing jitter of the pulse signals are calibrated using light from a LED mounted at the center of the telescope dish. Details of the standard CANGAROO-III calibration methods are given in Kabuki et al. (2003). These LED runs were performed at least once per night. Five out of 427 pixels for T2 and two for T3 were identified as bad pixels which gave no signal or false signals, and these were removed from the analysis. There were no bad pixels in the T4 camera.
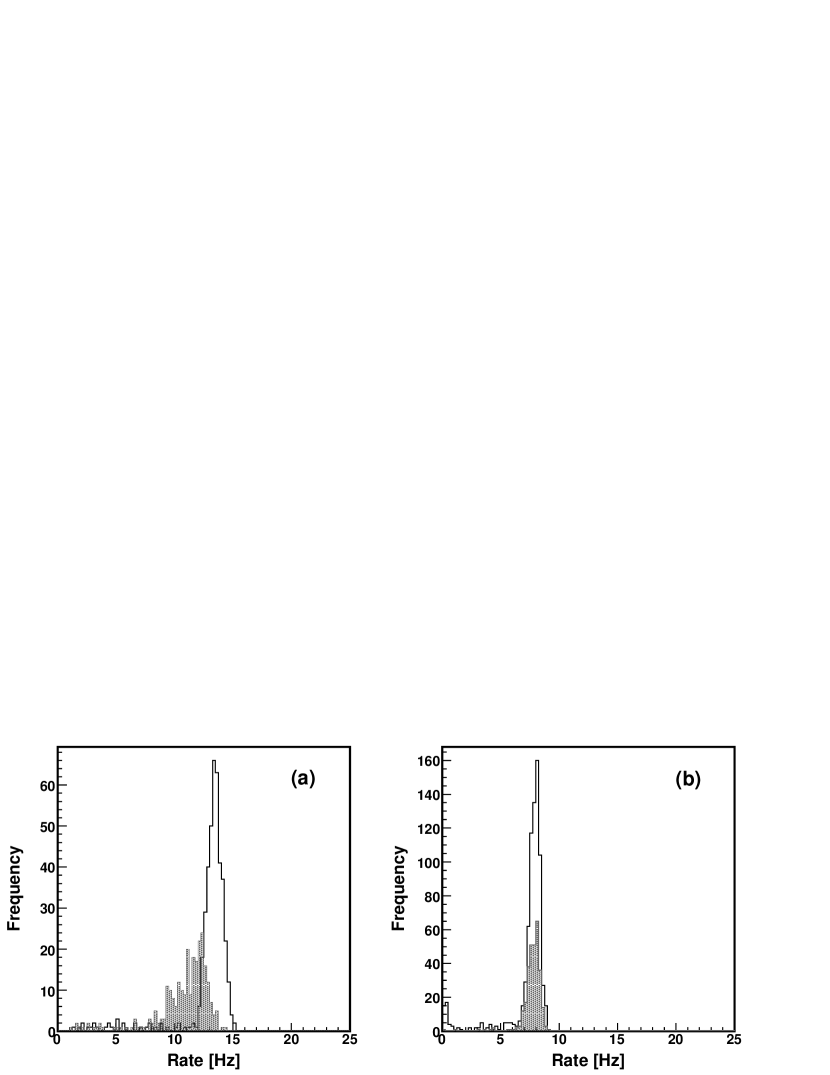
We have cleaned the images to eliminate night sky background photons and select shower images. Each pixel is required to have a signal larger than 5.0 p.e. with an arrival time within 30 nsec of the average shower arrival time. Images containing at least five adjacent pixels which pass the above requirements are selected. The distributions of shower rate each minute are shown in Fig. 1 for T2–T4 coincidence (left panel) and three-fold coincidence(right panel), respectively, and the average shower rate for each night is listed in Table 2. In order to ensure reliable arrival direction and energy estimations, the data taken during periods when shower rate was lower than 5 Hz for three-fold coincidences and 10 Hz for T2–T4 coincidences are not used, as they are probably affected by clouds. In the following analysis, we further require that none of the brightest 15 pixels of each image should be in the outermost layer of the camera in order to avoid deformation of the image. This method improves the effective area by more than 20% compared to the previous simple edge cut (Enomoto et al., 2006a), particularly above 2 TeV. After taking into account the DAQ dead-time, the effective total live time is also summarized in the same table.
The moments of the shower image are then parameterized using the Hillas parameters (Hillas et al., 1985), and the arrival directions are reconstructed using the intersection of image axes. The intersection point is obtained by minimizing the sum of squared widths of the images seen from the assumed point with a constraint on the distances between images’ center of gravity and assumed intersection point (IP-fit) considering the / ratio (see Kabuki et al. (2007) for details), which is similar to Algorithm 5 in Hofmann et al. (1999). This method improves the signal to noise ratio by more than 10% compared to the procedure described in Enomoto et al. (2006a) and is confirmed by Monte Carlo simulations and observations of the Crab nebula.
After event reconstruction, numerous cosmic ray background events are rejected using the Fisher Discriminant (FD) method (Fisher, 1936). The FD value for each event is calculated as explained in Enomoto et al. (2006b) using the size-corrected and for each telescope, where the energy dependence of the and are corrected to keep each parameter at the same values in various energies. In order to determine the optimum FD cut values, a Monte Carlo simulation was carried out assuming a single power-law spectrum, , with an index of , as determined for PKS 2155304 by the H.E.S.S. group (Aharonian et al., 2005a). Before applying the FD cuts, the data are divided into two data sets, ”” which include the data taken by only T2–T4 coincidence and ”” which required a three-fold coincidence between the three telescopes. Each dataset is further divided by zenith angle into two datasets, ”–” and ”–” for , and ”–” and ”–” for , respectively. Considering the Point Spread Function (PSF) of (FWHM), the (where is the angular difference between the reconstructed arrival direction and the source position) cuts were applied at for the data, and to keep the same efficiency for gamma rays as for the three-fold analysis, was applied to the data. Based on the Monte Carlo simulation assuming 100 % Crab flux of gamma rays above 600 GeV, we could determine the best FD cut criteria which yielded the highest significance for each dataset. Following the results from the Monte Carlo study, we select the events with for –, for –, for – and for – datasets, as candidate gamma-ray events.
The primary gamma-ray energy is estimated from the number of detected photo-electrons, based on the Monte Carlo simulations assuming a single power-law spectrum as mentioned above. This relation depends on the zenith angle of observations, so the simulations were done using the same variation of elevation as the actual observations. Although there is also some dependence on the impact parameter in the energy determination, we do not incorporate that here, with the resulting energy resolution estimated to be 30 % around 1 TeV. The effective detection area has been estimated from the Monte Carlo simulation as a function of energy. The detection energy threshold is taken to be the energy of the peak of the distribution of triggered shower energies.
4 Results
In this section, we show the results of CANGAROO-III observations of PKS 2155304 in 2006. A summary of the results are shown in Table 2. Using these results, we present the average integral flux, the average differential energy spectrum, and the time variation.
4.1 Average flux
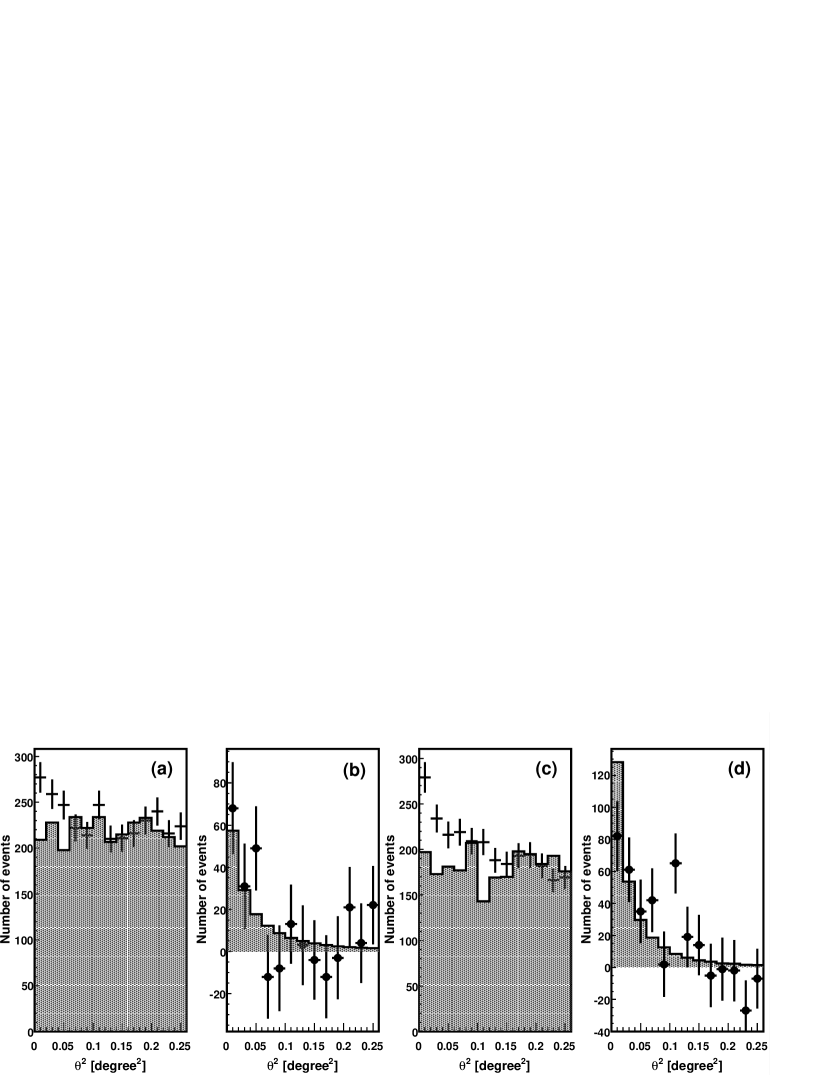
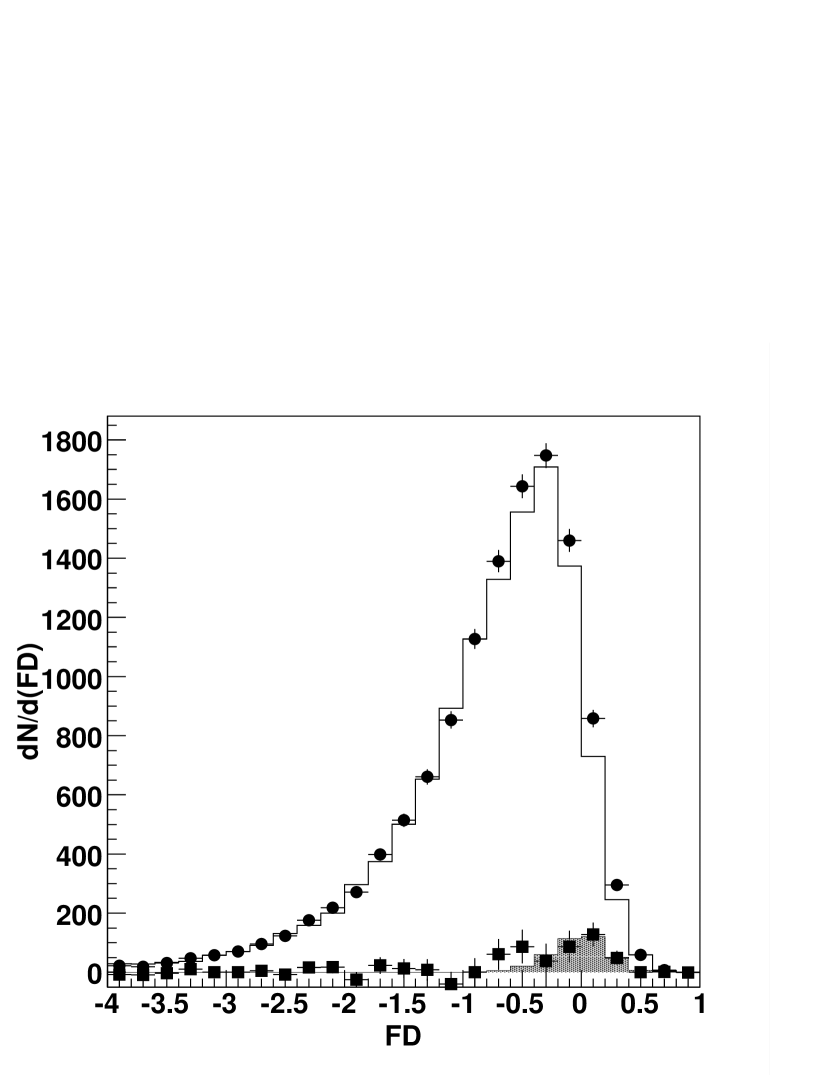
After the data reduction described in previous section, the final distribution is obtained. Fig. 2 (a) and (c) show the results in the outburst period for and datasets, respectively. The background level was estimated using off-source data in the corresponding region in the other side of the field of view. The distributions of the excess events against , i.e., with the off-source events subtracted from the on-source events, are shown in Fig. 2(b) and (d) for and , respectively. There are clear excesses at small values of in both figures corresponding to the observed signal from PKS 2155304. The number of excess events are calculated using a circular region of for and for centered on the source position, respectively, considering the PSF as mentioned in the previous section. The hatched histograms in figure 2 (b) and (d) indicate the expected PSF normalized to the number of excess events in . The combined excess of all the data is 32267 events (), where only the propagation of statistical errors is considered. Fig. 3 shows the FD distributions after the cut for on-source events, off-source events and the gamma-ray candidate events (on-sourceoff-source) together with the Monte-Carlo gamma-rays normalized to the number of excess events. The FD distributions are quite consistent for the observed gamma-ray events and the Monte Carlo gamma rays. The FD cut is not applied for this plot. The time-averaged integral flux above 660 GeV is calculated to be . This corresponds to of the flux observed from the Crab nebula (Aharonian et al., 2004), and is a factor of five more intense than the flux in the low state reported in (Aharonian et al., 2005a). The systematic error in the flux arises mainly from energy scale uncertainties due to the absolute light collection efficiency (20%), FD cut criteria (22%), uncertainties in the probability density function of images generated by Monte Carlo simulation (10%), and the uncertainty of a power law index (8%). At a higher energy threshold above 1.0 TeV, which corresponds to the energy threshold for – and – data, no significant excess above our sensitivity from PKS 2155304 is found in this period, and the resulting flux upper limit is .
For a cross-check, an alternative analysis using the Fisher Discriminant with a fit (Enomoto et al., 2006b) was performed on the same data. Although this is our standard method of analysis, the fine time binning and consequent small count statistics make it difficult to estimate the systematic errors correctly. The main source of error is the non-uniformity of the Fisher Discriminant in the ring-shaped background region. So we primarily took a conservative FD cuts method using a single reflected background at the expense of the statistics, and used FD fits as a cross-check. The difference of the integral flux between them was less than comparing at the same threshold energy.
4.2 Average differential energy spectrum
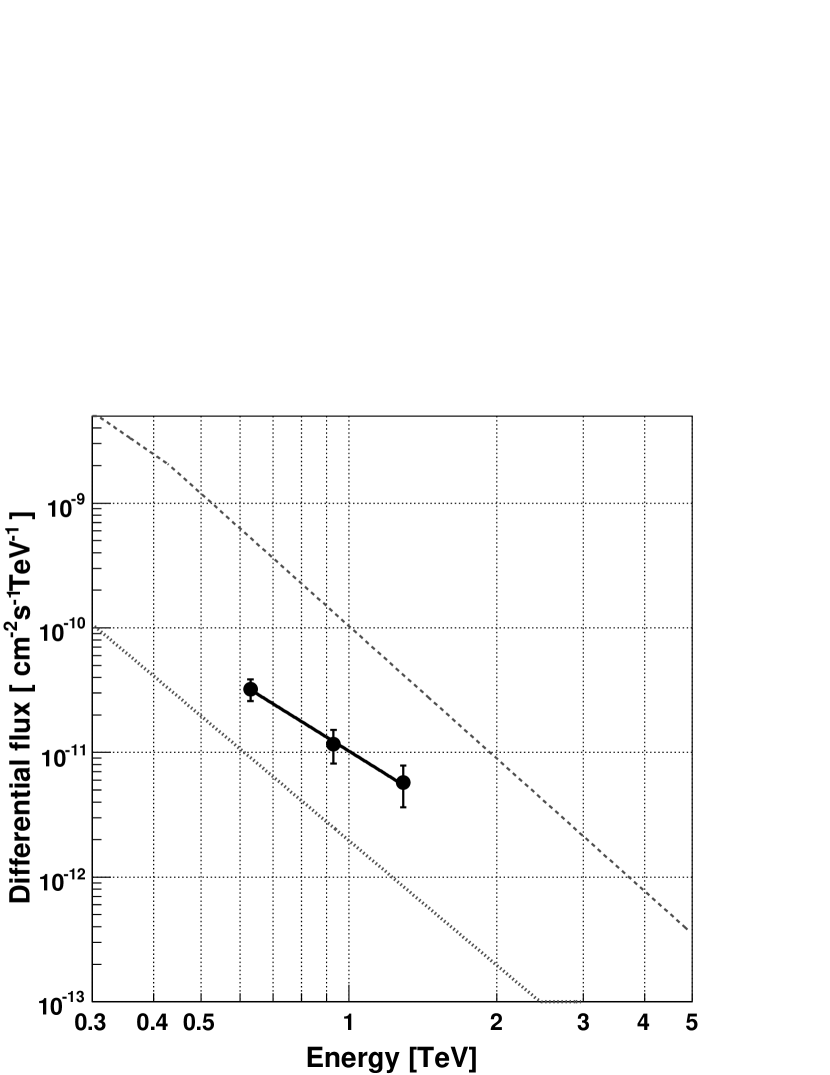
We obtained the time-averaged differential energy spectrum from all the data except for large zenith angle dataset, i.e. from – and –, since the large zenith angle data have a higher energy threshold and therefore lower energy bins have a different exposure than higher energy one. The differential flux is shown in Fig. 4 as closed circles with 1 statistical error bars. The best fit of a power law to the small zenith angle data yields a photon index and a flux normalization . We estimate the systematic error considering the same factors as mentioned in the previous section.
4.3 Time variations
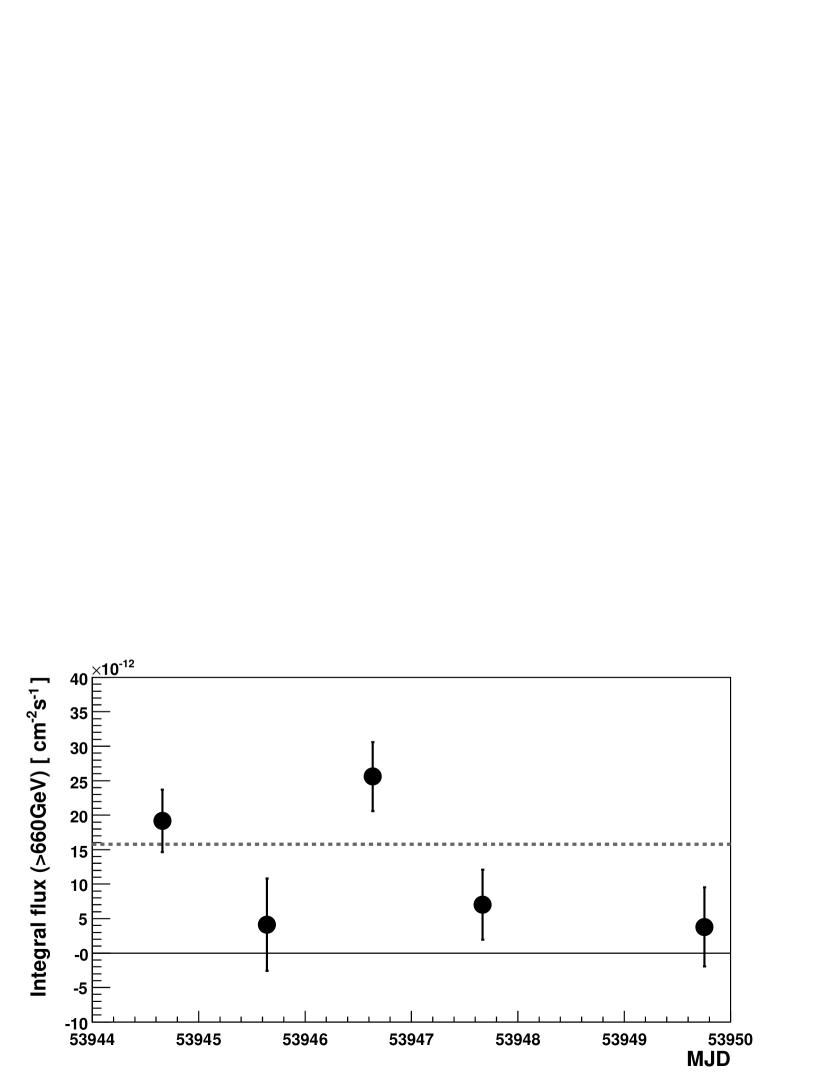
We have searched for gamma-ray emission from PKS 2155304 on a night-by-night basis. The live time, , the number of on-source and off-source events, and , the number of excess events, , and significance, , corresponding to each night are summarized in Table 2. Here the off-source data are summed up over the five nights to reduce the statistical fluctuation, and normalized to the live time of each night. The nightly average integral fluxes above 660 GeV, using all the data are also shown in the same table, and are plotted in Fig. 5, where the flux from and datasets are combined. The light curve shows that the average flux reached Crab in the night of July 30. Assuming a constant average flux, a fit yields a value of 13.9 for 4 degrees of freedom, which corresponds to a probability of . This means that there is a marginal time variations of the average flux on a nightly basis between July 28 and August 2.
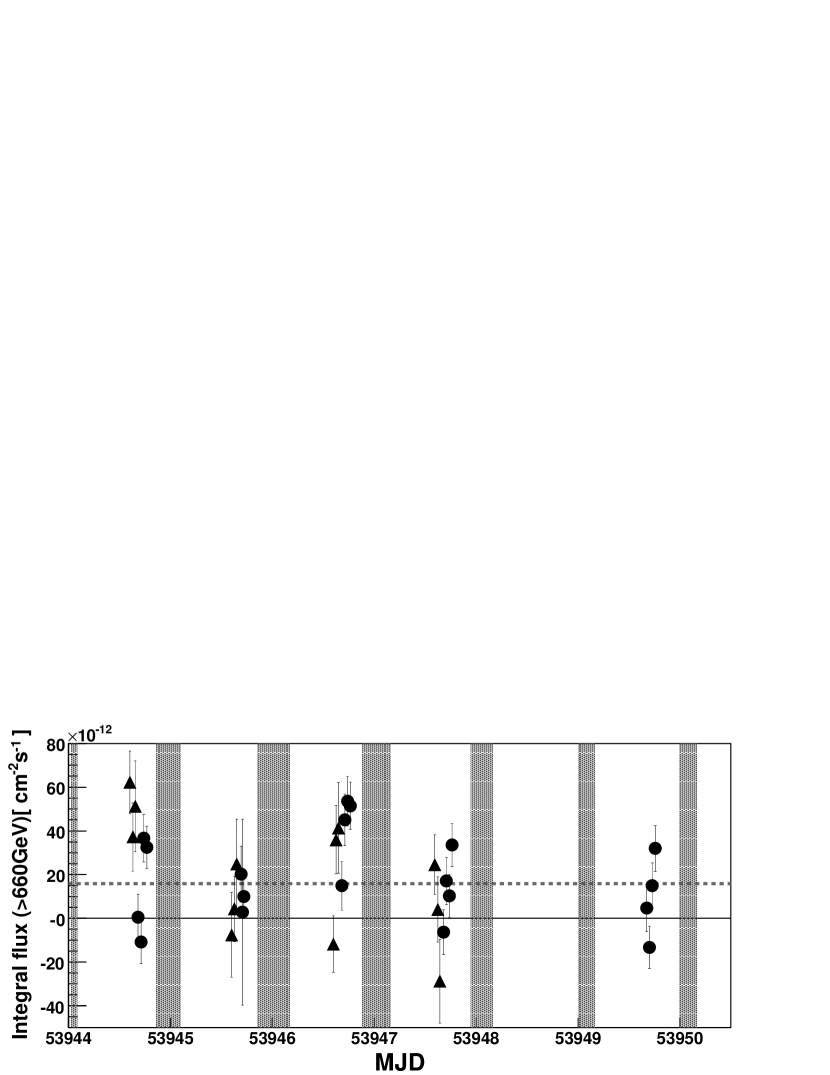
We further divide the data into minutes bins for each night, and intra-night variation is investigated. Since the pointing offset from the source position is alternated in sign every 20 minutes in our observations, 40 minutes bin is adopted as it offers a reasonable cancellation of any asymmetric effects. The light curve of PKS 2155304 expressed by the integral flux of VHE gamma-rays above 660GeV using – and – dataset is shown in Fig. 6.
Assuming a constant average flux for the data above 660 GeV, a fit yields a value of 96.4 for 30 degrees of freedom, which corresponds to a probability of . The same calculation was done for the data of July 28 and 30, and gave values of 29.2 and 22.1 for 6 degrees of freedom, respectively. The intra-night variations are apparent. From figure 6, although it is difficult to calculate the fractional root mean square variability amplitude (Vaughan et al., 2003) because of the poor statistics, on July 28 and on July 30 are obtained.
The results in the follow-up observations between August 17 and 25 are also summarized in Table 2. The 2 upper limit above 680 GeV is , which shows TeV gamma-ray activity had subsided compared to the outburst period.
5 Discussion
From Figure 5, the fluxes on July 28 and 30 exceed of the flux from the Crab nebula, and are the same level as that at the end of July 27–28 (MJD 53944) observation reported by the H.E.S.S. group (Aharonian et al., 2007), taking into account the difference of energy threshold and assuming a power law spectrum. The flux in July 29 might be underestimated due to the presence of clouds. Therefore, our light curve suggests that the flux continuously decreases on average following the large flare of July 28. The preliminary H.E.S.S. light curve above 200 GeV presented by Raue et al. (2006) indicates that a 5 crab flare occurred between our observations of July 29 and 30. However we did not detect a flare in this period, possibly due to the 10 hour gap between the end of the H.E.S.S. observations and the start of our observations. For the shorter variability time scales, the July 28 and 30 data indicate the intra-night variations.
The derived values of the fractional root mean square variability amplitude, for night by night variation and for intra-night variation in July 28, are comparable to the values from the intra-night variability earlier on July 28 reported by H.E.S.S. (Aharonian et al., 2007). They are rather higher than the values for the X-ray variability (e.g., 0.10–0.43 listed by Zhang et al. (1999)), (although much higher, and energy dependent, values of have been reported by MAGIC (Albert et al., 2007b) for Mrk 501).
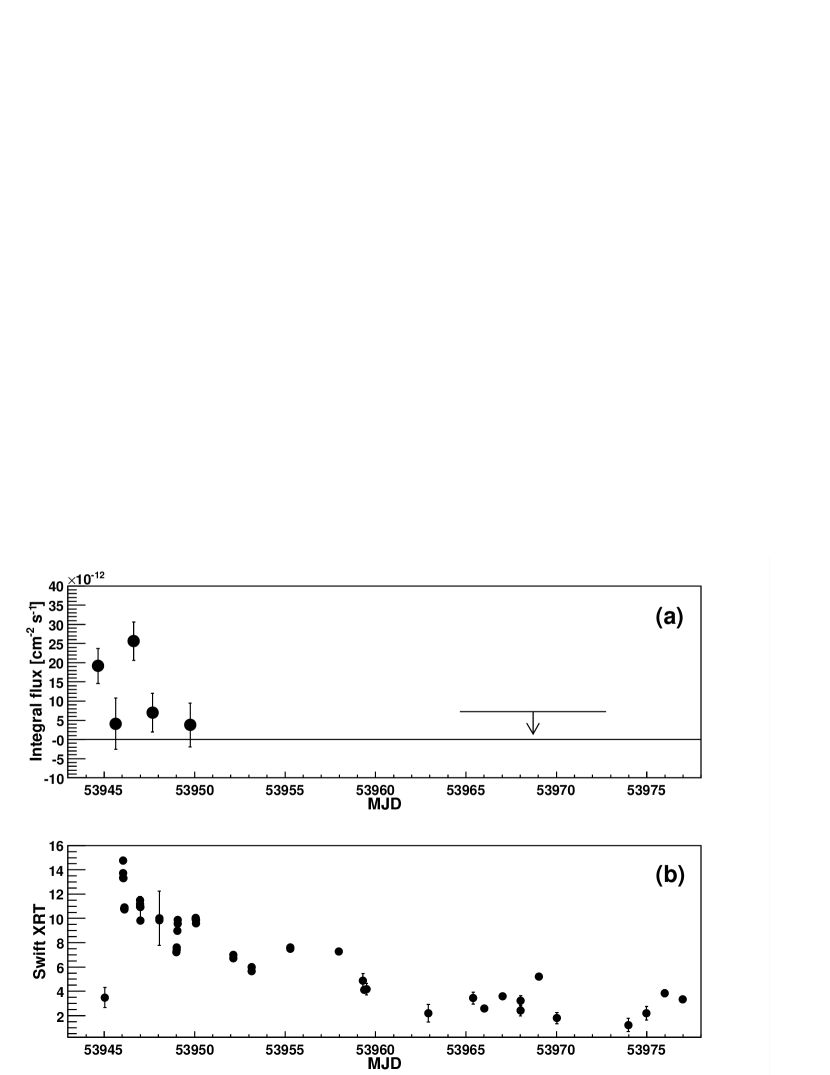
In Figure 7, our TeV light curve is plotted together with the x-ray light curve (Foschini et al., 2007). Unfortunately, started observations two hours after CANGAROO stopped observing each day, so there are no simultaneous observations. There is no evident correlation between the X-ray and the gamma-ray fluxes, with a time lag of approximately 9 hours. Foschini et al. (2007) reported the X-ray flux increased by a factor of 5 in the 0.3–10 keV energy band without a large spectral change, and the highest peak of the light curve corresponds to the second large TeV flare observed by H.E.S.S. (Raue et al., 2006). The X-ray flux in this outburst is not very high and it is not possible to detect time variation of the flux in the RXTE–ASM data. For observations in 2002 and 2003, no correlation between the X-ray and the gamma-ray fluxes was reported by H.E.S.S. (Aharonian et al., 2005b), however a strong correlation during 2004 observations was presented in a preliminary analysis by Punch et al. (2007). On the other hand, Mrk 421 has displayed a good correlation between the X-ray and the gamma-ray fluxes, although recently no correlation results, including “Orphan flares”, were reported. The simple one-zone SSC model is unable to explain such complex behavior (e.g., Blazejowski et al., 2005). Some models explaining “Orphan flares” have been proposed, for example, by Kusunose & Takahara (2006) for the leptonic model and Böttcher (2005) for the hadronic model.
During the outburst periods, the photon index may change along with the flux variations, as is the case for Mrk 421 and Mrk 501 (e.g., Aharonian et al., 2002; Krennrich et al., 2002; Albert et al., 2007a, b). However, the average photon index we obtained here does not differ from the value that H.E.S.S. reported previously (Aharonian et al., 2005a) within errors, and is consistent with those subsequently reported by H.E.S.S. (Aharonian et al., 2007) and MAGIC (Mazin & Lindfors, 2007). The reason for this difference in the variation of photon index between PKS 2155304 and Mrk 421 is still an open question. Although the error on the spectrum is enormous, a spectral index after correction for the absorption by the extra-galactic background light is calculated to be and using the baseline model and the fast evolution model by Stecker & Scully (2006), respectively.
6 Conclusion
We observed the southern HBL PKS 2155304 from 2006 July 28 (MJD 53944) to August 2 with the CANGAROO-III imaging Cherenkov telescopes. During the VHE high state we detected a signal at significance above 660 GeV in the total effective exposure time of 25.1 hours. The time averaged integral flux above 660 GeV is which corresponds to of the flux observed from the Crab nebula. The intra-night time variations of the flux were seen in our observations. Follow-up observations two weeks later indicated the source activity had decreased to lower than Crab flux..
References
- Aharonian et al. (1999) Aharonian, F., et al. 1999, A&A, 342, 69
- Aharonian et al. (2002) Aharonian, F., et al. 2002, A&A, 393, 89
- Aharonian et al. (2004) Aharonian, F., et al. 2004, ApJ, 614, 897
- Aharonian et al. (2005a) Aharonian, F., et al. 2005a, A&A, 430, 865
- Aharonian et al. (2005b) Aharonian, F., et al. 2005b, A&A, 442, 895
- Aharonian et al. (2005c) Aharonian, F., et al. 2005c, A&A, 437, 95
- Aharonian et al. (2007) Aharonian, F., et al. 2007, ApJ, 664, L71
- Albert et al. (2007a) Albert, J., et al. 2007, ApJ, 663, 125
- Albert et al. (2007b) Albert, J., et al. 2007, ApJ, submitted (astro-ph/0702008)
- Beilicke (2006) Beilicke, M. 2006, presentation at the 3rd Workshop on the Nature of Unidentified High-Energy Sources (Barcelona)
- Benbow et al. (2006) Benbow, W., Costamante, L., & Giebels, B. 2006, ATel #867
- Blazejowski et al. (2005) Blazejowski, M., et al. 2005, ApJ, 630, 130
- Böttcher (2005) Böttcher, M. 2005, ApJ, 621, 176
- Brinkmann et al. (1994) Brinkmann, W., et al. 1994, A&A, 288, 443
- Buckley et al. (1996) Buckley, J. H., et al. 1996, ApJ, 472, L9
- Chadwick et al. (1999a) Chadwick, P. M., et al. 1999a, ApJ, 513, 161
- Chadwick et al. (1999b) Chadwick, P. M., et al. 1999b, in Proc. 26th Int. Cosmic Ray Conf. (Salt Lake City), 3, 338
- Chiappetti et al. (1999) Chiappetti, L., et al. 1999, ApJ, 521, 552
- Cui (2004) Cui, W. 2004, ApJ, 605, 662
- Dermer & Schlickheiser (1993) Dermer, C. D., & Schlickheiser, R. 1993, ApJ, 416, 458
- Djannati-Atai et al. (1999) Djannati-Atai, A., et al. 1999, A&A, 350, 17
- Dominici et al. (2004) Dominici, T. P., et al. 2004, AJ, 128, 47
- Edelson et al. (1995) Edelson, R. A., et al. 1995, ApJ, 438, 120
- Edelson et al. (2001) Edelson, R. A., et al. 2001, ApJ, 554, 274
- Enomoto et al. (2006a) Enomoto, R., et al. 2006a, ApJ, 638, 397
- Enomoto et al. (2006b) Enomoto, R., et al. 2006b, ApJ, 652, 1268
- Falomo et al. (1993) Falomo, R. et al. 1993, ApJ, 411, L63
- Fisher (1936) Fisher, R. A. 1936, Annals of Eugenics, 7, 179
- Foschini et al. (2007) Foschini, L., et al. 2007, ApJ, in press(astro-ph/0701868)
- Gaidos et al. (1996) Gaidos, J. A., et al. 1996, Nature, 383, 319
- Giebels (2006) Giebels, B. 2006, presentation at 2nd Workshop on TeV Particle Astrophysics (Madison)
- Giommi et al. (1998) Giommi, P., et al. 1998, A&A, 333, L5
- Gliozzi et al. (2006) Gliozzi, M., et al. 2006, ApJ, 646, 61
- Griffiths et al. (1979) Griffiths, R. E., et al. 1979, ApJ, 234, 810
- Hayashida et al. (1998) Hayashida, K., et al. 1998, ApJ, 500, 642
- Hillas et al. (1985) Hillas, A. M., et al. 1985 in Proc. 19th Int. Cosmic Ray Conf. (La Jolla), 3, 445
- Hinton (2007) Hinton, J. 2007, in Proc. of the 30th Int. Cosmic Ray Conf. (Merida), Rapporteur Talk
- Hofmann et al. (1999) Hofmann, W. et al. 1999, Astropart. Phys., 122, 135
- Jones, O’dell & Stein (1974) Jones, T. W., O’dell, S. L., & Stein, W. A. 1974, ApJ, 188, 353
- Kabuki et al. (2003) Kabuki, S., et al. 2003, NIM, A500, 318
- Kabuki et al. (2007) Kabuki, S., et al. 2007, ApJ, 668, 968
- Kataoka et al. (2000) Kataoka, J., et al. 2000, ApJ, 528, 243
- Kataoka et al. (2001) Kataoka, J., et al. 2001, ApJ, 560, 659
- Kawachi et al. (2001) Kawachi, A., et al. 2001, Astropart. Phys., 14, 261
- Krawczynski et al. (2001) Krawczynski, H., et al. 2001, ApJ, 559, 187
- Krawczynski et al. (2002) Krawczynski, H., et al. 2002, MNRAS, 336, 721
- Krawczynski et al. (2004) Krawczynski, H., et al. 2004, ApJ, 601, 151
- Krennrich et al. (2002) Krennrich, F., et al. 2002, ApJ, 575, L9
- Kubo et al. (1998) Kubo, H., et al. 1998, ApJ, 504, 693
- Kubo et al. (2001) Kubo, H., et al. 2001, in Proc. 27th Int. Cosmic Ray Conf. (Hamburg), 2900
- Kusunose & Takahara (2006) Kusunose, M., & Takahara, F. 2006, ApJ, 651, 113
- Marshall, Carone, & Fruscione (1993) Marshall, H. L., Carone, T. E., & Fruscione, A. 1993, ApJ, 414, L53
- Mazin & Lindfors (2007) Mazin, D., & Lindfors, E. 2007, in Proc. of the 30th Int. Cosmic Ray Conf. (Merida), OG2.3, #936
- Nakase et al. (2003) Nakase, T. 2003, in Proc. 28th Int. Cosmic Ray Conf. (Tsukuba), 2587
- Nicastro (2002) Nicastro, F. 2002, ApJ, 573, 157
- Nishijima (2002) Nishijima, K. 2002, PASA, 19, 26
- Nishijima et al. (2001) Nishijima, K., et al. 2001, in Proc. 27th Int. Cosmic Ray Conf. (Hamburg), 2626
- Nishijima et al. (2005) Nishijima, K., et al. 2005, in Proc. 29th Int. Cosmic Ray Conf. (Pune), 15, 327
- Padovani & Giommi (1995) Padovani, P., & Giommi, P. 1995, ApJ, 444, 567
- Pian et al. (1997) Pian, E., et al. 1997, ApJ, 486, 784
- Piner & Edwards (2004) Piner, E., & Edwards, P. G. 2004, ApJ, 600, 115
- Punch et al. (1992) Punch, M., et al. 1992, Nature, 358, 477
- Punch et al. (2007) Punch, M., et al. 2007, presented at the 27th Int. Cosmic Ray Conf. (Merida)
- Quinn et al. (1996) Quinn, J., et al. 1996, ApJ, 456, L83
- Raue et al. (2006) Raue, M., et al. 2006, presented at the INTEGRAL Workshop on the keV to TeV Connection(Rome)
- Rebillot et al. (2006) Rebillot, P. F., et al. 2006, ApJ, 641, 740
- Roberts et al. (1999) Roberts, M. D., et al. 1999, A&A, 343, 691
- Sambruna et al. (2000) Sambruna, R. M., et al. 2000, ApJ, 538, 127
- Schwartz et al. (1979) Schwartz, D. A., et al. 1979, ApJ, 229, L53
- Sikora, Begelman & Rees (1994) Sikora, M., Begelman, M. C., & Rees, M. J. 1994, ApJ, 421, 153
- Sreekumar & Vestrand (1997) Sreekumar, P., & Vestrand, W. T. 1997, IAU Circular 6776
- Stecker & Scully (2006) Stecker, F. W., & Scully, S. T. 2006, ApJ, 652, L9
- Takahashi et al. (1996) Takahashi, T., et al. 1996, ApJ, 470, L89
- Takahashi et al. (2000) Takahashi, T., et al. 2000, ApJ, 542, L105
- Tanihata et al. (2001) Tanihata, C., et al. 2001, ApJ, 563, 569
- Treves et al. (1989) Treves A., et al. 1989, ApJ, 341, 733
- Ulrich, Maraschi, & Urry (1997) Ulrich, M.-H., Maraschi, L., & Urry, C. M., 1997, ARA&A, 35, 445
- Urry et al. (1997) Urry, C. M., et al. 1997, ApJ, 486, 799
- Vaughan et al. (2003) Vaughan, S., et al. 2003, MNRAS, 345, 1271
- Vestrand & Sreekumar (1999) Vestrand, W. T., & Sreekumar, P. 1999, Astropart. Phys., 11, 197
- Vestrand, Stacy, & Sreekumar (1995) Vestrand, W. T., Stacy, J. G., & Sreekumar, P. 1995, ApJ, 454, L93
- Zhang et al. (1999) Zhang, Y. H., et al. 1999, ApJ, 527, 719
- Zhang et al. (2002) Zhang, Y. H., et al. 2002, ApJ, 572, 762
- Zhang et al. (2005) Zhang, Y. H., et al. 2005, ApJ, 629, 686
- Zhang et al. (2006) Zhang, Y. H., et al. 2006, ApJ, 651, 782
- Zhang & Xie (1996) Zhang, Y. H., & Xie, G. Z. 1996, A&A, 116, 289
| Begin | End | |||||
|---|---|---|---|---|---|---|
| Date | [MJD] | [MJD] | [hrs] | [∘] | [Hz] | |
| July 28 | 2 | 53944.514 | 53944.663 | 3.6 | 29.8 | 18.7 |
| 3 | 53944.668 | 53944.830 | 3.9 | 20.4 | 12.1 | |
| July 29 | 2 | 53945.522 | 53945.660 | 3.1 | 27.6 | 14.9 |
| 3 | 53945.679 | 53945.762 | 2.0 | 12.1 | 6.2 | |
| July 30 | 2 | 53946.535 | 53946.656 | 2.9 | 26.1 | 20.1 |
| 3 | 53946.668 | 53946.833 | 4.0 | 22.2 | 12.5 | |
| July 31 | 2 | 53947.576 | 53947.653 | 1.8 | 19.5 | 19.8 |
| 3 | 53947.666 | 53947.827 | 3.9 | 21.7 | 11.6 | |
| Aug. 2 | 3 | 53949.658 | 53949.822 | 3.9 | 21.5 | 11.9 |
| July 28–Aug.2 | 2 | 11.4 | 26.6 | 18.2 | ||
| 3 | 17.6 | 20.4 | 11.4 | |||
| Aug. 17–25 | 3 | 19.1 | 20.9 | 10.9 |
| Date | [Hz] | [hrs] | [] | (660GeV) bbin unit of | ||||
|---|---|---|---|---|---|---|---|---|
| July 28 | 2 | 12.4 | 3.4 | 675 | 545 | 4.6 | ||
| 3 | 8.0 | 3.5 | 157 | 132 | 1.8 | |||
| July 29ccaffected by clouds | 2 | 10.2 | 2.2 | 338 | 340 | -0.12 | ||
| 3 | 4.1 | 0.9 | 39 | 32 | 1.2 | |||
| July 30 | 2 | 13.2 | 2.8 | 434 | 423 | 0.48 | ||
| 3 | 8.1 | 3.5 | 235 | 135 | 6.1 | |||
| July 31 | 2 | 13.0 | 1.7 | 229 | 224 | 0.29 | ||
| 3 | 7.6 | 3.6 | 156 | 135 | 1.4 | |||
| Aug. 2 | 3 | 7.8 | 3.5 | 142 | 133 | 0.66 | ||
| July 28–Aug.2 | 2 | 12.1 | 10.1 | 1676 | 1532 | 2.5 | ||
| 3 | 7.4 | 15.0 | 729 | 551 | 5.0 | |||
| Aug. 17–25 | 3 | 7.4 | 17.1 | 625 | 637 | ddThreshold energy is 680 GeV. |