Spectropolarimetry of a decaying sunspot penumbra
Abstract
We report on high angular resolution, high precision spectropolarimetric measurements of a decaying sunspot. The spot gradually lost its penumbra during the course of three days. In the late stages of evolution where the only remnant of the spot is a naked umbra, we find small-scale inhomogeneities in the magnetic canopy surrounding it. The inhomogeneities are observed as finger-like structures of weak and nearly horizontal magnetic fields extending 1-2″ from the outer border of the umbra. These fields are not associated with filamentary structures in continuum intensity, nor with conspicuous Evershed flows. The Stokes profiles emerging from the fingers exhibit blueshifts which we interpret as upward motions. This previously unknown fine structure may be related to penumbral field lines that no longer carry strong Evershed flows and rise to the chromosphere, producing the disappearance of the penumbra at photospheric levels.
Subject headings:
Sun: photosphere – magnetic fields – sunspots1. Introduction
The formation of sunspot penumbrae is a relatively well known process, both from an observational and theoretical point of view. Pores develop penumbrae suddenly, with no obvious gradual increase of the magnetic field inclination and little (if any) delay between the appearance of Evershed flows and inclined fields (Leka & Skumanich, 1998). From the theoretical side, it has been suggested that penumbra formation occurs when the magnetic field at the outer edges of pores reaches inclinations of about (Rucklidge et al., 1995; Tildesley & Weiss, 2004).
The disappearance of the penumbra, in contrast, still needs to be understood. Observations indicate that penumbral decay is a slow (several day) process, but to our knowledge no spectropolarimetric measurements of it have been presented so far. Studies of decaying active regions often concentrate on other aspects such as moving magnetic features (e.g., Zhang et al., 1992) or the moat flow (e.g., Deng et al., 2007). The disappearance of sunspot penumbrae is an important phenomenon which may partly explain the removal of flux from mature spots (cf. Martínez Pillet, 2002, and references therein). If so, it would play a crucial role in the activity cycle of the Sun. Penumbral decay may also be a source of localized chromospheric and coronal heating. Indeed, energetic flares in active regions have been related to the disappearance of sunspot penumbrae (Wang et al., 2004; Deng et al., 2005; Sainz Dalda & Martínez Pillet, 2007).
In this paper we analyze high angular resolution spectropolarimetric measurements of a decaying sunspot. We concentrate on the phase in which the sunspot lost all visible evidence of its penumbra. A Stokes inversion technique is used to determine magnetic field inclinations, field strengths, and line-of-sight (LOS) velocities. We find evidence for small-scale inhomogeneities in the magnetic canopy of the spot when it consists only of a naked umbra. The inhomogeneities are observed as horizontal field lines cospatial with blueshifted Doppler signals. The blueshifts could indicate the occasional establishment of an inward oriented Evershed flow. Alternatively, these structures may be related to penumbral field lines that no longer carry an Evershed flow. In the absence of strong material flows, the field lines could rise to the chromosphere by buoyancy, which would be observed in the photosphere as the disappearance of the penumbra.
2. Observations
The spectropolarimetric observations analyzed here were obtained with the Diffraction Limited Spectro-Polarimeter (DLSP; Sankarasubramanian et al., 2004) at the NSO Dunn Solar Telescope (DST) of Sacramento Peak, New Mexico. The DLSP was operated in high-resolution mode together with the high-order adaptive optics system of the DST (Rimmele, 2004). The slit width of 12 microns matched the detector image scale along the spectrograph slit (0.090″ pixel-1). The solar spectrum was sampled from 630.0 nm to 630.4 nm with 2.1 pm pixel-1. This wavelength range contains three Fe I and one Ti I magnetically sensitive lines (cf. Table 1).
| Line | Transition | |||
|---|---|---|---|---|
| [nm] | [eV] | |||
| Fe I | – | |||
| Fe I | – | |||
| Fe I | 4.32 | – | ||
| Ti I | 1.45 | – |
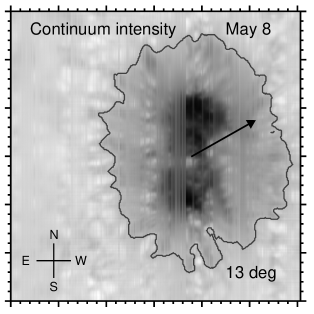
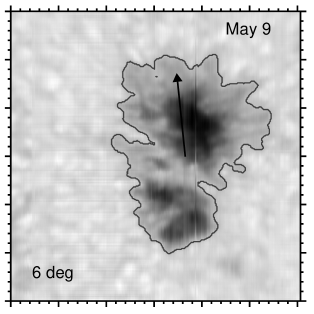
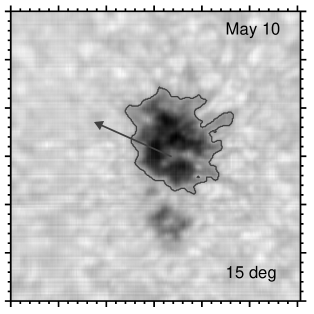
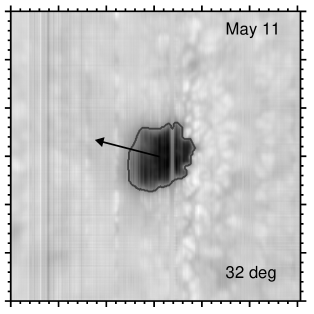
By moving the slit across the solar surface with steps of 00893 for a total of 337 positions, two dimensional maps of AR NOAA 10880 were generated on four consecutive days, from May 8 to May 11, 2006. The maps cover a field of view of . The slit was oriented along solar North-South and the scan direction was solar West-East. At every slit position, 16 images of 30 ms exposure time were accumulated for each of the four individual modulation states, leading to a total integration time of 2 s and completion of a full map within 28 minutes. The seeing conditions were quite variable on May 8 and May 11 and more stable on May 9 and May 10, as can be seen in the continuum maps of Fig. 1. Mostly the variable seeing and weather conditions, but also the time consuming calibration measurements needed to correct for instrumental polarization, were the prime limitations during this campaign, leading to one map per day only. Although the observations on May 8 and May 11 were most affected by variable conditions, these scans also featured lasting moments of excellent seeing during which an angular resolution of about 04 was attained.
We have applied standard reduction procedures to the data, including dark subtraction, flatfielding, and removal of instrumental polarization. After correction, the noise level in the Stokes profiles is as measured in the continuum of , , and . We perform an absolute velocity calibration by taking advantage of the telluric O2 lines present in the observed wavelength range (see e.g. Martínez Pillet et al., 1997).
The spectropolarimetric measurements were complemented with near synchronous G-band and Ca II K imaging. We used narrow-band interference filters centered at 430.55 nm (0.92 nm FWHM) for the G band and at 393.34 nm (0.1 nm FWHM) for Ca II K, with exposure times of 10 ms and 100 ms, respectively. Pixel sizes correspond to 003003 in the G-band channel and to 012012 in the Ca II K channel. The G-band images have been reconstructed using a speckle masking technique implemented by Wöger (2007). The spatial resolution of the reconstructed filtergrams is estimated to be 016, close to the diffraction limit of the DST at this wavelength (012). The Ca II K images reach a spatial resolution of some 06. The alignment between imaging data and spectropolarimetric observations was carried out with respect to the DLSP continuum maps. We estimate that residual rotation between the data sets is less than a fraction of a degree (). Image scale differences after re-scaling of the G-band and the Ca II K pixels are smaller than 1%, and residual offsets between the images are less than a fraction of a pixel ( pixel).
3. Data analysis
To get a qualitative idea of the dynamical and magnetic evolution of the sunspot and its penumbra, we compute Dopplergrams and magnetograms from the observed profiles as follows. LOS velocities are derived by applying a Fourier phase method to the and signals of Fe I 630.25 nm separately (Schmidt et al., 1999). Magnetograms are created as the Stokes signal of Fe I 630.25 nm at pm from line center. The magnetogram signal is roughly proportional to , with the inclination of the vector magnetic field to the LOS.
For a quantitative analysis of the observations we perform an inversion of the Stokes profiles of the May 10 and May 11 data sets using the SIR code (Ruiz Cobo & del Toro Iniesta, 1992). In view of the high angular resolution achieved by the instrument and notwithstanding the variable conditions prevailing on May 11, we regard a simple one-component atmosphere as sufficient to interpret the spectra of the four lines observed with the polarimeter. The inversion determines the three components of the vector magnetic field (strength, inclination, and azimuth), the LOS velocity, and the macro- and micro-turbulent velocities, all assumed to be height independent. The initial temperature stratification is modified using two free parameters. This allows to change the temperature at optical depth unity and the slope of the stratification. The code also determines the amount of stray-light contamination. In total, nine free parameters are retrieved from the inversion. The vector magnetic field returned by the code has been transformed to the local reference frame (LRF), where inclinations are measured with respect to the local vertical. The 180∘ ambiguity of the LOS field azimuth has been solved by selecting the azimuth values that produce the more symmetric magnetic field around the spot center in the LRF.
4. Results
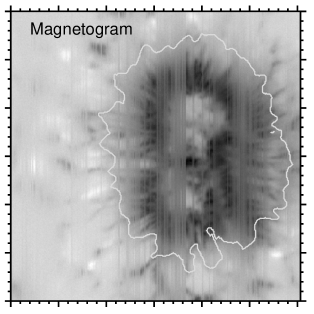
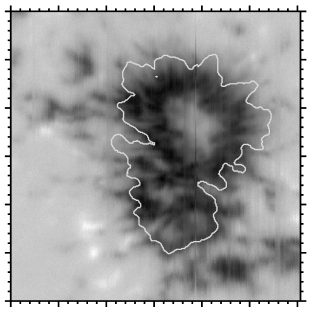
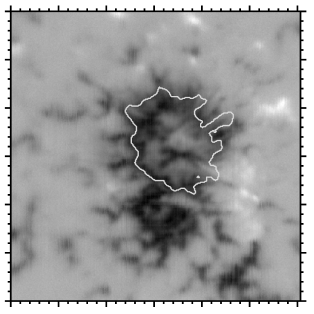
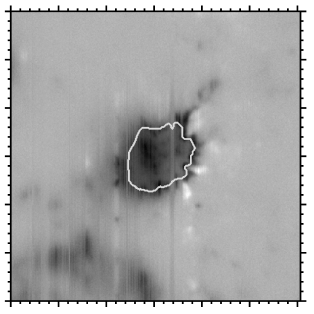
Figure 1 shows the sunspot decay on four consecutive days corresponding to heliocentric angles of 13, 6, 15, and 32∘, respectively. The sequence starts on May 8 with the spot having a fully developed penumbra (cf. the continuum intensity maps displayed in the upper panels). On May 9, the umbra splits in two parts and the penumbra begins to disappear. By May 10 the spot mainly consists of a naked umbra, with some penumbral filaments NW of the main umbra. Although the seeing conditions were very variable on May 11, no trace of penumbral filaments can be detected in the continuum intensity map. The only remnant of the spot on that day is a naked umbra about 8″ wide. Therefore, the disappearance of the penumbra took three days. Our May 13 observations show a small pore at the position of the spot which is no longer visible on May 14.
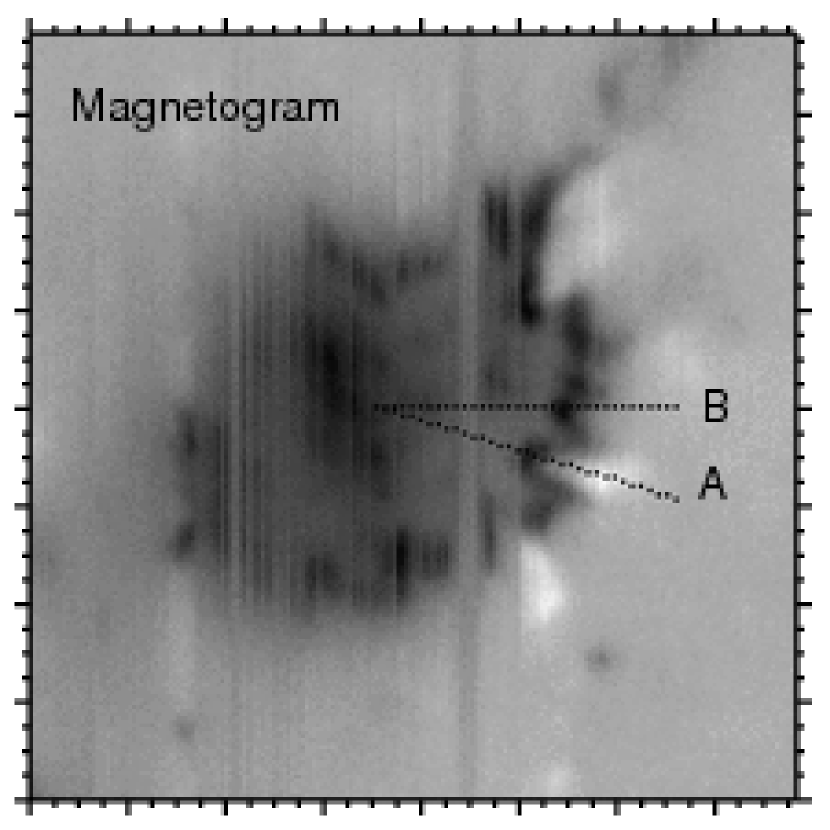
The middle panels of Fig. 1 display magnetograms of the spot. The filamentary organization of the penumbra is conspicuous on May 8 and 9. On May 10, the penumbral structure has disappeared for the most part, and the magnetic canopies of the naked umbrae are detected well beyond the edges of the spot. On May 11, the magnetic canopy is very much reduced, showing three distinct finger-like structures of positive polarity on the limb-side part of the spot (the white features observed in the magnetogram to the SW and the NW). The fingers extend from the visible border of the umbra into the quiet Sun by some 1-2″and have widths of about 05. To our knowledge, such inhomogeneities have never been reported before, perhaps because of their small sizes and/or short lifetimes.
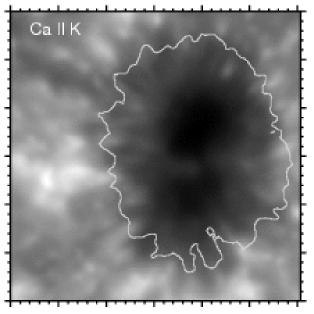
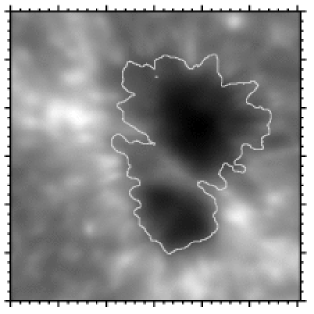
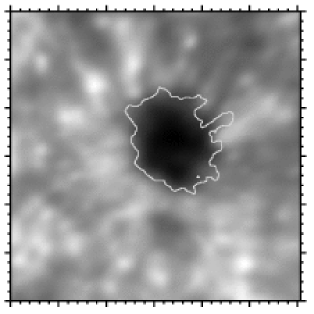
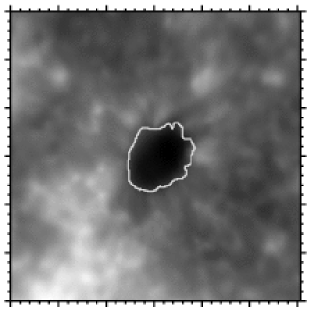
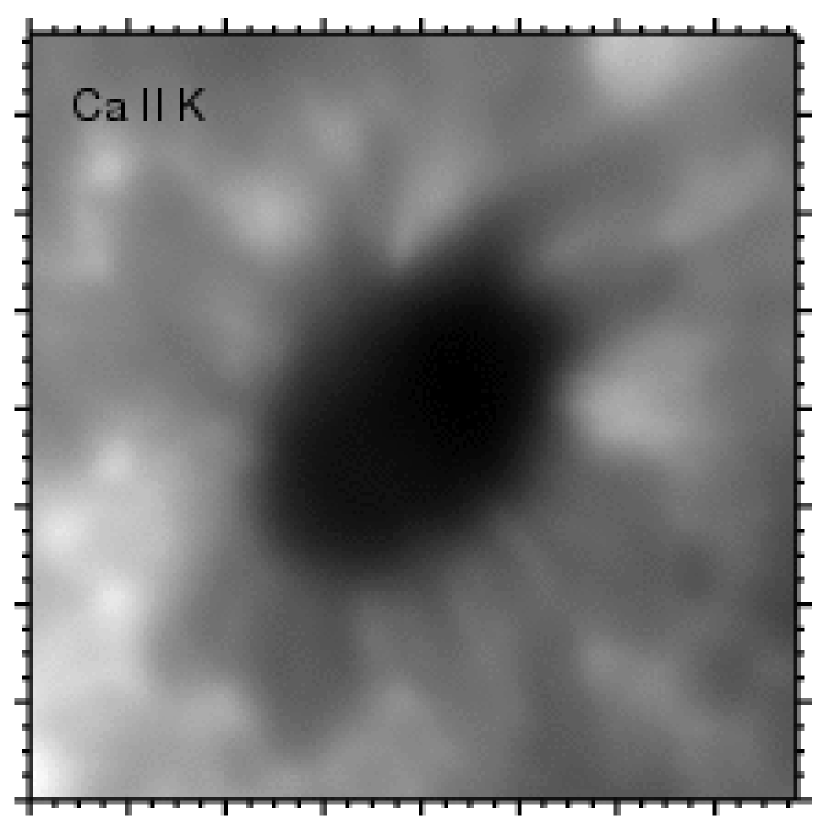
The Ca II K filtergrams in the bottom panels of Fig. 1 show the sunspot penumbra as a dark structure at chromospheric heights. The penumbra is rather homogeneous and do not exhibit small-scale filaments. Its size gradually decreases with time. Interestingly, however, on May 11 the spot still seems to have a chromospheric penumbra which is better developed toward the S and NW.
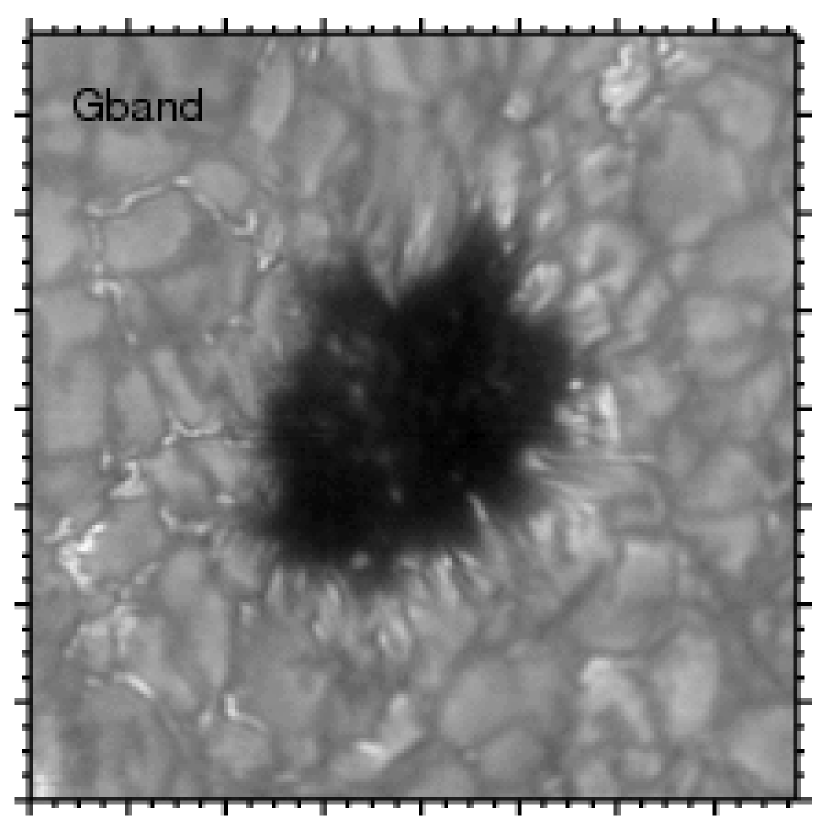
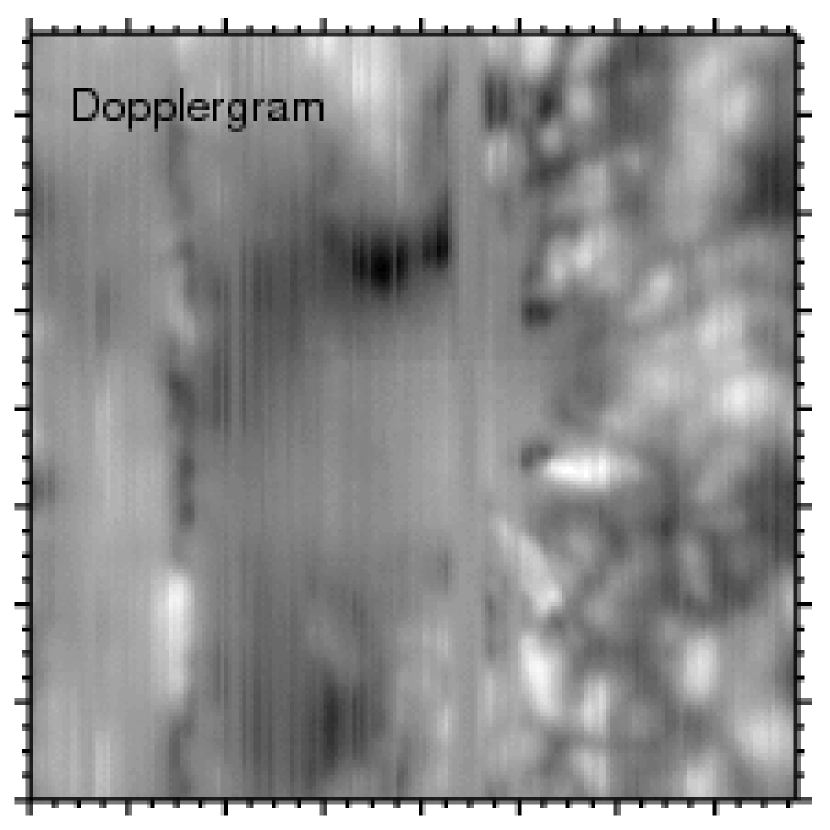
Figure 2 displays a reconstructed G-band image of the spot on May 11, together with the magnetogram showing the fingers, a Dopplergram, and a Ca II K filtergram. As can be seen in the G-band image, the spot consists only of a naked umbra without penumbral filaments. Very close to the umbral border, on the west side of the spot, one can observe tiny G-band fibrils cospatial with the fingers detected in the magnetogram. The fibrils show up as bright elongated structures aligned radially, similar in shape and appearance to the ones discovered by Scharmer et al. (2002). The granulation around the umbra is distorted and exhibits larger G-band intensities than the surrounding quiet Sun. The Dopplergram reveals conspicuous blueshifts at the position of the fingers, indicating plasma motions toward the observer. We want to emphasize that these blueshifts cannot be produced by Evershed flows, since on that part of the spot they would result in redshifted Stokes profiles.
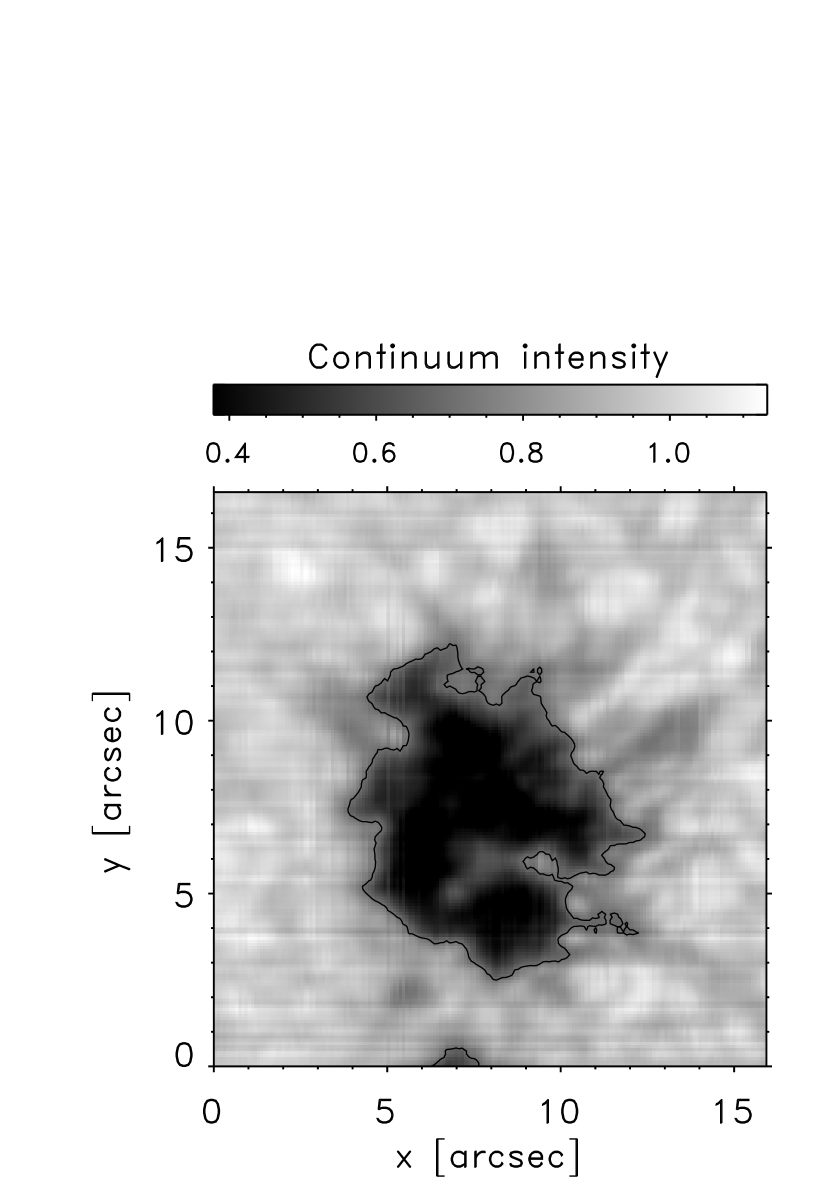
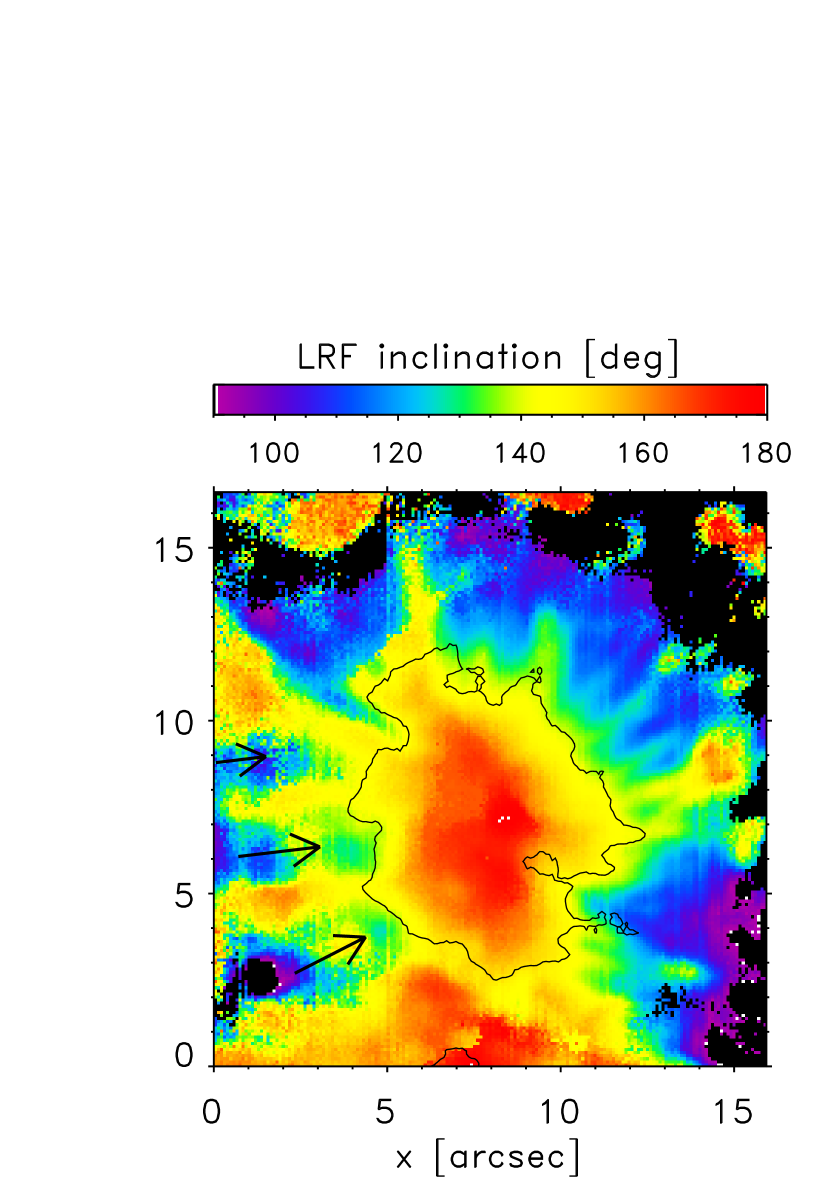
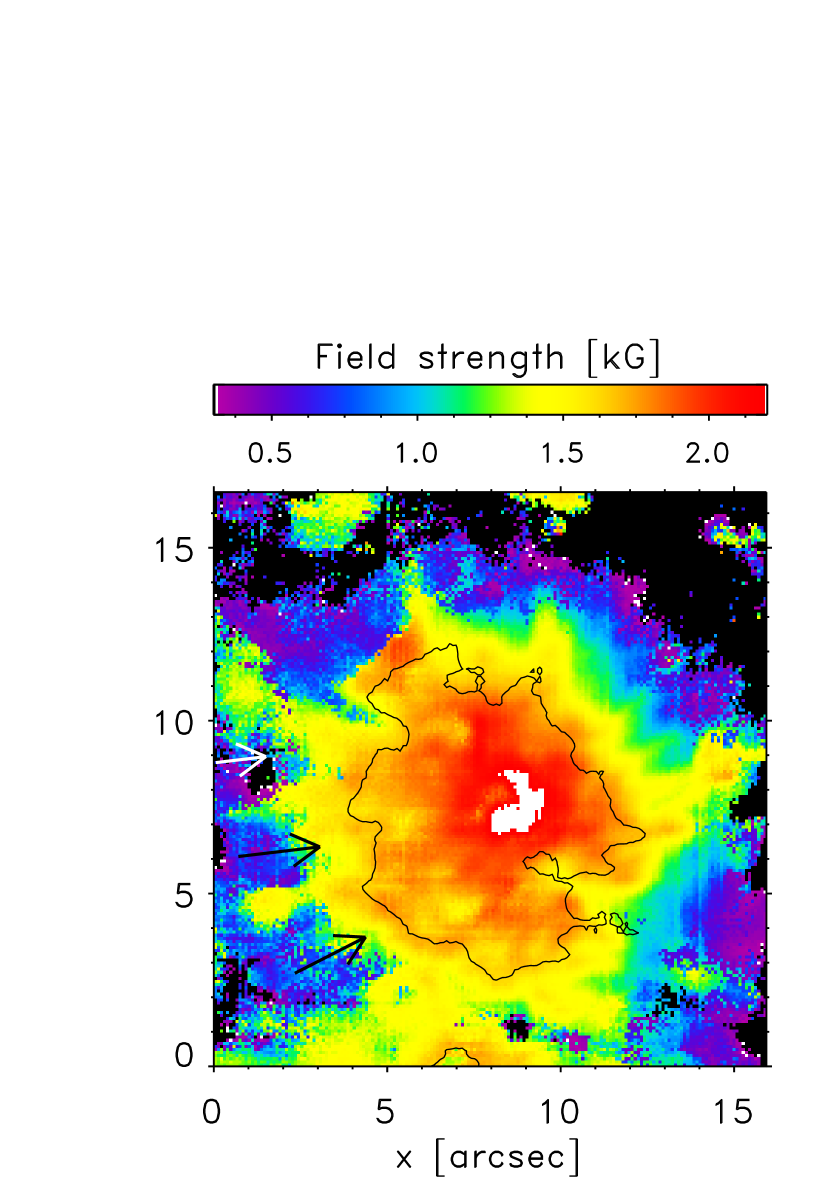
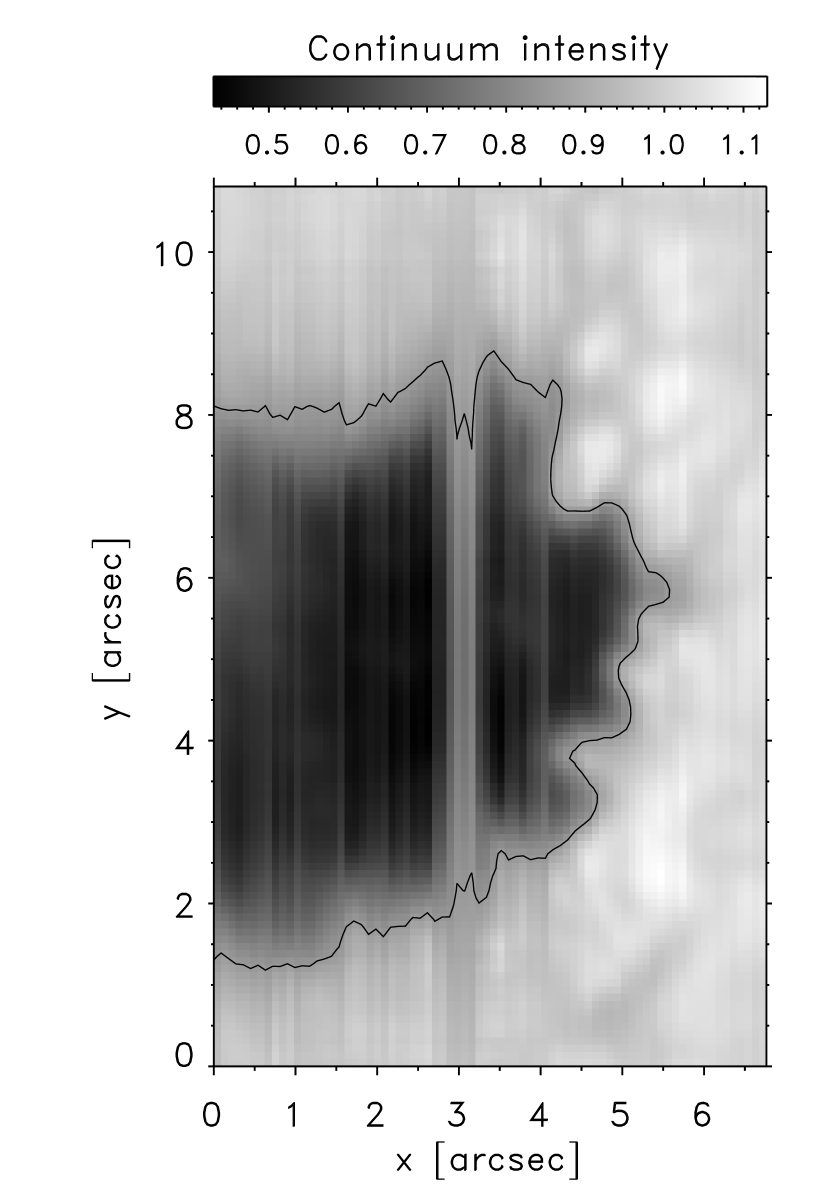
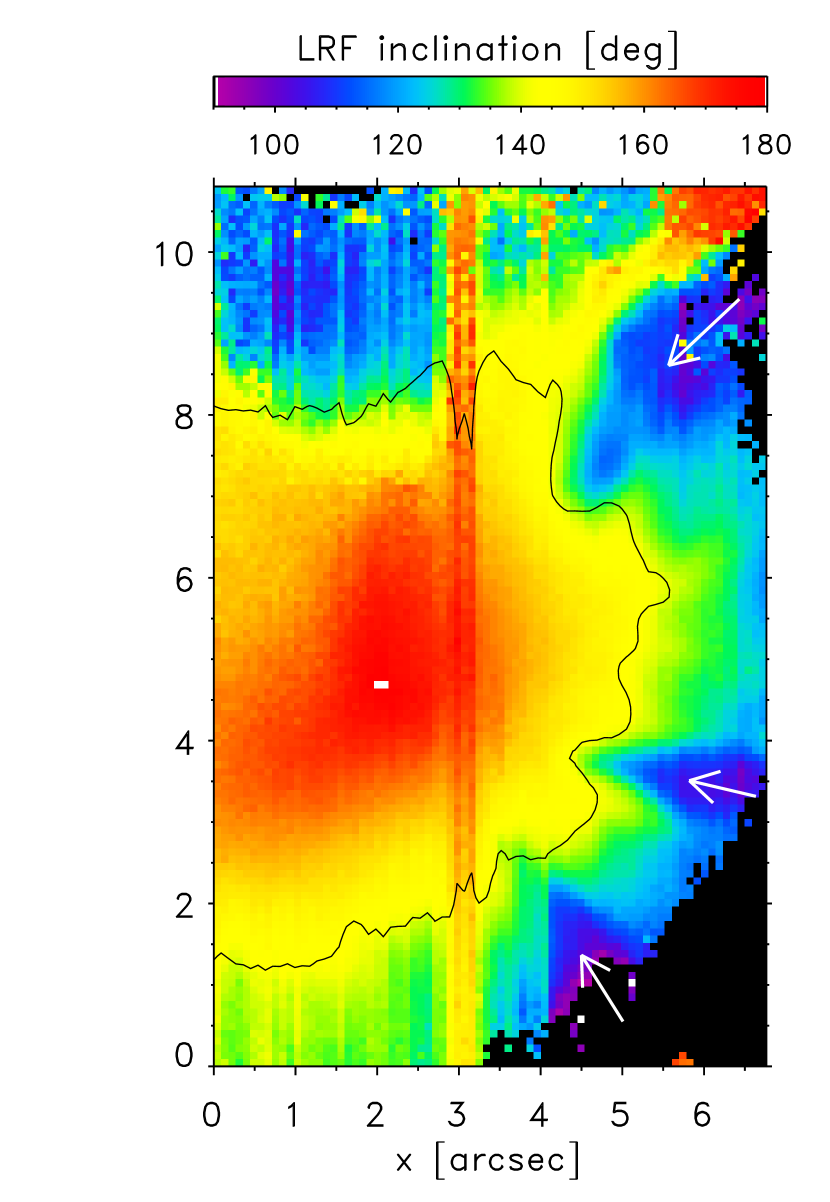
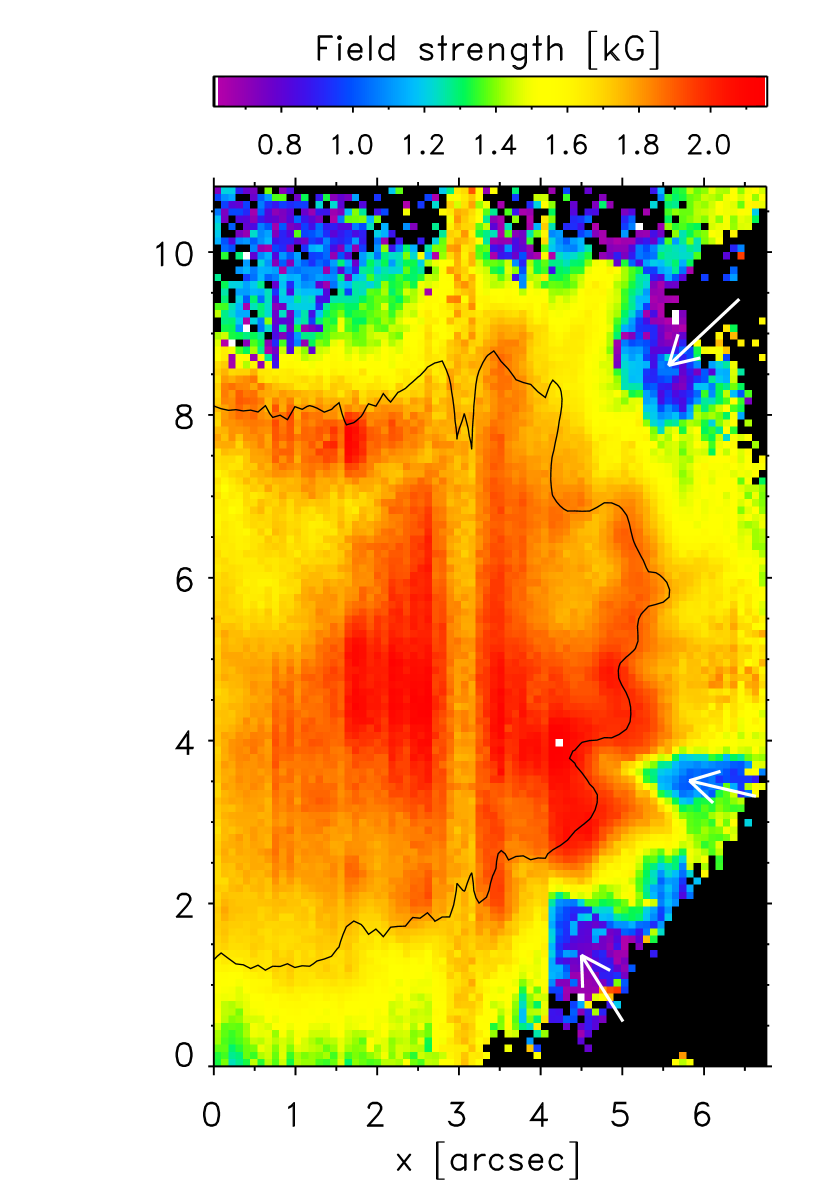
The physical parameters retrieved from the inversion of the May 10 and 11 data sets are shown in Fig. 3. We display continuum images of the spot along with field inclination, field strength, and LOS velocity maps. The arrows mark regions in the canopy where the field is weaker and more horizontal. These regions look like fingers and can be detected not only on May 11, but also on May 10 at position angles where no penumbral filaments exist. Interestingly, the penumbral filaments observed on the NW side of the spot on May 10 show a typical pattern of spines and intra-spines (Lites et al., 1993) in the inclination map. This pattern is different from that associated with the fingers.
Given the simplicity of our inversion, the atmospheric parameters presented in Fig. 3 should be regarded as averages along the line forming region. The mean inclination of the canopy fields at the border of the umbra is about 140∘ (corresponding to 40∘ for a positive polarity spot), which agrees very well with the values observed in pores (Keppens & Martínez Pillet, 1996). The finger-like inhomogeneities exhibit fields that are more horizontal than the average by up to 20-40∘ at the same radial distance. Also, the field in the fingers is weaker by up to 600-1000 G. These differences are well above the uncertainties in the retrieved parameters (some for the inclination and 100 G for the field strength). Figure 3 demonstrates that the fingers were observed on May 11 as opposite-polarity structures only because of the large heliocentric angle of the spot. Thus, the opposite polarities detected in the magnetograms do not mean that the field is actually returning to the solar surface.
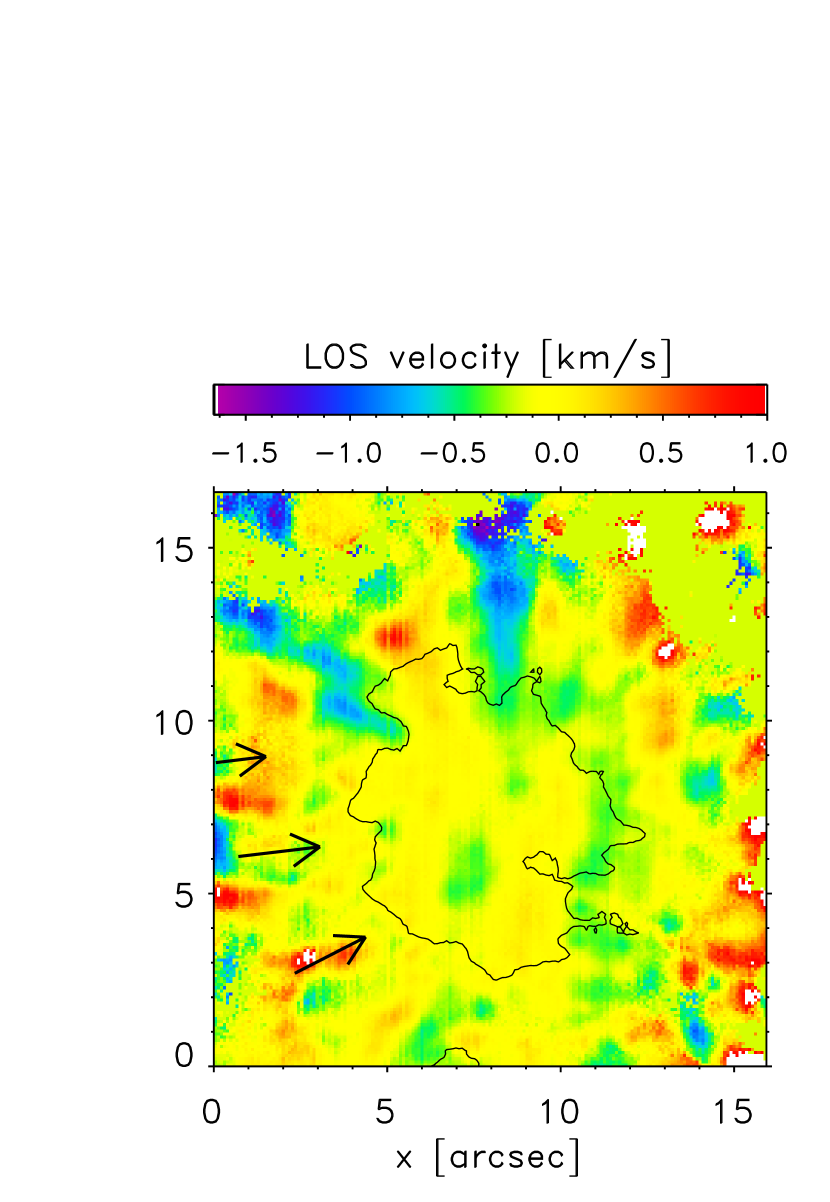
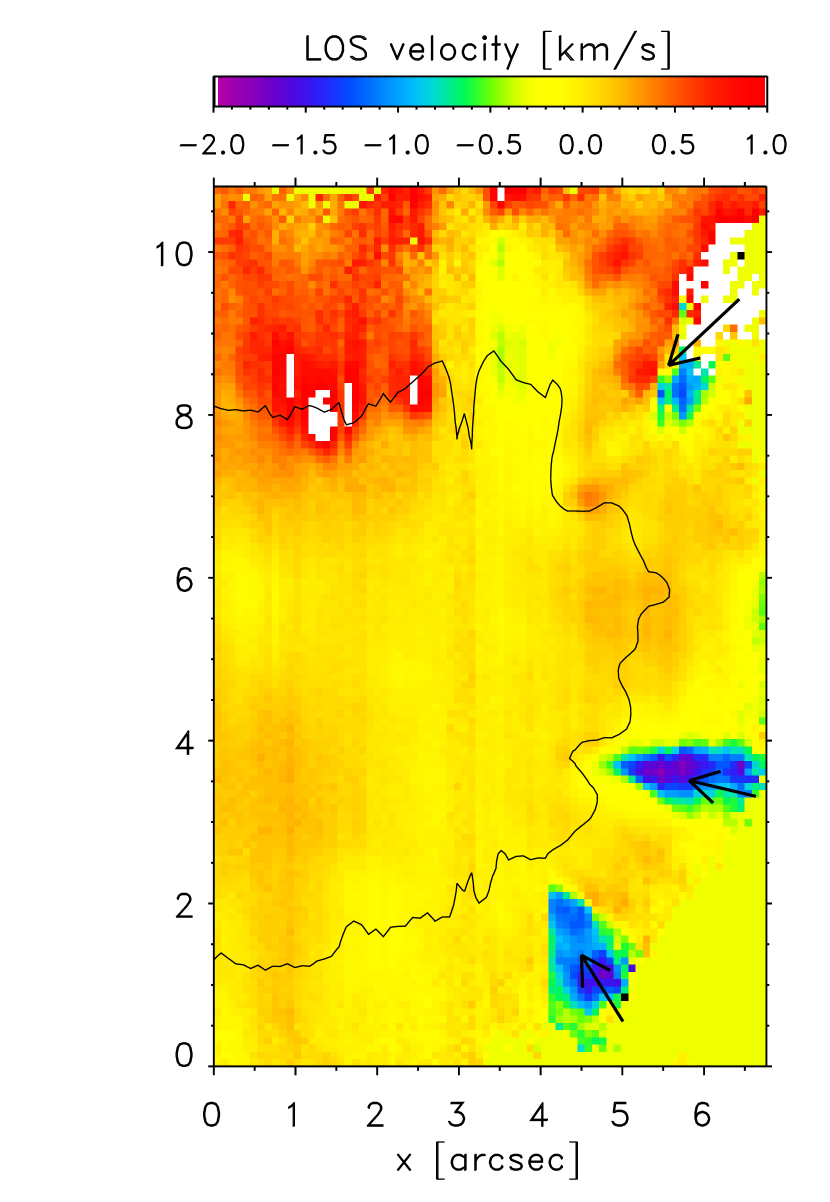
The kinematic configuration of the spot is displayed in the rightmost panels of Fig. 3. On May 11, the LOS velocities in the limb-side part of the canopy are nearly zero except for the fingers, which show enhanced motions of 1-2 km s-1 toward the observer. These motions coincide with the regions of weaker and more horizontal fields. We do not find enhanced LOS velocities in the fingers of May 10, which might be due to either a less evolved state of the penumbra, or the smaller heliocentric angle of the spot.
Figure 4 illustrates the variation of the atmospheric parameters along the two radial cuts marked in Fig. 2. They sample one of the fingers (cut A) and the nearby “undisturbed” magnetic canopy (cut B). As can be seen, the field inclination decreases almost linearly from the center of the umbra all the way to its visible border. From that point on, the magnetic field becomes more inclined at a much faster pace in the finger, while in the undisturbed canopy the inclination still increases linearly. The finger reaches a maximum inclination of about 105∘ at radial distances of and beyond, while the magnetic canopy has a field which is more vertical by up to 20∘ at the same position. In the umbra, the field strength and the LOS velocity show values of around 2 kG and 0 km s-1, respectively, and do not change significantly with radial distance. Once the border of the umbra is reached, however, the field strength decreases and the LOS velocity increases dramatically in the finger. As a result, at the field strength goes down to 1 kG and the LOS velocity reaches negative values of 1.7 km s-1 (toward the observer). In the magnetic canopy, the variation of field strength and LOS velocity is much smaller.
5. Discussion
The physical properties of the small-scale inhomogeneities detected in the magnetic canopy of the decaying sunspot are reminiscent of those of the photospheric flux tubes that form the penumbra (Solanki, 2003; Borrero et al., 2004; Bellot Rubio, 2007). Both have weaker and significantly more horizontal fields than their surroundings. Unlike penumbral flux tubes, however, the inhomogeneities are not associated with filamentary structures in continuum intensity and do not harbor outward directed Evershed flows.
We interpret the scenario drawn by Fig. 2 as one of a magnetic canopy (i.e., horizontal fields) showing small-scale, finger-like inhomogeneities of polarity opposite to that of the umbra. The inhomogeneities are not associated with regular penumbral filaments, suggesting that they are indeed located in a magnetic canopy which is elevated above the continuum forming layers. Below the canopy, the plasma must be field-free for the most part, otherwise dark structures would be observed in continuum intensity. As mentioned before, the Ca II K filtergram reveals a partly developed penumbra at chromospheric heights. The existence of a penumbra in the chromosphere is consistent with the scenario of an elevated magnetic canopy. The fingers have no clear Ca II K counterparts.
In principle, the blueshifts associated with the fingers could be explained in a similar way as the classical Evershed effect. Already Meyer & Schmidt (1968) proposed that the photospheric Evershed flow is the result of a pressure difference between the two footpoints of connected penumbral field lines: the inner penumbra displays field strengths of around 1000 G, whereas typical photospheric magnetic concentrations are found to harbor fields of around 1500 G. The corresponding pressure difference between the two footpoints would drive the flow (cf. Thomas & Weiss, 2004, and references therein). One difficulty with this classical explanation of the Evershed effect is that we know now that the flow-carrying field lines return to the photosphere not in typical magnetic flux concentrations, but right at the penumbra-photosphere boundary (or even inside the penumbra) where the field strength is indeed less than 1000 G (Westendorp et al., 1997). Yet, an argument along those lines can be constructed here to explain the observed blueshifts. As shown in Fig. 3, the field strength near the decaying spot is about 2000 G, whereas in the outer footpoint is only slightly above 1000 G. In this case, the siphon-flow hypothesis favors an inward directed flow, in agreement with the observations. We caution, however, that the gas pressure at the same heights in the two footpoints has not been infered in this work.
Another possibility is that the blueshifts represent upward motions of nearly horizontal penumbral flux tubes. In the absence of strong Evershed flows, the tubes might rise buoyantly to layers above the continuum forming region. This would produce the disappearance of the penumbra in the photosphere, consistent with the observation that the inhomogeneities occur in the last stages of the spot evolution. The mechanism whereby the Evershed flow disappears in those tubes remains unclear, but it might be related to the exhaustion of the mass reservoir that feeds the flow.
The exact reason why all sunspots display an Evershed flow is not yet known. A gas pressure difference could be the origin of the flow (either from a different field strengths at the two footpoints or from an excess heat in the upflowing plasma, cf. Schlichenmaier 2002), but in any case considerable amounts of mass participate in this flow during the typical lifetime of a sunspot. The existence of a mass reservoir for the Eveshed flow must be understood in terms of the exact connectivity of the sunspot field lines below the photosphere. It has been suggested recently that sunspots are indeed disconnected, at least in a dynamical sense, from their parent toroidal flux tube (Schüssler & Rempel, 2005). Helioseismology also seems to indicate that sunspots are a very shallow phenomenon (Zhao et al., 2001), with flows in layers 10 Mm deep that cannot be related to an Evershed flow source. Such a disconnection can also imply a disconnection of the surface sunspot from the large mass reservoirs in the deep interior, setting a maximum lifetime to the duration of the Evershed flow for a given spot.
6. Summary
We have presented high angular resolution spectropolarimetric observations of a decaying sunspot. The penumbra is seen to disappear from the photosphere over the course of three days. When the spot looses its penumbra, magnetograms in Fe I 630.25 nm show finger-like structures extending from the visible border of the umbra into the quiet Sun. These inhomogeneities have lengths of 1-2″and widths of about 05. They are oriented radially with respect to the spot center, but do not bear any relation with classical penumbral filaments. The fingers exhibit conspicuous blueshifts, indicating upward motions.


We have subject the observed Stokes spectra to simple one-component inversions to infer the average physical properties of the fingers and their environs. The umbra of the decaying spot is bigger in polarized light than in continuum intensity, revealing the existence of a magnetic canopy. The fingers belong to the canopy, but are found to possess weaker and more inclined fields. At the same radial distance, the differences between the fingers and the undisturbed magnetic canopy may amount to 600-1000 G and 40∘, respectively. In addition, the inversions confirm that the fingers harbor line-of-sight velocities of up to 1-2 km s-1.
The small sizes of these structures may explain why they have not been described earlier. Their origin is unclear as yet, but they seem to be associated with the disappearance of the penumbra. One possibility is that the observed blueshifts are the signature of inward directed photospheric Evershed flows, which would be driven by a classical siphon-flow mechanism. Another possibility is that the inhomogeneities represent penumbral field lines which no longer carry outward directed Evershed flows. In the absence of the mass associated with the normal Evershed flow, the field lines might rise to the chromosphere by buoyancy, producing the disappearance of the penumbra at photospheric levels. The upward motion of the field lines would be observed as blueshifts. This scenario finds some support in the recent idea that sunspots are disconnected from their parent toroidal flux tubes residing at the base of the convection zone. If sunspots are indeed disconnected, they will be able to store only a finite amount of mass. After some time (weeks to months) feeding the Evershed flow, the mass reservoir of any sunspot would eventually be exhausted and the flow would come to a halt.
To distinguish between scenarios, higher cadence observations and longer coverage of decaying sunspots are required. This would make it possible to characterize the time evolution of the vector field and to determine the exact moment where the Evershed flow disappears. Space-borne observations, virtually free from seeing effects, represent the best option to solve this problem. In the future, we plan to analyze spectropolarimetric measurements taken by Hinode (Kosugi et al., 2007) to shed more light on the nature of the fingers described in this paper. The high resolution Ca II H filtergrams of Hinode will also allow us to investigate whether the disappearance of the penumbra in the photosphere produces any effect at chromospheric heights, as can be expected if the field lines rise buoyantly and interact with the magnetic field of the chromosphere.
References
- Bellot Rubio (2007) Bellot Rubio, L. R. 2007, in Highlights of Spanish Astrophysics IV, eds. F. Figueras et al. (Springer: Dordrecht), 271
- Borrero & Bellot Rubio (2002) Borrero, J. M., & Bellot Rubio, L. R. 2002, A&A, 385, 1056
- Borrero et al. (2004) Borrero, J. M., Solanki, S. K., Bellot Rubio, L. R., Lagg, A., & Mathew, S. K. 2004, A&A, 422, 1093
- Deng et al. (2005) Deng, N., Liu, C., Yang, G., Wang, H., & Denker, C. 2005, ApJ, 623, 1195
- Deng et al. (2007) Deng, N., Prasad Choudhary, D., Tritschler, A., Denker, C., Liu, C., & Wang, H. 2008, ApJ, in press, [arXiv:0709.3340]
- Keppens & Martínez Pillet (1996) Keppens, R., & Martinez Pillet, V. 1996, A&A, 316, 229
- Kosugi et al. (2007) Kosugi, T., et al. 2007, Sol. Phys., 243, 3
- Leka & Skumanich (1998) Leka, K. D., & Skumanich, A. 1998, ApJ, 507, 454
- Lites et al. (1993) Lites, B. W., Elmore, D. F., Seagraves, P., & Skumanich, A. P. 1993, ApJ, 418, 928
- Meyer & Schmidt (1968) Meyer, F., Schmidt, H.U. 1968, Zeits. Ang. Math. Mech. 48:T218-21
- Martínez Pillet (2002) Martínez Pillet, V. 2002, Astronomische Nachrichten, 323, 342
- Martínez Pillet et al. (1997) Martínez Pillet, V., Lites, B. W., & Skumanich, A. 1997, ApJ, 474, 810
- Nave et al. (1994) Nave, G., Johansson, S., Learner, R. C. M., Thorne, A. P., & Brault, J. W. 1994, ApJS, 94, 221
- Rezaei et al. (2006) Rezaei, R., Schlichenmaier, R., Beck, C., & Bellot Rubio, L. R. 2006, A&A, 454, 975
- Rimmele (2004) Rimmele, T. R. 2004, ApJ, 604, 906
- Rucklidge et al. (1995) Rucklidge, A. M., Schmidt, H. U., & Weiss, N. O. 1995, MNRAS, 273, 491
- Ruiz Cobo & del Toro Iniesta (1992) Ruiz Cobo, B., & del Toro Iniesta, J. C. 1992, ApJ, 398, 375
- Sainz Dalda & Martínez Pillet (2007) Sainz Dalda, A., & Martínez Pillet, V. 2007, in: Subsurface and atmospheric influences on solar activity, K.S. Balasubramaniam, R. Howe, R. Komm (eds), ASP Conf. Series, in preparation
- Sankarasubramanian et al. (2004) Sankarasubramanian, K., et al. 2004, Proc. SPIE, 5171, 207
- Scharmer et al. (2002) Scharmer, G. B., Gudiksen, B. V., Kiselman, D., Löfdahl, M. G., & Rouppe van der Voort, L. H. M. 2002, Nature, 420, 151
- Schlichenmaier (2002) Schlichenmaier, R. 2002, Astronomische Nachrichten, 323, 303
- Schmidt et al. (1999) Schmidt, W., Stix, M., Wöhl, H. 1999, A&A, 346, 633
- Schüssler & Rempel (2005) Schüssler, M. & Rempel, M. 2005, A&A, 441, 337
- Solanki (2003) Solanki, S. K. 2003, A&A Rev., 11, 153
- Thomas & Weiss (2004) Thomas, J.H., & Weiss, N. O. 2004, Annu. Rev. Astron. Astrophys., 42, 517
- Tildesley & Weiss (2004) Tildesley, M. J., & Weiss, N. O. 2004, MNRAS, 350, 657
- Wang et al. (2004) Wang, H., Liu, C., Qiu, J., Deng, N., Goode, P. R., & Denker, C. 2004, ApJ, 601, L195
- Westendorp et al. (1997) Westendorp Plaza, C., del Toro Iniesta, J. C., Ruiz Cobo, B., Martínez Pillet, V., Lites, B.W., & Skumanich, A. 1997, Nature, 389,47
- Wöger (2007) Wöger, F. 2007, High-resolution observations of the solar photosphere and chromosphere, Ph.D. Thesis Albert-Ludwig Universität Freiburg, Germany, http://www.freidok.uni-freiburg.de/volltexte/2933/
- Zhang et al. (1992) Zhang, H., Ai, G., Wang, H., Zirin, H., & Patterson, A. 1992, Sol. Phys., 140, 307
- Zhao et al. (2001) Zhao, J., Kosovichev, A.G., & Duvall, T.L. 2001, ApJ, 557, 384