Approximate relaxation in glass-forming liquids
Abstract
We present data for the dielectric relaxation of 43 glass-forming organic liquids, showing that the primary (alpha) relaxation is often close to relaxation. The better an inverse power-law description of the high-frequency loss applies, the more accurately is relaxation obeyed. These findings suggest that relaxation is generic to the alpha process, once a common view, but since long believed to be incorrect. Only liquids with very large dielectric losses deviate from this picture by having consistently narrower loss peaks. As a further challenge to the prevailing opinion, we find that liquids with accurate relaxation cover a wide range of fragilities.
pacs:
64.70.PfGlass may be regarded as the fourth state of conventional matter, isotropic as the liquid state, but solid as the crystalline state. With the notable exception of helium, any liquid may be turned into glass by cooling it fast enough to avoid crystallization gut95 ; edi96 ; ang00 ; don01 ; dyr06 . At the glass transition all molecular motion beyond vibrations essentially come to a standstill. Since glass inherits the liquid’s molecular structure, a deeper understanding of the glassy state may come from understanding the highly viscous liquid phase preceding glass formation. This paper presents a compilation of data for glass-forming organic liquids probed by dielectric relaxation, i.e., by studying their response to an external periodic electric field. The data show that the current understanding of viscous-liquid dynamics is incomplete, and that these dynamics are simpler than presently believed.
Physical systems usually relax following perturbations forced upon them. The simplest form of relaxation is an exponential decay towards equilibrium which is, however, surprisingly seldom observed. Another simple case is the so-called relaxation where the relaxation function at short times decays as . This is observed in systems as diverse as free Rouse dynamics of polymer chains doi86 , molecular nanomagnets wer99 ; wer06 , and turbulent transport, e.g., in astrophysics bak04 . For random walks, the equivalent of relaxation is referred to as single-file diffusion which is observed, e.g., in ion channels through biological membranes, diffusion in zeolites, and charge-carrier migration in one-dimensional polymers mon02 . Below we present data showing prevalence of relaxation in glass-forming liquids. The data were taken on organic liquids in the extremely viscous state approaching the glass transition; here the relaxation time in some cases is larger than 1 second – which may be contrasted to the relaxation time of ambient water that is around 1 picosecond. This is the first proof of a general prevalence of relaxation in highly viscous liquids, thus going significantly beyond the conjecture from 2001 that if a liquid obeys accurate time-temperaure superposition, it exhibits relaxation ols01 .
The dominant and slowest relaxation process of a glass-forming liquid is the so-called alpha process. The alpha process defines the liquid relaxation time, an important quantity because the glass transition takes place when the relaxation time significantly exceeds the inverse relative cooling rate. The most accurate data for the alpha process are obtained by dielectric relaxation measurements that directly probe molecular rotation in liquids where the molecules have a permanent dipole moment. With modern frequency analyzers precise data may be obtained over more than 9 decades of time/frequency kre02 , and large amounts of dielectric data for glass-forming liquids are now available kud99 ; rol05 .
We have measured the dielectric loss as a function of frequency for a number of organic glass formers and supplemented these by data from the Bayreuth and Augsburg groups, giving altogether 43 liquids measured slightly above the glass transition temperature suppl . The only liquids excluded are monoalcohols note_1 , which are known to exhibit a very strong Debye loss peak with a relaxation time that is not coupled to the calorimetric glass transition hut07 . In order to avoid bias, data were selected prior to their analysis. A model-free data analysis was performed, i.e., without fitting data to any of the standard functions (stretched exponential, Havriliak-Nagami, Cole-Cole, Cole-Davidson, etc). This is an unusual procedure because very accurate data are required in order to obtain, e.g., reliable slopes by numerical differentiation. The data analysis was automated as far as possible via Matlab programs. We did not distinguish between liquids with and without clearly visible Johari-Goldstein secondary (beta) processes, but included all available data of sufficient quality to complete the analysis. No attempts were made to subtract possible contributions from beta processes. Details of the measurements are given in Ref. suppl .
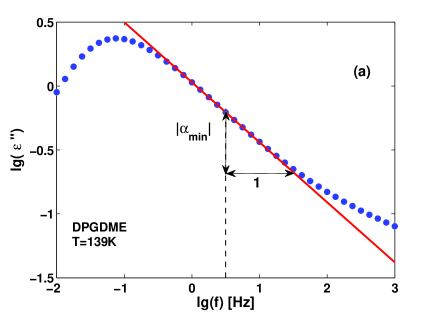
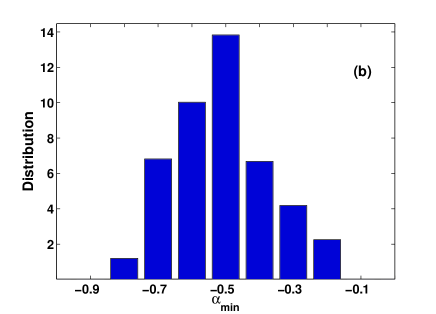
The low-frequency (long-time) properties of the alpha process are fairly trivial; the vast majority of glass-forming liquids here exhibit what corresponds to a cut-off in the relaxation time distribution function at long times kre02 ; kud99 ; rol05 . Focusing on the short-time (high-frequency) relaxation properties, at each temperature we identified the minimum slope in the standard log-log plot, , where is frequency and is the base-10 logarithm. This identifies the inflection point above the loss-peak frequency. As illustrated in Fig. 1(a) the number gives the best approximate inverse power-law description of the loss decay above the peak: applies to a good approximation over a significant frequency range. Only data with a well-defined minimum slope or a clear slope plateau were used, and only if there is so little noise in the point-by-point numerical differentiation that data allow a precise determination of . For the data thus selected Fig. 1(b) shows a histogram of the minimum-slope distribution. The above-mentioned limitations as well as the different temperature ranges and intervals used by various groups imply that the number of data sets per liquid varies widely (from 2 to 26). To compensate for this and give equal weight to each liquid in Fig. 1(b), if data sets were included in the analysis for a given liquid, each minimal-slope observation was weighted by a factor for this liquid.
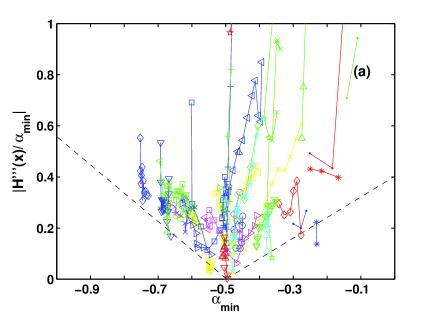
According to the fluctuation-dissipation theorem an high-frequency dielectric loss implies that the dipole time-autocorrelation function for times shorter than the alpha-relaxation time obeys . Thus liquids with exhibit approximate relaxation of the dipole autocorrelation function. An obvious question is whether the observed prevalence of minimum slopes around is a coincidence. If were significant, one would expect that the closer the minimum slope is to , the better an inverse power-law description applies. This is investigated in Fig. 2(a) that plots the third-order derivative relative to the first-order derivative, , where , , and is the log frequency at the point of minimum slope. The idea is that, since the second-order derivative is zero at the frequency of minimum slope, by Taylor’s formula the smaller is, the larger is the frequency range where the slope is almost constant. Figure 2(a) shows that the better an inverse power law describes the loss, the closer is to .
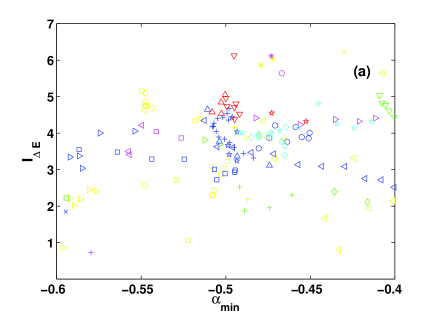
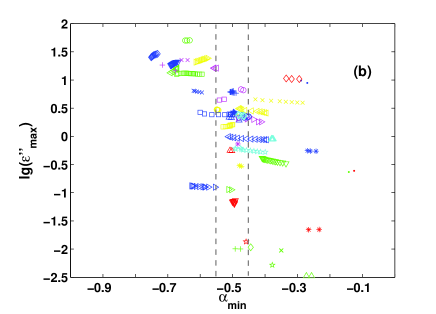
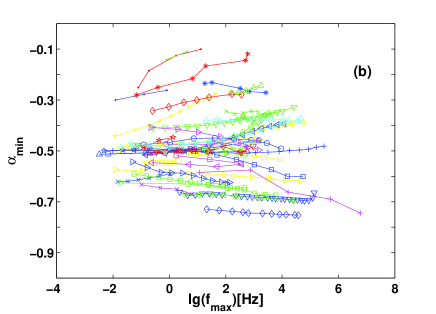
Figure 2(b) plots the minimum slope as a function of temperature represented by the loss-peak frequency . Although not without exceptions, the overall tendency is that the minimum slopes converge slowly to as temperature is lowered ols01 . From Fig. 2 we conclude that the prevalence of relaxation of Fig. 1(b) is hardly coincidental, but reveals a generic property of viscous liquid dynamics. Figure 3 investigates other physical quantities that might correlates with. According to the generally accepted picture, relaxation properties are determined by how much the temperature dependence of a liquid’s relaxation time deviates from the Arrhenius equation. More precisely, if the dipole time-autocorrelation function is fitted by a stretched exponential, , according to the conventional wisdom the larger the liquid fragility is, the lower is boh93 . Since a stretched exponential implies a high-frequency power-law loss varying with frequency as , one expects liquids exhibiting relaxation to have only a narrow range of fragilities. This is tested in Fig. 3(a) where the activation energy temperature index sch98 ; dyr04 is plotted for all data sets with , where the activation energy was identified by writing with s. provides a measure of how non-Arrhenius a liquids is; the connection to the Angell’s fragility is provided dyr04 by . Figure 3(a) shows that liquids with relaxation exhibit a wide range of fragilities.
In Fig. 3(b) we plot the minimum slope versus maximum loss , the latter quantity reflecting the overall dielectric loss strength. Liquids covering more than 4 decades of dielectric strengths are represented in the data set. Liquids with very large dielectric strength show minimum slopes that are consistently larger than numerically. These liquids present an exception to relaxation. The liquids with all have Kirkwood correlation factors that are significantly larger than unity, reflecting strong correlations between the motions of different dipoles. Higher Kirkwood correlation factors promote longer range orientational and dynamical correlations, leading to spatial averaging of what might otherwise still be behavior (in fact, for one expects an approach to Debye relaxation reflecting an increasingly large degree of cooperativity).
In conclusion, these data suggest that, with the exception of very large-loss liquids, relaxation is generic to the alpha process of glass-forming liquids; relaxation is a better approximation, the better an inverse power law describes the high-frequency loss (Fig. 2(a)) and the lower the temperature is (Fig. 2(b)). If approximate relaxation were generic for glass-forming liquids, however, how does one explain the fact that of the data do not obey ? The most likely explanation is that deviations are caused by interference from Johari-Goldstein beta (secondary) relaxation processes with no distinct maximum. Although for many years it was believed that secondary processes are found only in the kHz-MHz frequency range, it is now generally recognized that theses processes in some cases take place at much lower frequencies ols98 ; sch00 . If one or more secondary processes appear in the Hz range, it is practically impossible to separate alpha and beta processes note_2 . – Recently relaxation was reported for the mechanical relaxation of liquids forming bulk metallic glasses wen04 , as well as for the shear-mechanical relaxation of glass-forming organic liquids jak05 . It should be emphasized, however, that mechanical relaxation measurements on highly viscous liquids are much less accurate than dielectric measurements.
Although our findings go against presently prevailing views of viscous liquid dynamics, it is not a new idea that a high-frequency loss varying as is generic to highly viscous liquids. In the 1960’s and beginning of the 1970’s this was, in fact, commonly noted (see, e.g., Ref. wil75 ). Several theories were proposed to explain it, including Glarum’s defect diffusion model gla60 ; dor70 , the “inhomogeneous media” model of Isakovich and Chaban isa66 , the Barlow-Erginsav-Lamb (BEL) model postulating a mechanical equivalent of a simple electrical circuit bar67 , and the Montrose-Litovitz model invoking diffusion and relaxation of some unspecified order mon70 . The idea gradually fell out of favor to be replaced by the presently prevailing view that relaxation functions are basically determined by the fragility boh93 . Our data show a prevalence of relaxation independent of fragility, however. If relaxation is eventually confirmed as generic for the alpha process (excluding high-loss liquids), the dynamics of glass-forming liquids is simpler than generally believed. That presents an obvious challenge to theory.
Acknowledgements.
The authors wish to thank Ernst Rössler, Alois Loidl, and Peter Lunkenheimer for kindly providing their data. This work was supported by a grant from the Danish National Research Foundation (DNRF) for funding the centre for viscous liquid dynamics “Glass and Time.”References
- (1) I. Gutzow and J. Schmelzer, The Vitreous State: Thermodynamics, Structure, Rheology, and Crystallization (Springer, Berlin, 1995).
- (2) M. D. Ediger, C. A. Angell, and S. R. Nagel, J. Phys. Chem. 100, 13200 (1996).
- (3) C. A. Angell, K. L. Ngai, G. B. McKenna, P. F. McMillan, and S. W. Martin, J. Appl. Phys. 88, 3113 (2000).
- (4) E. Donth, The Glass Transition (Springer, Berlin, 2001).
- (5) J. C. Dyre, Rev. Mod. Phys. 78, 953 (2006).
- (6) M. Doi and S. F. Edwards, The Theory of Polymer Dynamics (Oxford University Press, Oxford, 1986).
- (7) W. Wernsdorfer and R. Sessoli, Science 284, 133 (1999).
- (8) W. Wernsdorfer, in Advanced Magnetic Nanostructures, edited by D. J. Sellmyer and R. Skomski (Springer, Berlin, 2006), p. 147.
- (9) O. G. Bakunin, Chaos, Solitons & Fractals 23, 1703 (2005).
- (10) K. K. Mon and J. K. Percus, J. Chem. Phys. 117, 2289 (2002).
- (11) N. B. Olsen, T. Christensen, and J. C. Dyre, Phys. Rev. Lett. 86, 1271 (2001).
- (12) F. Kremer and A. Schönhals (Eds.), Broadband Dielectric Spectroscopy (Springer, Berlin, 2002).
- (13) A. Kudlik, S. Benkhof, T. Blochowicz, T. Tschirwitz, and E. Rössler, J. Mol. Structure 479, 201 (1999).
- (14) C. M. Roland, S. Hensel-Bielowka, M. Paluch, and R. Casalini, Rep. Prog. Phys. 68, 1405 (2005).
- (15) Details on liquids and measurements are provided in: A. I. Nielsen, et al., in preparation.
- (16) Polymers were excluded from the analysis because the polymer glass transition is not a liquid-glass transition.
- (17) H. Huth, L.-M. Wang, C. Schick, and R. Richert, J. Chem. Phys. 126, 104503 (2007).
- (18) R. Böhmer, K. L. Ngai, C. A. Angell, and D. J. Plazek, J. Chem. Phys. 99, 4201 (1993).
- (19) K. U. Schug, H. E. King, and R. Böhmer, J. Chem. Phys. 109, 1472 (1998).
- (20) J. C. Dyre and N. B. Olsen, Phys. Rev. E 69, 042501 (2004).
- (21) N. B. Olsen, J. Non-Cryst. Solids 235, 399 (1998).
- (22) U. Schneider, R. Brand, P. Lunkenheimer, and A. Loidl, Phys. Rev. Lett. 84, 5560 (2000).
- (23) Intuitively one might expect that interference from beta processes can only explain minimum slopes that are numerically smaller than . From measurements on liquids with a well-defined beta process in the kHz range, however, we and many others consistenly find that when the liquid is heated above the temperature where alpha and beta process merges, the high-frequency decay of the “collapsed” alpha-beta process has a minimum slope that is usually numerically larger than . Thus, since whenever there are low-lying beta processes the liquid is unavoidably around or above the alpha-beta merging temperature, might well occur. In other words, “genuine” behavior only appears when the system is significantly below the merging temperature.
- (24) P. Wen, D. Q. Zhao, M. X. Pan, W. H. Wang, Y. P. Huang, Y. P. and M. L. Guo, Appl. Phys. Lett. 84, 2790 (2004).
- (25) B. Jakobsen, K. Niss, and N. B. Olsen, J. Chem. Phys. 123, 234511 (2005).
- (26) G. Williams, in Dielectric and Related Molecular Processes, edited by M. Davies (The Chemical Society, London, 1975), Vol. 2, p. 151.
- (27) S. H. Glarum, J. Chem. Phys. 33, 639 (1960).
- (28) R. H. Doremus, J. Appl. Phys. 41, 3366 (1970).
- (29) M. A. Isakovich and I. A. Chaban, Zh. Eksp. Teor. Fiz. 50, 1343 (1966) [Sov. Phys. JETP 23, 893 (1966)].
- (30) A. J. Barlow, A. Erginsav, and J. Lamb, Proc. R. Soc. London, Ser. A 298, 481 (1967).
- (31) C. J. Montrose and T. A. Litovitz, J. Acoust. Soc. Am. 47, 1250 (1970).