Magnetic Doppler Imaging of Active Stars
Abstract
We present a new implementation of the magnetic Doppler imaging technique, which aims at self-consistent temperature and magnetic mapping of the surface structures in cool active stars. Our magnetic imaging procedure is unique in its capability to model individual spectral features in all four Stokes parameters. We discuss performance and intrinsic limitations of the new magnetic Doppler imaging method. A special emphasis is given to the simultaneous modelling of the magnetically sensitive lines in the optical and infrared regions and to combining information from both atomic and molecular spectral features. These two techniques may, for the first time, give us a tool to study magnetic fields in the starspot interiors.
Department of Astronomy and Space Physics, Uppsala University, SE-751 20, Uppsala, Sweden
1. Introduction
Rotational modulation of the intensity and polarization spectra of active stars offers a unique possibility to reconstruct 2-D maps of the photospheric magnetic fields and temperature spots, thus providing a key constraint for the theoretical modelling of the stellar activity and dynamo. Until now Zeeman Doppler imaging of the active late-type stars (Brown et al. 1991; Hussain et al. 2000; Donati et al. 2003) was based upon a non-simultaneous and greatly simplified interpretation of the average (least-squares deconvolved) Stokes and Stokes spectra. In contrast, detailed and physically consistent methods of the stellar magnetic field mapping have been developed (Piskunov & Kochukhov 2002; Kochukhov & Piskunov 2002) and successfully applied to the high-resolution circular and linear polarization observations of the early-type magnetic stars (Kochukhov et al. 2002, 2004).
Improvements in the observational techniques and instrumentation have recently made it possible to detect polarization signatures inside individual atomic (Petit 2006) and molecular (Berdyugina et al. 2006) lines of the late-type stars. With these observational data in mind, we have developed a new Magnetic Doppler imaging (MDI) code Invers13. This novel tool aims at self-consistent reconstruction of the temperature and magnetic structures in cool active stars. A special property of our magnetic DI procedure is its capability to realistically model individual atomic and molecular lines in all four Stokes parameters simultaneously. Here we describe physical foundations and numerical implementation of our MDI technique. We also present numerical experiments designed to evaluate performance of Invers13.
2. Magnetic Doppler imaging with Invers13
The new MDI code reconstructs iteratively two-dimensional distributions of temperature and three components of the magnetic field vector using high-resolution spectropolarimetric time series recorded in the Stokes and or all four Stokes parameters. Inversions employ the Levenberg-Marquardt minimization procedure and are constrained with the Tikhonov regularization (Piskunov & Kochukhov 2002).
Our modelling of the magnetic field and cool spots is self-consistent, i.e. the local intensity and polarization profiles are computed taking into account the Zeeman effect and the presence of temperature inhomogeneities at the same time. This allows us to deduce correct field strength inside cool spots. In contrast, all previous ZDI methods, that use only the Stokes for magnetic mapping, significantly underestimate magnetic flux in cool spots or fail to detect it altogether.
The magnetic spectrum synthesis is carried out using realistic model atmosphere grids of cool stars (ATLAS9, Phoenix, MARCS). The atomic and molecular concentrations are calculated with the advanced equation of state solver (Valenti et al. 1998). The local Stokes parameters are computed by solving the polarized radiative transfer equation with the quadratic DELO method (Socas-Navarro et al. 2000; Piskunov & Kochukhov 2002).
3. Numerical simulations
Performance of the new MDI code is verified with the numerical experiments. In these tests Invers13 infers temperature and magnetic maps from the simulated observational data in two or four Stokes parameters. For all tests presented here we used the stellar parameters K, , km s-1, . We assumed the temperature contrast of 1500 and 750 K for the umbral and penumbral starspot regions, respectively. The magnetic field strength was set to 2 kG in the center of a spot, reducing to 1 kG in the penumbra. Simulations were performed for the three optical magnetically sensitive Fe i lines at 5497.5, 5501.5, 5506.8 Å, two IR lines Fe i 15648.5, 15652.9 Å, and the TiO bandhead at 7055 Å.
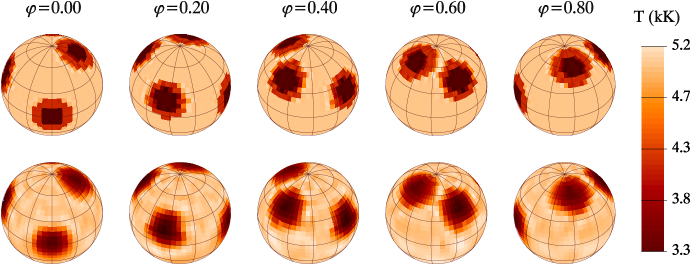
In the first simulation described here we studied the capability of Invers13 to infer temperature contrast of cool starspots. Fig. 1 shows reconstruction of the temperature distribution consisting of four spots located at different latitudes. For these large-scale features the spot-to-photosphere temperature contrast is underestimated by no more than 200–300 K even when we use only the Fe i lines around 5000 Å. The temperature reconstruction is improved (errors reduced to 50–100 K) if the TiO band or the IR lines are included in the inversion.
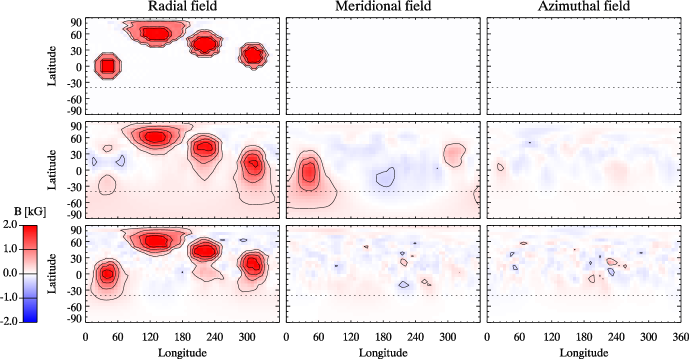
In the second series of tests we have performed magnetic inversions for large, purely magnetic spots containing radial, meridional and azimuthal field. Inversion for the case of radial magnetic topology is illustrated in Fig. 2. It is evident that the radial field is successfully recovered for the high- and intermediate-latitude spots. At the same time, a strong radial to meridional field crosstalk occurs for the low-latitude spots in the Stokes imaging. This problem is alleviated when linear polarization data are included in the magnetic inversion.
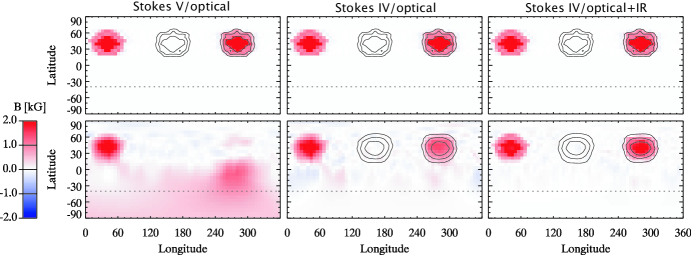
Finally, we have tested possibility to probe magnetic fields inside cool starspots. In Fig. 3 we illustrate the adopted structure of the temperature and magnetic inhomogeneities and show results of different magnetic inversions. We find that if the magnetic field is studied using the Stokes alone, without accounting for the temperature inhomogeneities (as it is done in all previous implementations of ZDI), the resulting map misses entirely the magnetic flux in the regions of reduced temperature. On the other hand, our standard MDI reconstruction based on the self-consistent interpretation of the Stokes and spectra recovers correctly the geometry of the field, although the field strength is underestimated by about 50% in the starspot center. The agreement between the true and reconstructed maps can be improved significantly if the IR Fe i lines are incorporated in the inversion. This becomes possible due to a much smaller spot-to-photosphere flux contrast in the IR and the resulting larger relative contribution of the spot polarization signatures to the disk-integrated Stokes spectra. The polarization diagnostic of the TiO molecular bands allows us to achieve similar improvement in the magnetic mapping of the starspot regions, although the MDI with molecular lines suffers from reduced spatial resolution due to a large width of molecular features. However, the main advantage of the simultaneous analysis of molecular and atomic lines is the possibility to use the same observational material for the inversion, whereas costly multisite campaigns are needed to secure simultaneous visual and IR high-resolution spectra.
References
- Berdyugina et al. (2006) Berdyugina, S.V., Petit, P., Fluri, D.M., Afram, N., & Arnaud, J. 2006, in ASP Conf. Ser. 358, Solar Polarization 4, eds. R. Casini, B.W. Lites, (San Francisco: ASP), 381
- Brown et al. (1991) Brown, S.F., Donati, J.-F., Rees, D.E., & Semel, M. 1991, A&A, 250, 463
- Donati et al. (2003) Donati, J.-F., Collier Cameron, A., Semel, M., et al. 2003, MNRAS, 345, 1145
- Hussain et al. (2000) Hussain, G.A.J., Donati, J.-F., Collier Cameron, A., & Barnes, J.R. 2000, MNRAS, 318, 961
- Kochukhov & Piskunov (2002) Kochukhov, O., & Piskunov, N. 2002, A&A, 388, 868
- Kochukhov et al. (2002) Kochukhov, O., Piskunov, N., Ilyin, I., Ilyina, S., & Tuominen, I. 2002, A&A, 389, 420
- Kochukhov et al. (2004) Kochukhov, O., Bagnulo, S., Wade, G.A., Sangalli, L., Piskunov, N., Landstreet, J.D., Petit, P., Sigut, T.A.A. 2004, A&A, 414, 613
- Petit (2006) Petit, P. 2006, in ASP Conf. Ser. 358, Solar Polarization 4, eds. R. Casini, B.W. Lites, (San Francisco: ASP), 335
- Piskunov & Kochukhov (2002) Piskunov, N., & Kochukhov, O. 2002, A&A, 381, 736
- Socas-Navarro et al. (2000) Socas-Navarro, H., Trujillo Buen, J., & Ruiz Cobo, B. 2000, ApJ, 530, 977
- Valenti et al. (1998) Valenti, J., Piskunov, N., & Johns-Krull, C.M. 1998, ApJ, 498, 851