A2163: Merger events in the hottest Abell galaxy cluster
Abstract
Context. A2163 is among the richest and most distant Abell clusters, with outstanding properties in different wavelength domains. X-ray observations have revealed a distorted morphology of the gaz and strong features have been detected in the temperature map, suggesting that merging processes are important in this cluster. However, the merging scenario is not yet well–defined.
Aims. We therefore undertook a complementary optical analysis, aiming to understand the dynamics of the system, to constrain the merging scenario and to test its effect on the properties of galaxies.
Methods. We present a detailed optical analysis of A2163 based on new multicolor wide–field imaging and the medium–to–high resolution spectroscopy of galaxies.
Results. The projected galaxy density distribution shows strong subclustering with two dominant structures: a main central component (A), and a northern component (B), visible both in optical and in X-ray, while other substructures are detected in the optical. At magnitudes fainter than R=19, the galaxy distribution shows a clear elongation approximately on the east–west axis extending over Mpc, while a nearly perpendicular bridge of galaxies along the north–south axis appears to connect (B) to (A). The (A) component shows a bimodal morphology, and the positions of its two density peaks depend on galaxy luminosity: when going to magnitudes fainter than , the axis joining the peaks shows a counterclockwise rotation (from NE/SW to E–W) centered on the position of the X-ray maximum. Our final spectroscopic catalog of 512 objects includes 476 new galaxy redshifts. We have identified 361 galaxies as cluster members; among them, 326 have high precision redshift measurements, which allow us to perform a detailed dynamical analysis of unprecedented accuracy. The cluster mean redshift and velocity dispersion are respectively and km/s. We spectroscopically confirm that the northern and western components (A2163-B and A2163-C) belong to the A2163 complex. The velocity distribution shows multi-modality, with a bimodal structure peaking at km/s and km/s. A significant velocity gradient ( km/s) is detected along the NE/SW axis of the cluster, which partially explains the detected bimodality. A2163 appears to be exceptionally massive: the cluster virial mass is .
Conclusions. Our analysis of the optical data, combined with the available information from X-ray observations and predictions of numerical simulations, supports a scenario in which A2163-A has undergone a recent (Gyr) merger along a a NE/SW (or E–W) axis, and A2163-B is connected to the main complex, probably infalling on A2163-A.
Key Words.:
galaxies:clusters, galaxies: kinematics and dynamics1 Introduction
A2163 is among the richest (richness class 2 as Coma) and most distant Abell clusters () and presents outstanding properties at various wavelengths. Extensive X–ray observations have shown that A2163 is the hottest Abell cluster (temperature estimates vary between 11.5 and 14.6 keV; Arnaud et al. 1992; Elbaz et al. 1995; Markevitch et al. 1996; Markevitch & Vikhlinin 2001; Pratt, Arnaud & Aghanim 2001) and among the most luminous ones ( ergs/s, Ginga+ROSAT/PSPC, Elbaz et al. 1995). The clear subclustering in the ICM density map (Elbaz et al. 1995), in particular the presence of a secondary cluster in the North (A2163B in Elbaz et al. 1995) and the rotation of the main cluster isophotes with radius, together with strong temperature variations in the central region (Markevitch and Vikhlinin 2001, Bourdin et al. 2001, Govoni et al. 2004) are typical signatures of merging processes. Nevertheless, the surface brightness profile of the cluster is well fitted by a -model (Elbaz et al., 1995; Pratt et al. 2001) and the temperature profile was shown to be relatively flat outside the very center (Pratt et al. 2001). The binding mass, derived from X-ray observations under the isothermal hypothesis, is very large: within a radius of Mpc (Elbaz et al. 1995, assuming a cosmology with km s-1 Mpc-1, ).
The galaxy density and mass distribution in the central region of this cluster have also been determined by weak gravitational lensing (Squires et al. 1997, Cypriano et al. 2004). These analyses show very similar mass and galaxy distributions, with two coincident maxima and a flat shape elongated in the E-W direction, but the weak lensing signal is surprisingly faint in comparison to what could be expected from the cluster X-ray properties. However, these detailed studies are limited to the inner 8’8’ region of the cluster, and do not include the peripheral clumps such as A2163-B. La Barbera et al. (2004) estimated the photometric redshifts of galaxies in A2163-B, showing that this structure lies at the typical redshift of the main cluster ().
The available optical and X-ray results suggest that A2163 is not a completely relaxed cluster, as shown both by signatures of a merging event in the central region, and by the presence of A2163-B, which is a possible interacting subcluster in the North, at 7 arcmin from the peak of X-ray emission. Radio observations (Feretti et al. 2001) revealed both an elongated and diffuse source (a possible relic) in the N-E peripheral region of A2163, and, above all, one of the most powerful and extended halos ever detected, which is quite regular in shape and elongated in the E-W direction, similarly to the X-ray emission. Further analysis has shown that the spectral index map of the halo is flatter in a region elongated along the N–S direction and crossing the cluster centre, and at the northern and southern boundaries of the halo (Feretti et al. 2004). While the physical processes generating radio halos are still not clarified, several studies have shown that these objects are preferentially found in rich X-ray bright clusters (Giovannini et al. 2002), and the mechanism of formation is probably connected to cluster mergers (Brunetti et al. 2003, Govoni et al. 2004, Feretti 2006, Ferrari et al. 2008). A better understanding of the merging scenario in A2163 will hopefully also shed some light on the formation of its radio halo and on the origins of its clumpy spectral map.
This work is part of a more general program aiming at reconstructing the merging scenario(s) of Abell 2163 through a combined large-scale optical/X-ray analysis, and test the relation between the merging event and the properties of the galaxies and of the gas. Recent analyses of merging clusters combining a high number of redshifts to X-ray and/or radio data have brought significant insight in the understanding of these complex systems (for a non exhaustive list, see for instance Quintana et al. 1996, Biviano et al. 1996, Maurogordato et al. 2000, Arnaud et al. 2000, Flores et al. 2000, Bardelli et al. 2001, Czoske et al. 2002, Ferrari et al. 2003, Ferrari et al. 2005, Miller et al. 2004, Ledlow et al. 2005, Miller et al. 2006, Boschin et al. 2004, Girardi et al. 2005, Boschin et al. 2006, Girardi et al. 2006, Barrena et al. 2007). In this paper we present the results obtained from the analysis of our optical observations carried out in 2004 and 2006 at ESO, including wide-field multi-band imaging with the Wide Field Imager on the 2.2m telescope, high resolution (R ) spectroscopy obtained with the VIMOS Spectrograph at the VLT/UT3 telescope, and former spectroscopy obtained at CFHT with the MOS instrument at lower resolution. This paper will be followed by an analysis of the X-ray observations with XMM and Chandra focused on the signature of the merging process in the temperature maps, and by the study of the star formation history of cluster members with respect to the merging event.
In Section 2 we present the data and the reduction procedure. Section 3 focuses on the projected density distributions of the galaxies and of the gas and their comparison through the determination of isodensity maps and projected density profiles. We analyse the velocity distribution and the dynamics for the whole cluster in Section 4, and the existence of subclustering both in density and velocity space in Section 5. In Section 6 we derive an estimate of the cluster mass and compare it to independent X-ray and weak-lensing estimates. Discussion and conclusions are presented in Section 7.
In the following, we adopt the cosmological parameters of a CDM model with =0.3, =0.7 and . With these parameters, at one degree corresponds to a physical length of Mpc.
2 Observations and data reduction
2.1 Data acquisition and reduction
Our observations were carried out at ESO in 2004 (run 073.1-0672) and 2006 (run 077.A-0813). We also used additional unpublished data from spectroscopic observations at lower resolution obtained at CFHT by Soucail and collaborators in 1996 (see below). A2163 was observed with the Wide Field Imager at the ESO 2.2m telescope and with the VIMOS (VIsible Multi–Object Spectrograph; Le Fèvre et al. 2000) at the Melipal UT3 telescope of the ESO VLT. Imaging of the central 30’x30’ field has been performed in the R (filter ESO/878) and V (filter ESO/843) bands. For each filter eight dithered images were obtained, leading to a total exposure time of 40 mn. The seeing FWHM values of the R and V band images amount to 1.25 and 1.40 arcsec, respectively.
These sets of images were reduced and combined using the ESO/MVM package (Alambic, Vandame et al. 2002), and the galaxy catalogs in the two passbands were extracted with SExtractor (Bertin and Arnouts, 1996). These catalogs include half-light radii and magnitudes (we adopted the MAGAUTO estimate), and the resulting magnitude–half light radius diagram was used to classify stars and galaxies, up to a magnitude of 21 in both bands. The limiting magnitudes, defined as detections within an aperture of twice the seeing FWHM, are 22.5 and 21.5 in the R- and V-bands, respectively. Finally, the V- and R-band catalogs were matched by adopting a matching radius of 1.5 arcsec.

For multi–object spectroscopy, masks were prepared through the VMMPS (VIMOS Mask Preparation Software, Bottini et al. 2005). Spectra were obtained in the 30’x30’ field covered by WFI, with VIMOS in Multi-Object Spectroscopy mode. We used the High Resolution Blue grism, with a slit of 1” width, which leads to a resolution in the range [2050-2550] and covers the wavelength range Å for a centered slit. At the cluster redshift this range includes [OII], K and H, G band, , ,, [OIII]a&b among the main spectral lines. About slits per pointing were assigned to targets, and the field was covered with six pointings (four obtained in 2004 and two in 2006) following a dithering pattern, in order to fill the cross-shaped gap (2’ wide) among the 4 VIMOS quadrants. For each pointing, we obtained four exposures of 45 mn. The prereduction of spectroscopic data was performed with the dedicated VIPGI package (Scodeggio et al. 2005). Finally, redshifts were measured through the standard cross-correlation package rvsao in IRAF (Tonry and Davis, 1981), using three stellar template spectra obtained during our observing runs and a set of synthetic spectra derived from the population synthesis library of Bruzual & Charlot (2003). All the spectra were checked visually for the presence of [OII], [OIII], and Balmer lines in emission with equivalent widths larger than 5Å, and in case of positive detection the emission lines redshifts were measured. For galaxies where both absorption and emission redshifts were available, we selected the value with lower error. Redshifts are heliocentric (in our case the heliocentric correction is small, amounting to km/s).
Objects were classified in two categories according to the quality of the spectra, and thereby to the precision of the derived redshifts: a) the “high precision” sample (Flag 0), including galaxies having high S/N ratio spectra ( per pixel or higher) and typical redshift errors of km/s; b) the “medium precision” sample (Flag 1), including galaxies having lower S/N ratio spectra but still reliable redshifts with larger errors ( km/s). Examples of flag 0 spectra are displayed in Fig.1. The dynamical analysis was generally performed on the high precision spectroscopic sample; the total sample was used when the redshift precision was not critical (e.g. when associating galaxies to the cluster in the color-magnitude diagram for the best determination of the red sequence).
As we mentioned above, we dispose also of supplementary data coming from multi-object spectroscopy obtained at CFHT with the MOS instrument (PI: G. Soucail), where the grism had a dispersion of 300 Å/mm, giving a wavelength scale of 7 Å per pixel on the CCD in a binned mode and a maximum wavelength range of 4400 to 8000 Å. Due to the lower spectral resolution of CFHT observations, these objects have Flag 1. CFHT observations provided 108 spectra and 79 galaxies belonging to the cluster were identified: 51 of them were also observed with VIMOS. After applying a 3 clipping, the mean offset in velocity is km/s, which is within the mean errors from the CFHT measurements. When both measurements were available, we chose the higher precision VIMOS measurement. At the end, 28 objects were added from the CFHT observations. Therefore our final spectroscopic catalog includes 512 spectra with a successful radial velocity measurement. 476 of them are galaxies: 430 have a “high precision” and 46 have a “medium precision” redshift.
The catalog is shown in Table LABEL:Table_redshifts, where colums are as follow: 1) identification number; 2) and 3) right ascension and declination (J2000.0); 4) radial velocity; 5) velocity error; 6) parameter (Tonry and Davis 1981; when the cross-correlation redshift can be considered as reliable); 7) quality flag for the redshift (0: high precision, 1: medium precision); 8) emission lines flag (0: no emission, 1: with emission); 9) instrument (1: VIMOS at ESO/VLT; 2: MOS at CFHT).
1
| Galaxy | Right Ascension(J2000) | Declination (J2000) | v (km ) | (km ) | Flag | Emission | Run | |
| (1) | (2) | (3) | (4) | (5) | (6) | (7) | (8) | (9) |
| 1 | 16 14 53.88 | -06 09 00.4 | 100970 | 50 | 5.1 | 0 | 1 | 1 |
| 2 | 16 14 54.15 | -06 06 08.3 | 63576 | 32 | 8.6 | 0 | 1 | 1 |
| 3 | 16 14 58.18 | -06 00 44.9 | 126845 | 71 | 3.4 | 0 | 1 | 1 |
| 4 | 16 14 58.59 | -06 08 01.8 | 62075 | 8 | 18.2 | 0 | 0 | 1 |
| 5 | 16 14 58.65 | -06 14 34.4 | 62851 | 14 | 9.7 | 0 | 0 | 1 |
| 6 | 16 14 59.21 | -06 05 55.4 | 59068 | 29 | 6.0 | 0 | 1 | 1 |
| 7 | 16 15 00.26 | -06 15 16.5 | 57805 | 11 | 14.5 | 0 | 0 | 1 |
| 8 | 16 15 00.84 | -06 18 59.4 | 60983 | 14 | 8.9 | 0 | 0 | 1 |
| 9 | 16 15 00.87 | -06 07 02.0 | 52493 | 59 | 6.5 | 0 | 1 | 1 |
| 10 | 16 15 01.03 | -06 17 46.4 | 59140 | 11 | 20.6 | 0 | 0 | 1 |
| 11 | 16 15 01.86 | -06 02 47.1 | -89 | 8 | 14.8 | 0 | 0 | 1 |
| 12 | 16 15 02.18 | -06 07 57.4 | -86 | 14 | 11.7 | 0 | 0 | 1 |
| 13 | 16 15 03.34 | -06 10 32.9 | 37716 | 11 | 14.3 | 0 | 0 | 1 |
| 14 | 16 15 03.38 | -06 09 55.8 | 75970 | 17 | 19.8 | 0 | 1 | 1 |
| 15 | 16 15 03.54 | -06 01 25.6 | -71 | 11 | 11.9 | 0 | 0 | 1 |
| 16 | 16 15 03.65 | -06 05 16.7 | 73835 | 14 | 11.4 | 0 | 0 | 1 |
| 17 | 16 15 03.67 | -06 20 15.0 | 100610 | 20 | 8.7 | 0 | 0 | 1 |
| 18 | 16 15 03.91 | -06 05 40.4 | 73697 | 17 | 13.6 | 0 | 1 | 1 |
| 19 | 16 15 03.99 | -06 02 29.1 | 61148 | 11 | 18.0 | 0 | 0 | 1 |
| 20 | 16 15 04.02 | -06 15 46.9 | 62845 | 128 | 3.2 | 1 | 1 | 1 |
| 21 | 16 15 04.05 | -06 14 19.9 | 61928 | 11 | 13.1 | 0 | 0 | 1 |
| 22 | 16 15 04.92 | -06 13 53.8 | 58984 | 5 | 27.4 | 0 | 0 | 1 |
| 23 | 16 15 05.41 | -06 02 46.6 | -23 | 17 | 10.1 | 0 | 0 | 1 |
| 24 | 16 15 05.50 | -06 09 23.9 | 49627 | 47 | 6.5 | 0 | 1 | 1 |
| 25 | 16 15 05.95 | -06 11 17.3 | 60414 | 8 | 23.9 | 0 | 0 | 1 |
| 26 | 16 15 06.14 | -06 00 33.9 | 79684 | 32 | 6.0 | 0 | 1 | 1 |
| 27 | 16 15 06.56 | -05 59 46.8 | 79606 | 47 | 5.6 | 0 | 1 | 1 |
| 28 | 16 15 06.61 | -06 00 28.7 | 79534 | 23 | 8.9 | 0 | 1 | 1 |
| 29 | 16 15 07.06 | -06 03 12.6 | 34296 | 38 | 8.5 | 0 | 1 | 1 |
| 30 | 16 15 08.11 | -06 14 14.9 | 80 | 11 | 14.8 | 0 | 0 | 1 |
| 31 | 16 15 08.48 | -06 14 00.3 | 58012 | 20 | 13.3 | 0 | 0 | 1 |
| 32 | 16 15 09.02 | -06 19 13.8 | 58984 | 11 | 12.7 | 0 | 0 | 1 |
| 33 | 16 15 09.17 | -06 11 13.7 | 76042 | 38 | 10.8 | 0 | 1 | 1 |
| 34 | 16 15 09.17 | -06 15 27.6 | 57680 | 11 | 12.3 | 0 | 0 | 1 |
| 35 | 16 15 09.19 | -06 00 50.1 | -74 | 11 | 14.2 | 0 | 0 | 1 |
| 36 | 16 15 09.30 | -06 17 28.4 | 59038 | 8 | 23.4 | 0 | 0 | 1 |
| 37 | 16 15 09.69 | -06 01 09.6 | 9173 | 62 | 3.8 | 1 | 0 | 1 |
| 38 | 16 15 09.80 | -06 10 32.7 | 60806 | 11 | 18.8 | 0 | 0 | 1 |
| 39 | 16 15 09.84 | -06 11 23.7 | 62093 | 14 | 10.4 | 0 | 0 | 1 |
| 40 | 16 15 09.90 | -06 06 49.0 | 59098 | 20 | 8.9 | 0 | 0 | 1 |
| 41 | 16 15 10.79 | -06 02 38.1 | 73754 | 20 | 12.1 | 0 | 1 | 1 |
| 42 | 16 15 10.79 | -06 01 46.2 | 73230 | 29 | 6.2 | 0 | 0 | 1 |
| 43 | 16 15 10.94 | -06 05 03.7 | 129285 | 17 | 11.3 | 0 | 0 | 1 |
| 44 | 16 15 11.84 | -05 59 29.1 | 46527 | 29 | 2.7 | 0 | 1 | 1 |
| 45 | 16 15 12.03 | -06 00 19.9 | 74042 | 23 | 9.3 | 0 | 1 | 1 |
| 46 | 16 15 12.07 | -06 05 27.6 | 60423 | 20 | 8.5 | 0 | 0 | 1 |
| 47 | 16 15 12.09 | -06 17 20.1 | 83306 | 11 | 15.7 | 0 | 0 | 1 |
| 48 | 16 15 12.12 | -06 08 32.5 | 60063 | 8 | 23.4 | 0 | 0 | 1 |
| 49 | 16 15 12.18 | -06 04 03.4 | 61769 | 8 | 27.6 | 0 | 0 | 1 |
| 50 | 16 15 12.44 | -06 07 25.2 | 59224 | 53 | 5.2 | 0 | 1 | 1 |
2.2 Completeness
Apparent magnitudes were transformed to absolute ones following: , where is the luminosity distance in Mpc, is the galactic extinction, and is the K-correction. We note that A2163 is in a region with strong local variations of the extinction, and that the estimate of the extinction by Schlegel et al. (1998) differs from that of Burstein and Heiles (1984). For this region La Barbera et al. (2004) have found a value for E(B-V) of 0.41, in good agreement with that of Schlegel et al. (1998), which we adopted in our work. We computed the K-correction corresponding to an elliptical galaxy at for the set of adopted filters; in the (AB) passband, assuming a Schechter (Popesso et al. 2005), we expect = 18.1. As the limiting magnitude of our catalog is , this means that we observe galaxies which are 4.4 magnitudes fainter than . Moreover, the total field covered by the WFI camera (30’x30’) corresponds to xMpc2 at the mean redshift of the cluster. Thus we have both a deep and wide sampling of the galaxy population in A2163.

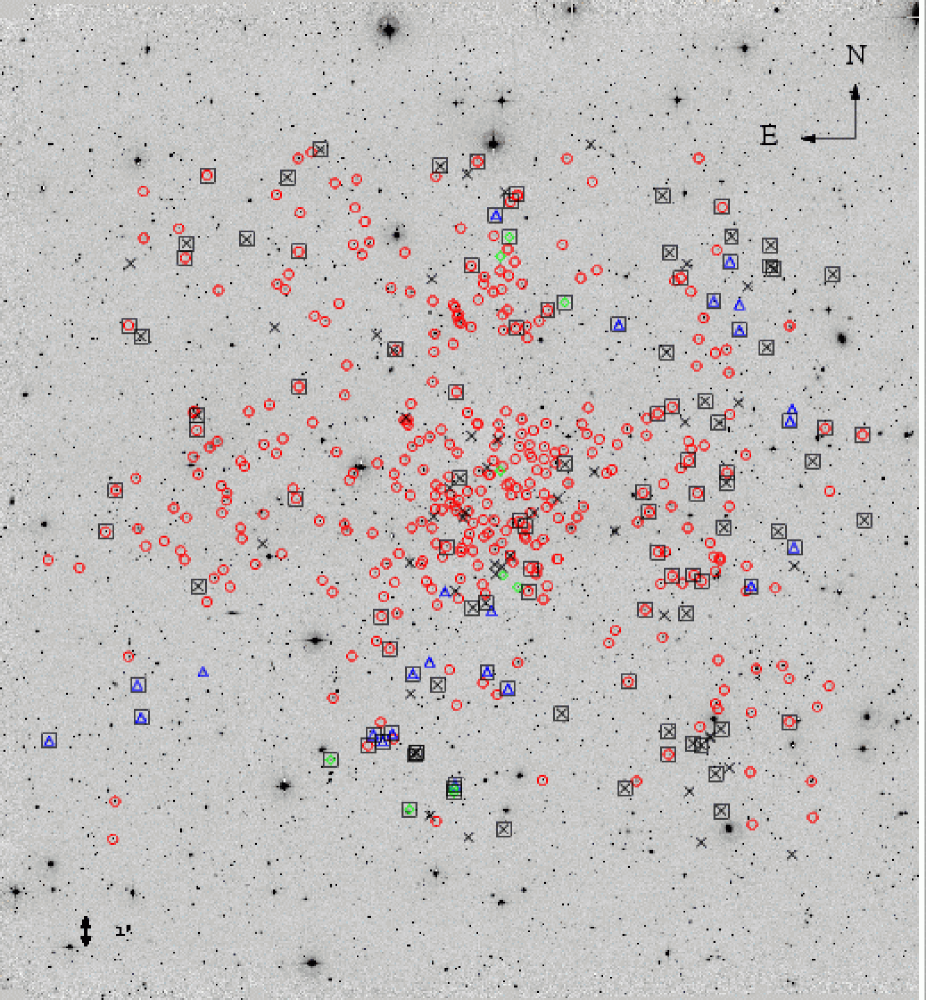
The original scope of the program was to obtain spectra of all the galaxies brighter than in the 20’x20’ region centered on A2163, in order to sample the cluster population to luminosities , and to a radius of . Due to our dithering pattern and to the field of VIMOS (16’x18’), the total field covered by spectroscopy is slightly wider (’ x 35’), but the spectroscopic completeness in the external parts is low. Therefore we limit the completeness analysis to the original 20’x20’ region. Fig. 2 shows the the WFI R-band image of A2163 with symbols identifying the galaxies which have a measured redshift (Flag0+ Flag1). We have computed the spectroscopic completeness , where is the number of galaxies with a measured redshift and magnitude brighter than , and is the number of galaxies in our photometric catalog with magnitude brighter than R. Fig. 3 shows for our two spectroscopic catalogs, the high precision and total sample, corresponding respectively to Flag 0 and Flag 0 + Flag 1 objects in Table LABEL:Table_redshifts. Completeness has been computed in two fields: the inner (8’x8’) and the wider (20’x20’). As a general trend, the wide-field completeness is stable up to and rapidly drops at higher magnitudes. In particular, the central field is highly sampled: the completeness ratio at is between 0.63 and 0.75 for the total (Flag 0 + Flag 1) sample and between 0.55 and 0.62 for the high precision (Flag 0) sample.
Fig.4 shows how the completeness at and varies in the 20’x20’ central field; the completeness is computed in cells of 2’x2’. It is clear that at both magnitudes some regions in the periphery are very poorly, or even not sampled (such as for instance the South-East and North-East corners). The main reason is due to technical problems during observations in service mode. As we have previously explained, we covered the “blind cross” among the 4 VIMOS quadrants through a dithering pattern: because of the technical problems this pattern was not completed, as apparent from the dark pixels in the completeness map. On the other hand, some regions are very well sampled, such as the central 8’x8’ core (except in its North-West and South-West corners). Sampling is not only higher but also more homogeneous at than at , in particular in the central region.
3 Density distribution of galaxies
3.1 Projected isodensity maps
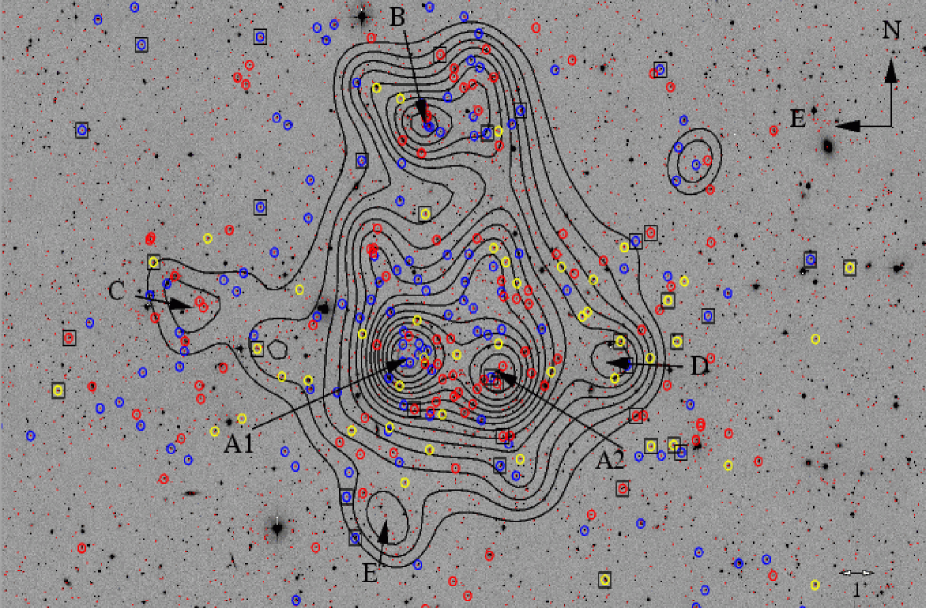
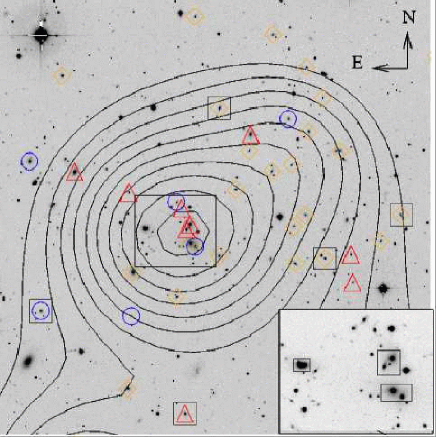
The projected density distribution of galaxies has been computed from the photometric galaxy catalog in the R band through the multi-scale algorithm of Slezak et al. (in prep., see also Fadda, Slezak and Bijaoui 1998 and Ferrari et al. 2005 for a description of the algorithm). Density maps for different cuts in the R magnitude (from to , and for ) are shown in Fig.5 (top panel), where at each scale only structures which are above the background are visualized. The density map is superimposed to the WFI image in Fig.6, where the most significant substructures are identified. A visual inspection of the isodensity maps at the different magnitudes cut-offs reveals a main, central component (A), while at larger distances there are a variety of substructures, the most significant one lying at arcmin North (B), and another one, less prominent, located at arcmin East of the center (C). These three components are visible at all magnitude cut-offs. At and fainter cut-offs, new substructures are visible, such as (D) which is arcmin to the west of the centroid, and (E) which is arcmin to the south of it. Other smaller substructures in the nearby periphery of the main subcluster (A) depend on the magnitude cut-off and might be spurious. substructures. We note however the presence of two substructures, more prominent at fainter magnitudes, to the northern periphery of the main subcluster (A). At faint magnitudes (), a bridge of faint galaxies connects the main subcluster (A) to the northern subcluster (B). There is also a long, low density structure extending in the E–W direction, and including D, the main subcluster A and C.
The inner structure of A changes significantly with luminosity: it has an elongated shape and is bimodal, with two main components (A1 and A2 in Fig. 5) visible at all magnitudes. However, when including fainter objects, the position of A1 and A2 changes, with a counterclockwise twisting of the axis joining them: at R19 the two density peaks are aligned along a NE/SW direction, but at fainter limiting magnitudes (R and R), A1 and A2 are lying on the (E–W) large-scale axis of the cluster. The angular separation of the two peaks is 2 arcmin (3.5 arcmin) in the case of bright (faint) objects. The coordinates of these maxima as a function of magnitude are listed in Table 2.
The projected density distribution of the second main component, A2163-B, also varies with magnitude. At it has a regular, circular shape but at fainter magnitudes it becomes more elongated,with two tails extending in the NE and NW directions, respectively.
On large scales, two main directions clearly appear at fainter magnitudes: an E–W axis, corresponding to the large-scale orientation of the main component A, and including also the C and D substructures, and a N–S axis, joining the northern subcluster B, the main component A, and the E substructure.
| subcluster | Limiting Rmag | R.A.(J2000) | Dec(J2000) |
|---|---|---|---|
| A1 | R 19 | 16 15 47.8 | -06 08 11 |
| A2 | R19 | 16 15 42.5 | -06 09 53 |
| B | R19 | 16 15 48.8 | -06 02 21 |
| C | R19 | 16 16 22.8 | -06 06 17 |
| D | R19.5 | 16 15 27.9 | -06 09 18 |
| A1 | R21 | 16 15 50.9 | -06 08 29 |
| A2 | R21 | 16 15 39.3 | -06 09 15 |
| X-ray (main) | - | 16 15 46.0 | -06 08 55 |
| X-ray (North) | - | 16 15 48.0 | -06 02 25 |
| Name | R.A.(J2000) | Dec(J2000) | R | vel(km/s) | error(km/s) | PA |
|---|---|---|---|---|---|---|
| BCG-1 | 16 15 48.9 | -06 08 41 | 16.86 | 60361 | 10 | 5. |
| BCG-2 | 16 15 33.5 | -06 09 16 | 16.45 | 60006 | 13 | -9. |
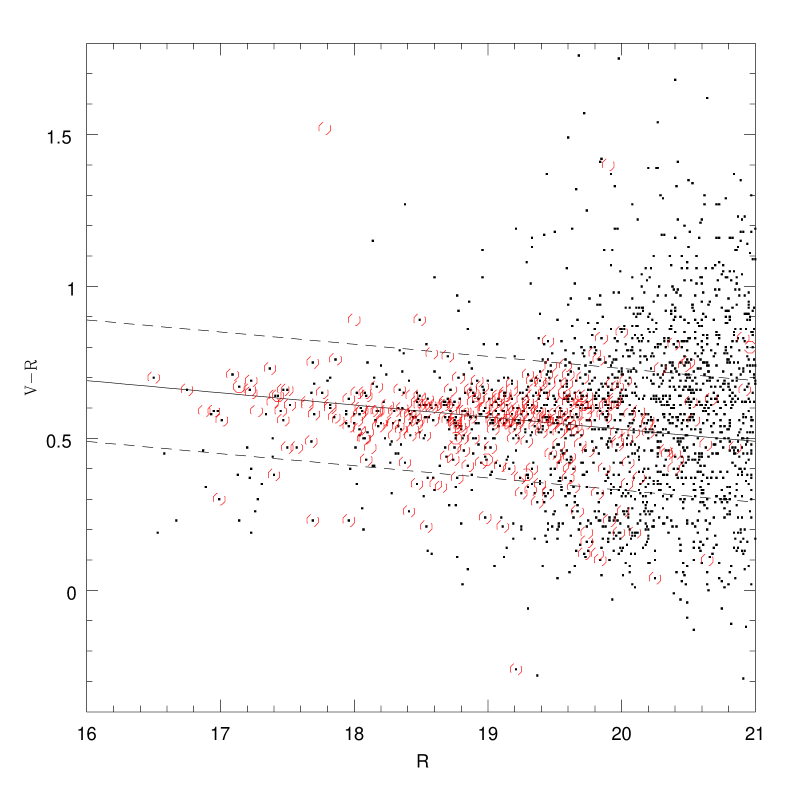
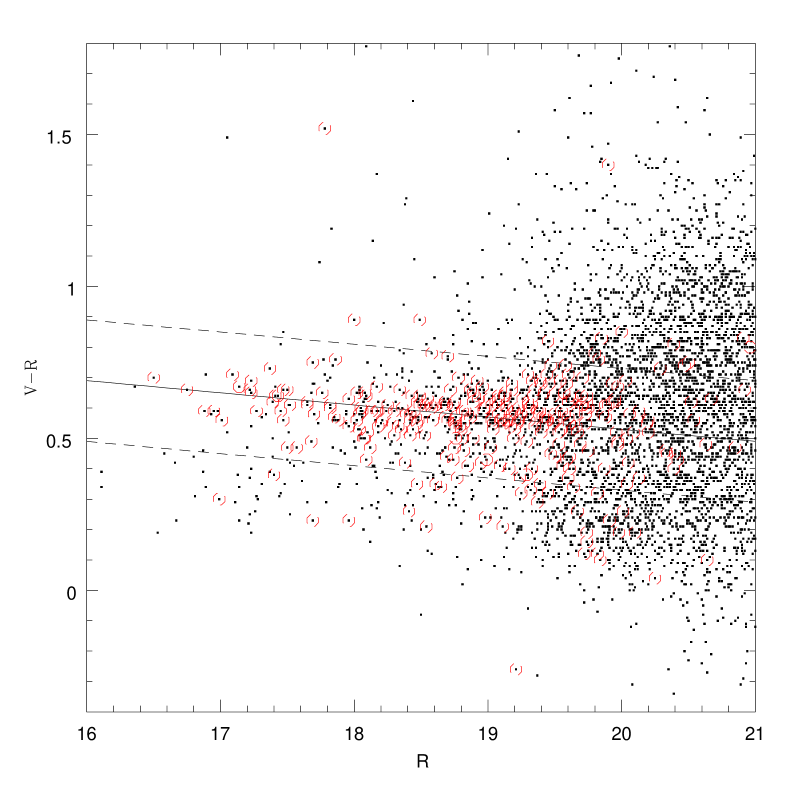
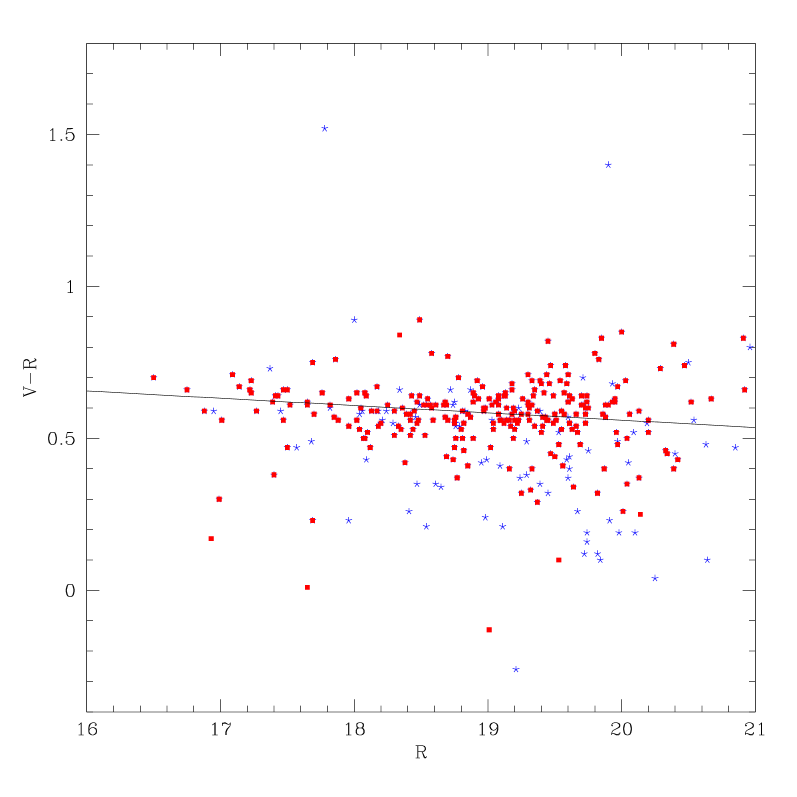
In order to better isolate the cluster population of early type galaxies, we used our photometric data to construct the color-magnitude diagram and to identify the red sequence of A2163. The resulting density map has the advantage to be mostly decontaminated from projection effects, and it can be considered as more representative of the cluster density map (it will obviously miss eventual concentrations dominated by objects with late–type or peculiar colors). We have plotted the (V-R) versus R diagram of galaxies: a) in the central region (Fig.7, top panel); b) in the whole field covered by WFI (Fig.7, bottom panel); c) with velocities within the cluster range (Fig.8). In all diagrams the red sequence is clearly visible at (with an obvious higher dispersion when including the whole field). In order to parametrize the red sequence (hereafter RS), we have used the robust fitting method introduced by Lopez-Cruz et al. (2004). We have fixed the magnitude cut-off at R=20, which corresponds to at the cluster redshift. We have found that the values found by the minimization for the slope and the intercept for the different subsamples are very stable.
We have finally fitted the RS selecting only the “redshift confirmed” cluster members as defined in section 4. The color–magnitude diagram of this sample is shown in Fig.8, both for emission line (blue symbols) and no emission line (red symbols) galaxies. Emission line galaxies were also excluded from the fit as they are not expected to populate the RS. In conclusion, the best fit parameters for the RS relation of this subsample are: and , with a value of 0.10.
In order to construct the projected density distribution of the cluster, we selected all galaxies (with and without a measured redshift) within from the RS best fit, assuming that they are early–type cluster members (see Fig.7).
The density maps are displayed in Fig. 5 (bottom panels). The overall morphology of the cluster is globally unchanged, showing the main central cluster A2163-A and the northern subcluster A2163-B. The density contrast of A2163-A is enhanced in the red sequence (hereafter RS) density maps. However, this is not the case for the smaller clumps: while A2163-E is still visible, A2163-C and A2163-D are hardly distinguishable. We have indeed verified that several galaxies in C and D still follow the cluster red sequence, but with a somewhat larger dispersion than that found for galaxies in the cluster central region. We conclude that the clumps C, D and E all belong to the A2163 complex, and that their galaxy population includes both bright early type RS galaxies and fainter objects with colours outside the red sequence.
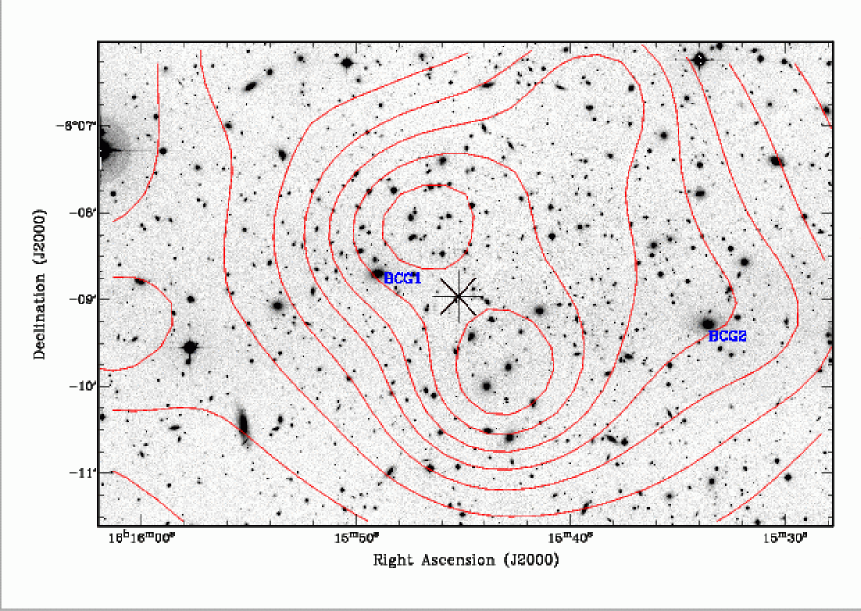
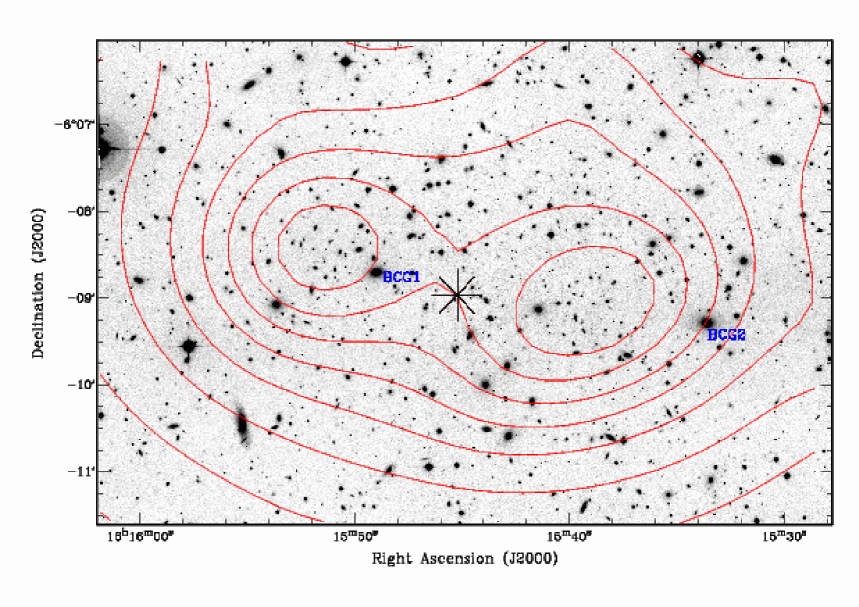
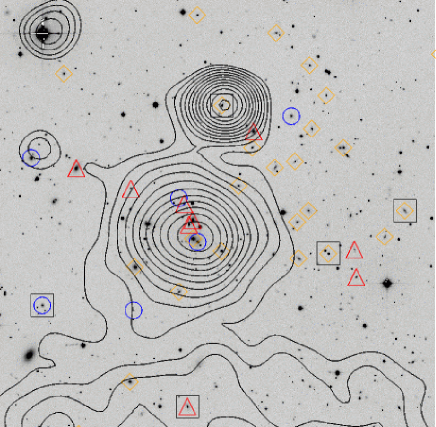
In Fig. 9, the optical isodensity contours for the RS galaxies with R19 (top) and R20 (bottom) are superimposed on the R-band image of the cluster central region. The presence of bimodality (clumps A1 and A2 in Fig.5) is striking, as well as the twist of the axis joining the two density peaks as a function of the magnitude cut, while in both cases the peak of X-ray emission is located between the two central maxima (see the angular coordinates of the X-ray and optical subclusters listed in Table 2). It is important to stress that the two Brightest Cluster Galaxies (BCG1 and BCG2 in Fig. 9 and Table 3) are both located in the central clump A, but their positions do not coincide with the maxima of the density peaks. However, while BCG1 is near A1 (at bright and faint magnitudes), BCG2 has a significant offset to the west of A2. The axes of these two giant galaxies and the line joining them are aligned along the same direction of the large–scale cluster density distribution, i.e. the E–W direction (see Table 3). We note the presence of a bright galaxy in proximity (east) of A2, which is also on the E-W axis.
To summarize, the galaxy density distribution of A2163 shows:
-
•
a main cluster component (A) elongated along an E–W axis on large scales, and a northern subcluster (B), visible both in optical and in X-ray.
-
•
several peripheral clumps; the two most significant ones (C) and (D) are located east and west of the cluster centroid respectively, on the same E-W axis defined by the large scale distribution of A2163-A. At faint magnitudes, a southern clump (E) appears on the N–S axis joining (A) and (B).
-
•
a bimodal morphology (clumps A1 and A2) in the central (10’10’) cluster field;
-
•
a significant counterclockwise twisting of the axis joining the highest density peaks of the central clumps A1 and A2 when including fainter magnitude objects;
-
•
both the major axes of BCG1 and BCG2 and the axis joining them lie on the same E–W axis of the cluster large scale structure, which is seen both in the optical and X-ray maps;
-
•
a clear offset between a) the positions of the BCGs, b) the peaks in the projected galaxy density maps and c) the X-ray intensity peak.
3.2 Comparison of galaxy/gas density distribution
The comparison between the galaxy and gas projected density is important to characterize the dynamical state of the cluster, as the relative distribution of the collisional versus non-collisional components of the cluster is indicative of its merger stage (Roettiger et al. 1997).
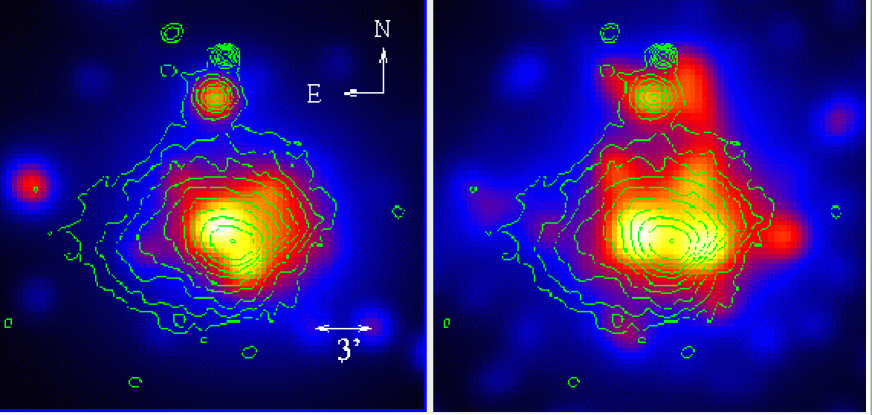
As the projected galaxy density distribution changes with magnitude, we compare the two density maps limited at and (previously shown in Fig. 5) to the XMM/EPIC images. Using archival XMM data (ID-0112230601, ID-0112230701, ID-0112230801, ID-0112230901 and ID-0112231001) we have built a mosaic image of the cluster in the [0.5-2.] keV energy band (all instruments and pointings summed together). The isocontours of the X-ray image superimposed on the galaxy density distribution are shown in Fig. 10.
While A2163-A and A2163-B are detected both in optical and in X-ray, the western and eastern clumps A2163-C and A2163-D are not detected in X-ray. At both magnitude limits, the galaxy density distribution in A2163-A is elongated and bimodal; the gas distribution is centrally peaked and more regular, but it exhibits the same E–W elongation seen in the optical data at large scales.
In the case of bright galaxies (), the projected galaxy density distribution in the central regon is nearly aligned with the inner major axis of the X-ray map (NE/SW), and perpendicular to the compressed X-ray contours in the SW region which corresponds to the position of the secondary optical clump A2. At large scales, the gas distribution presents the same E–W elongation as the galaxy distribution at faint magnitudes () (with the E–W structure embedding A2163-A, A2163-C and A2163-D). As we have seen, faint galaxies follow the same E–W orientation also in the cluster central region.
Independently of the magnitude cutoff, the X-ray center position does not correspond to any of the two optical maxima, but is located between them; moreover, also the positions of the two BCGs do not correspond to the maxima of the density distribution, neither of the galaxies nor of the gas. These facts suggest that the gas is in a more relaxed state than the galaxies and that we are witnessing a post merger event in A2163-A. On the contrary, the distributions of bright galaxies and of gas in the northern component A2163-B are comparable, a fact which might suggest that A2163-B has not yet collided with A2163-A. We will discuss the merging scenario in section 7.
3.3 Density profiles

We have estimated the projected radial density profile in the WFI field centered on the cluster. In order to correct for the areas which have been masked due to the presence of bright saturated stars, we have generated a random catalog reproducing the same geometry as the observed one.
We have calculated the number of objects in concentric circles of radius in the galaxy catalog, , and in the random catalog, , deriving the projected density profile :
| (1) |
where and are the total number of objects in the galaxy catalog and in the random catalog, respectively. We fixed , a value high enough to avoid introducing additive noise in the profiles.
We have fixed the cluster center at the position of the X-ray centroid. The X-ray center is located between the local maxima A1 and A2, and roughly coincides with the centroid of the galaxy distribution when smoothing over large scales. The profile was calculated for RS galaxies with , in order to minimize the contribution of the background. The estimate of the background level (critical on large scales) was done within a circular annulus comprised between 15 and 20 arcmin from the cluster center. Apparently the background is reached near the edge of our field.
The background subtracted profile was fitted with a generalized beta model: and a generalized cusped profile: , as defined in Adami et al. (2001), using a Levenverg-Marquardt algorithm, which gives simultaneously the three parameters , and .
The raw and the background subtracted radial profile with its best fits are plotted in Fig.11. Both the beta and cusped models provide a good fit to the data up to arcmin, with values of 0.25 and 0.35, respectively (the most deviating points –at level– are the last ones, where the uncertainty due to the background subtraction is larger). For the beta model we have and arcmin, corresponding to Mpc (in our cosmology), which is a high value. In the case of a cusped model, the best fit values are and arcmin ( Mpc). The values of are, within the errors, in agreement with those found by Adami et al. 2001 on a sample of nearby clusters ( and ), while the values of are significantly higher (the values in Adami et al. 2001, when converted to our cosmology, are Mpc for the beta model and for the cusped model). For comparison, the values for the gas profile are arcmin and (Elbaz et al. 1995). As expected from the density and isocontours maps (Fig. 10), the galaxy profile is less centrally peaked than the gas profile. The larger core radius found for the galaxies reflects the elongated, bimodal galaxy distribution in the center.
4 Velocity distribution
4.1 General behavior

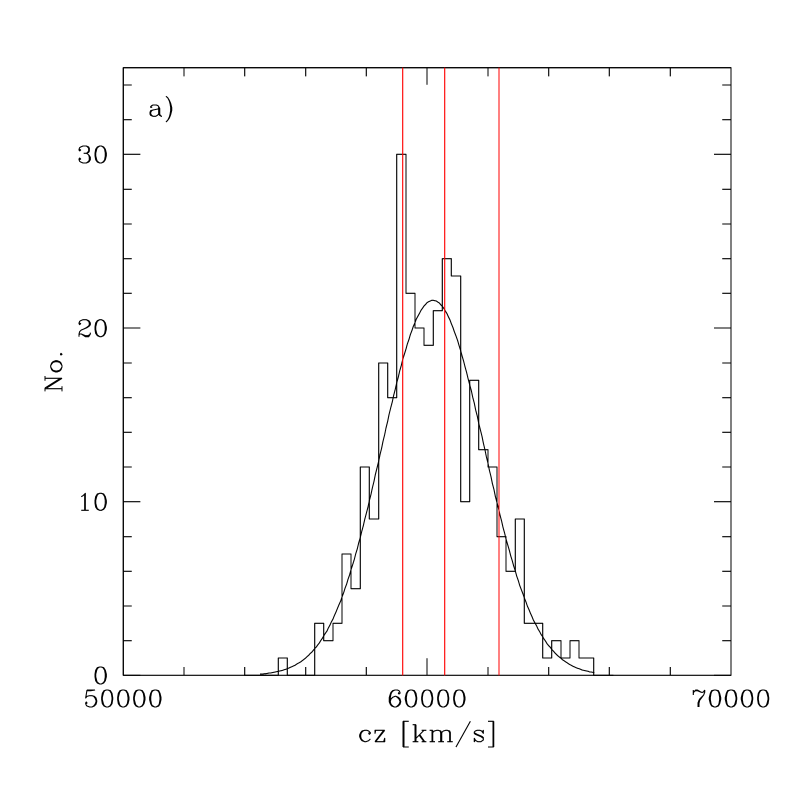
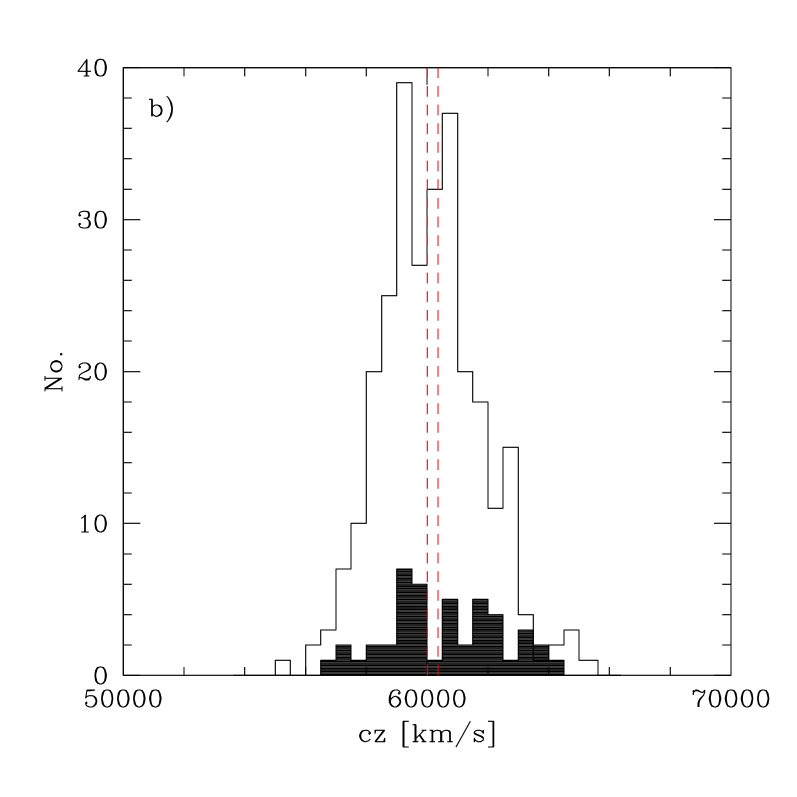
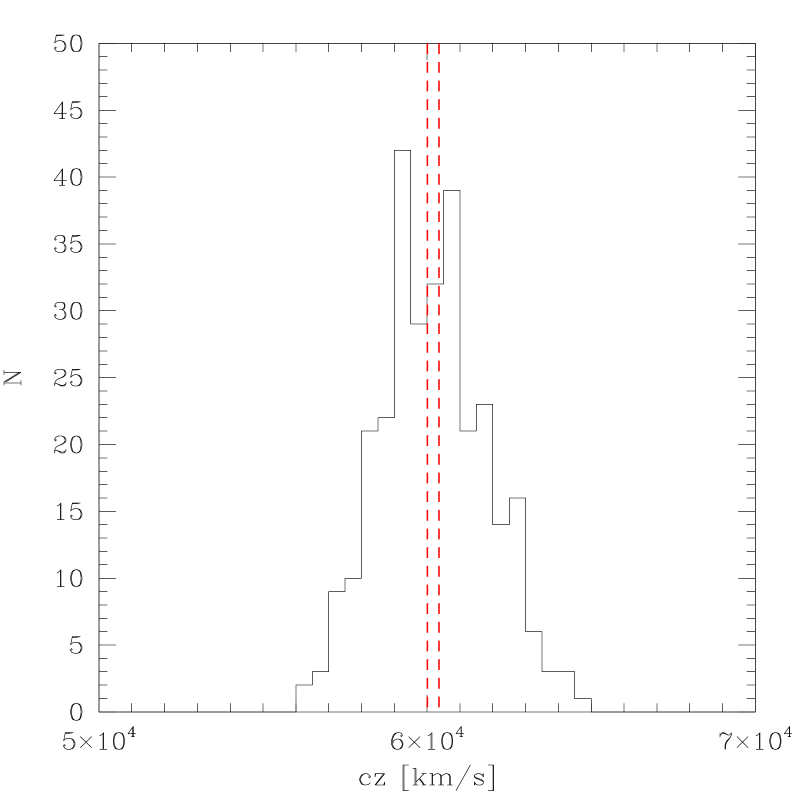
In this section we analyze the spectroscopic high precision (Flag 0, 430 galaxies) and the total sample (Flags 0 and 1, 476 galaxies). A visual inspection of the velocity histogram (Fig. 12) clearly shows the main component of the cluster at km/s, while background overdensities are detected at km/s (18 objects), and more marginally at km/s (11 objects). See also the field image in Fig. 2, where galaxies in the velocity bins corresponding to these three peaks are marked by different symbols.
A critical point is the identification of cluster members and the exclusion of interlopers (see e.g. den Hartog & Katgert 1996). As A2163 is a rich cluster, we have to take into account its broad velocity distribution. Within km/s from the main peak of the velocity distribution at km/s, we find 326 galaxies from the high precision (flag 0) catalog. This sample satisfies the criterion of a maximum velocity gap of km/s between adjacent members in velocity space. An alternative way to select cluster members is the classical three-sigma clipping method (Yahil & Vidal 1977). We have applied it to all flag 0 galaxies within the redshift range , obtaining again the same final sample of 326 galaxies. We have also checked the velocity of these galaxies as a function of their projected distance from the cluster center, finding no significant outliers. Applying the same analysis to the total (flag 0+1) sample, we find 361 cluster members. These are our reference catalogs of cluster members, which were used to study the kinematical and dynamical properties of A2163
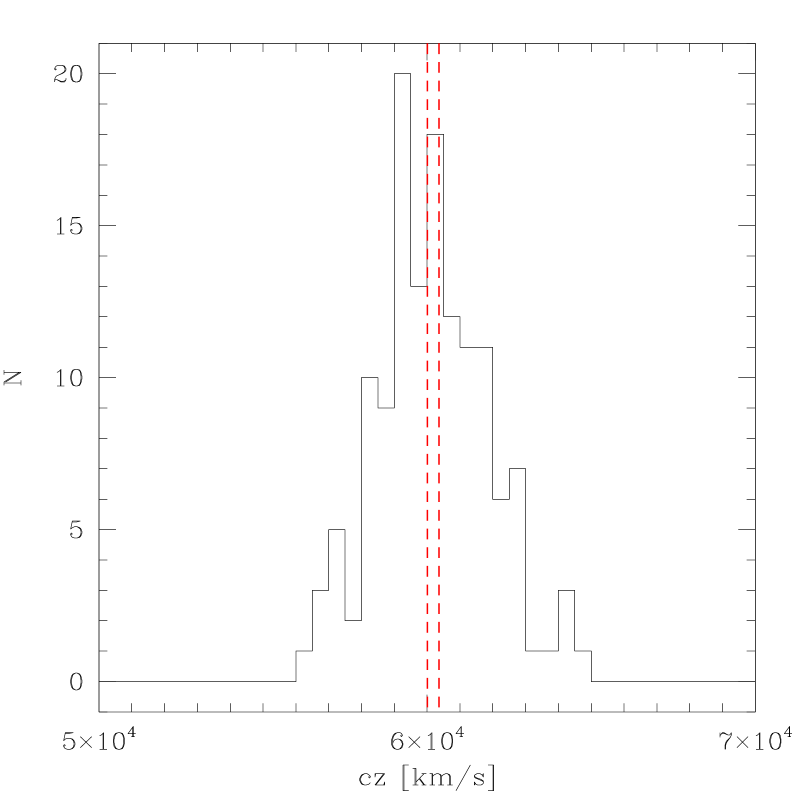
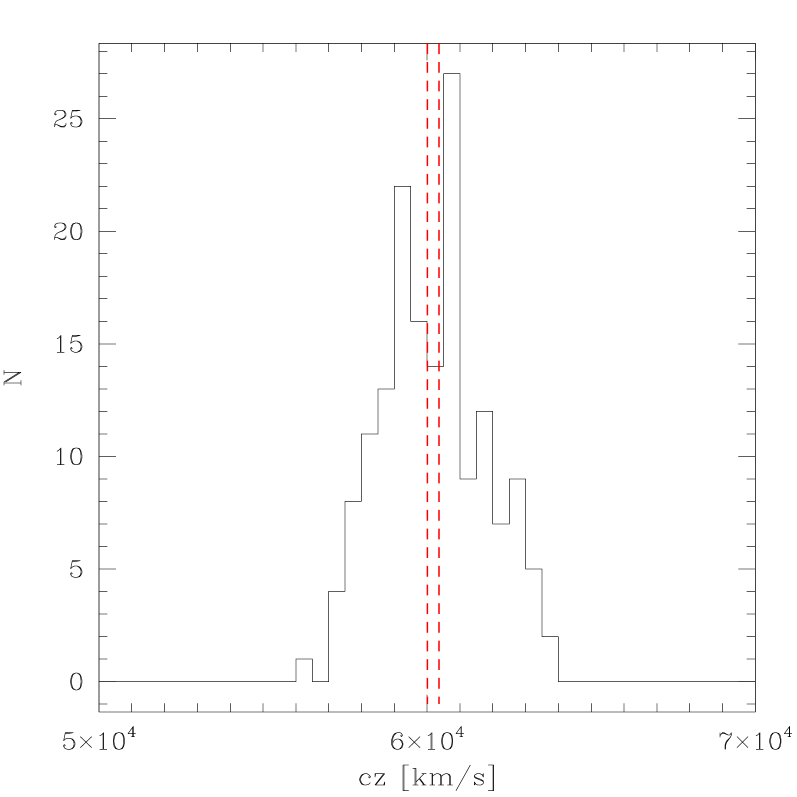
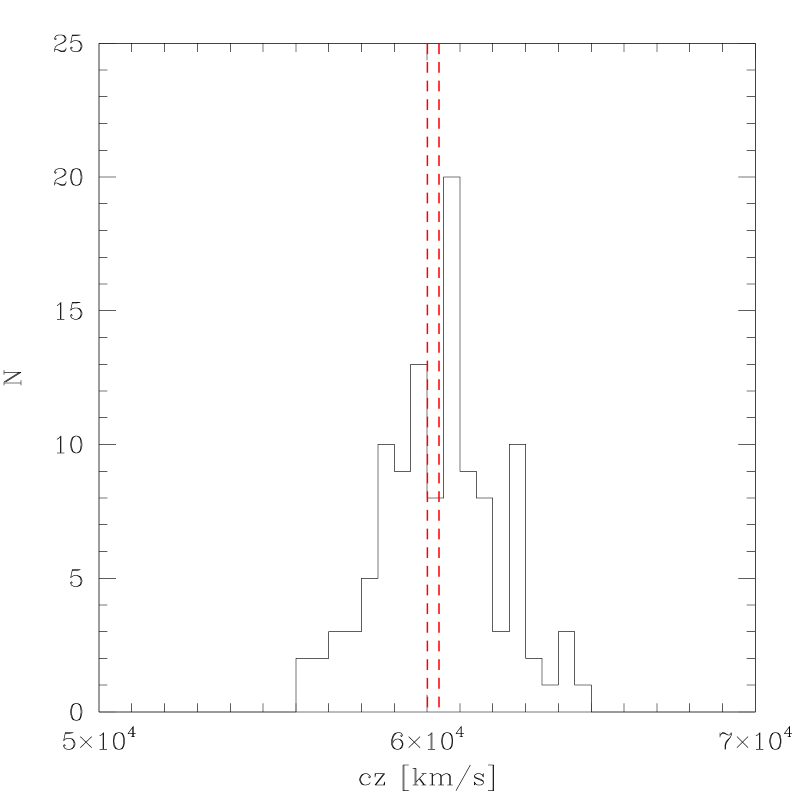
Applying the program ROSTAT (Beers et al. 1990), we find very stable values for the cluster mean velocity and velocity dispersion calculated with the different methods. In Table 4 we give the biweight estimates of the location and scale , which are better estimators than the classical mean and standard deviation, for different subsamples. The total cluster sample with 361 galaxies and the high-precision one with 326 galaxies have comparable values of location and scale, with a huge value of velocity dispersion ( km/s). The subsample including only emission line galaxies shows –not surprisingly– a higher velocity dispersion, with a value of km/s; its mean velocity is marginally higher than the mean velocity of the no emission and total cluster samples, with a velocity offset km/s. The velocity distribution of these objects (see Fig. 13) is very broad. Their projected spatial distribution (Fig.6) shows that most of them lie in the cluster outskirts. These results are expected for late-type galaxies infalling on the main cluster. However, several emission line galaxies are found within the cluster core, which is quite unusual. We have examined in more detail the position of the emission line galaxies in the field, by dividing the 30’x30’ field in individual cells of 10’x10’, and estimating the fraction of emission line cluster members in each cell. The mean fraction in the whole field is . There is a systematic increase of the fraction from the central cell, where it has the minimum value of , to the lateral cells where the mean value is . However, in the western region of the cluster it reaches the high value of . This corresponds to the excess shown in Fig. 6 in the immediate surroundings of A2163-D.
When excluding emission line galaxies, the cluster velocity dispersion slightly decreases but still has a high value: km/s. However, our estimate could be affected by substructures. For example, a visual inspection of the histogram in Fig. 13 shows a bimodality in the central part of the velocity distribution, with two peaks at km/s and km/s; it also suggests a lack of galaxies (with respect to the Gaussian fit) at km/s, and the presence of a third peak at km/s. It is not clear how much these deviations from a Gaussian distribution are real or artifacts of sampling, and in the following section we will address the details of the velocity distribution of the cluster with the appropriate statistical tools.
The velocity histogram suggests the presence of a background structure at km/s. Selecting all galaxies between km/s and km/s (18 objects, marked with blue triangles in Fig. 2), and applying ROSTAT, we find km/s and km/s. These values would be consistent with a background cluster seen on the same line–of–sight of A2163, but no significant concentration is seen in the projected distribution of the 18 galaxies (see Fig. 2). Moreover, most of these galaxies (13 over 18) show emission lines. These facts suggest that the background overdensity is probably due to field galaxies within a large–scale structure and not to a cluster: maybe a large scale filament spreading from the SE to the NW of the field.
Finally, there is another small peak in the velocity histogram at km/s, for which we have 11 redshifts. As in the previous case, the projected distribution of these galaxies (green diamonds in Fig. 2) does not show any significant density concentration. The objects seem to populate a strip crossing the field along the N-S direction, and half of them present emission lines, suggesting again a population of field galaxies. More redshifts would be necessary to identify possible structures.
4.2 Statistical analysis of the velocity distribution
In order to characterize the dynamical state of A2163, we performed quantitative tests which check if the velocity distribution can be reproduced by one or a combination of Gaussian functions, applying them to the high precision spectroscopy sample (326 objects). Among the 15 normality tests of the ROSTAT program (Beers et al. 1990), only two (the B2 and KS tests) reject the Gaussian hypothesis at a significance level 10%.
We also used two kinds of shape estimators (the traditional third and fourth moments, i.e. skewness and kurtosis, and the asymmetry and tail indices (Bird & Beers 1993) in order to test the null hypothesis of a Gaussian velocity distribution. None of them shows strong deviation from a Gaussian velocity distribution, with the exception of a slight indication of positive (i.e. above the mean velocity) asymmetry in the whole sample given by the skewness parameter. An indication of possible deviation from Gaussianity is the presence of gaps in the observed velocity distribution (Beers et al. 1991). We detected five significant weighted gaps; two of them are around the mean radial velocity of the cluster (60131 km/s).
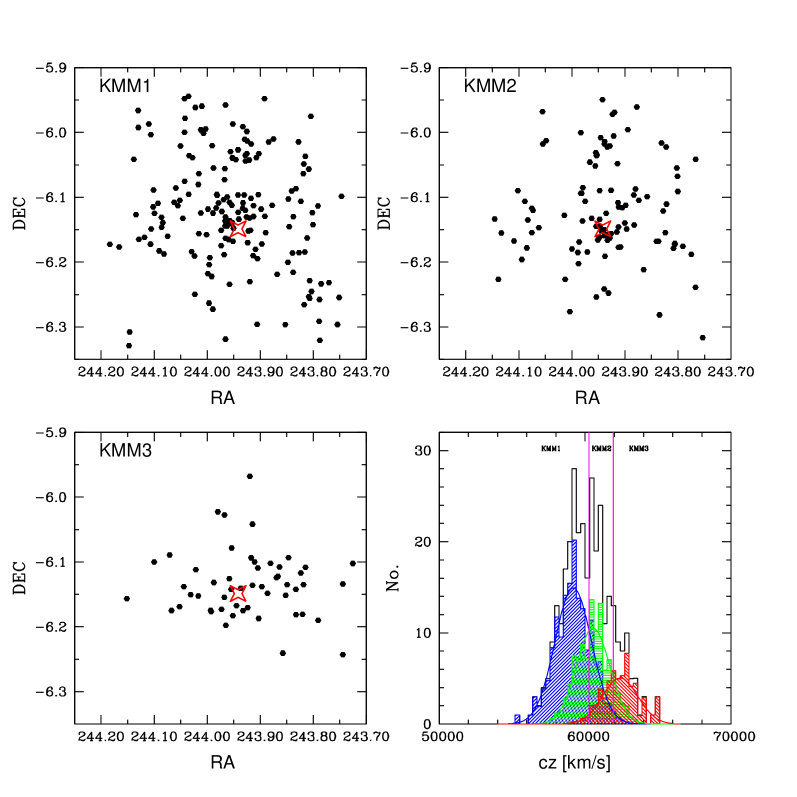
In order to quantify the deviation of the velocity distribution from a single Gaussian, we have applied the Kaye’s Mixture Model algorithm (KMM, McLachlan & Basford 1988) in the implementation of Ashman et al. (1994). This algorithm fits a given number of Gaussian distributions to the data, calculating the maximum likelihood values for the mean and the variance, and evaluating the improvement with respect to a single Gaussian fit. In particular, it gives as output the –value, which is the probability of measuring the observed value of the likelihood ratio test statistic for a sample drawn from a single Gaussian parent population: the null hypothesis of a single Gaussian parent population is conventionally rejected if and marginally inconsistent if . On the basis of the previous discussion, we have tried to fit two and three Gaussian components to our data. In both cases, the KMM does not reject the null hypothesis. For example, the two–component fit identifies the first group at a mean velocity of km/s and the second one at 61729 km/s, with a –value of 0.17, assuming the homoskedastic case, i.e. the same velocity dispersion for the different components. Moreover, the two-Gaussian fit fails to detect the peak at km/s. This is not surprising, as the velocity separation between the first two peaks is comparable to the velocity dispersion of the groups (theoretically two equal Gaussian distributions can be separated if their peaks have a separation , Everitt & Hand 1981). However, when applying a three–component Gaussian fit to the data (assuming as first guesses the peaks at 59000 km/s, 60500 km/s and 63000 km/s), the KMM identifies the two central peaks around the mean cluster velocity, with a third component at km/s (see Table 4). While such groups are not statistically significant in the velocity space, we use the KMM results with three Gaussians as an objective partition of the data and a starting point for the following combined analysis, which makes use of the projected positions.
The mean velocities of the three fitted groups are shown with thick lines in the left panel of Fig. 13, and the velocity distribution properties of the three partitions are listed in Table 4 (notice that the relative richness of the KMM groups is not very robust; for example, in the homoskedastic case, i.e. imposing the same velocity dispersion for the three components, KMM2 becomes the richest one). The two main partitions KMM1 and KMM2 correspond to the central peaks in the velocity histogram and have an offset in velocity of km/s (corresponding to a physical km/s in the reference system of the cluster), while KMM3 includes the 63000 km/s peak but is not centered on it.
The spatial and velocity distributions of the three KMM partitions are shown in Fig. 14. For each galaxy, the KMM algorithm estimates the probability of belonging to the different partitions, associating the galaxy to the partition with the highest probability. As a result, all galaxies below a “critical” velocity are associated to KMM1, all galaxies above a critical velocity are associated to KMM3, and those between and are associated to KMM2. In order to reconstruct the velocity distributions without artificial cutoffs, for each partition we have summed up the corresponding probabilities of all the galaxies in each velocity bin. The fourth panel of Fig. 14 shows and as vertical lines and the reconstructed velocity distributions of the three partitions with the corresponding Gaussian fits.


From the projected distribution of the galaxies displayed in the first three panels of Fig. 14, an offset between the spatial distributions of the two main velocity partitions is apparent along the NE/SW direction : KMM1 objects are more concentrated towards the NE side of the peak of X-ray emission (open star in Fig. 14), while KMM2 objects show a more clumpy distribution, the main concentration being located more towards the central-SW region of the cluster compared to KMM1 galaxies. Applying the Kolmogorov-Smirnov test indicates that the probability that the two distributions are issued from the same one is excluded at more than confidence level. A more detailed comparison of the spatial distributions of KMM1 and KMM2 objects will be addressed in Sect. 5.2. Galaxies in the KMM3 partition are more concentrated in the central region of the cluster, tracing the elongation in the EW direction. This could be due to projection effects, since infalling field galaxies, characterized by radial orbits towards the cluster center, have a higher radial component of their proper velocity when observed in projection at the cluster center. Indeed galaxies in the lower tail of the velocity distribution of A2163 show a very similar spatial distribution. Nevertheless, we cannot exclude that the small excess of galaxies in KMM3 is a group at a higher radial velocity with respect to the cluster mean.
| Field | Population | Flag | R | |||
| [] | [] | |||||
| 30’x30’ | all | 0+1 | 361 | |||
| 30’x30’ | all | 0 | 326 | |||
| 30’x30’ | no emission | 0 | 284 | |||
| 30’x30’ | only emission | 0 | 42 | |||
| 30’x30’ | all | 0 | 137 | |||
| 30’x30’ | all | 0 | 161 | |||
| all | 0 | 123 | ||||
| all | 0 | 61 | ||||
| all | 0 | 54 | ||||
| Field | Partition | Flag | R | |||
| [] | [] | |||||
| 30’x30’ | KMM1 | 0 | 172 | |||
| 30’x30’ | KMM2 | 0 | 102 | |||
| 30’x30’ | KMM3 | 0 | 52 |
4.3 Velocity distribution as a function of luminosity
We have discussed the variation of the projected density distribution of galaxies as a function of galaxy luminosity in the central component A2163-A. Here we will investigate the dependence of the velocity distribution on the galaxy luminosity. For this purpose, we have divided our high quality cluster spectroscopic sample in two luminosity classes, bright (, 137 galaxies), and faint (, 161 galaxies), and we have analyzed the two subsamples with ROSTAT. Their velocity distributions are shown in Fig. 15 and the values of location and scale are listed in Table 4. A similar analysis was performed in the central region of the cluster, corresponding to A2163-A, within a radius of 5 arcmin from the X-ray center.
Concerning the field, the estimates of location for the two luminosity classes are consistent and also in good agreement with the estimate for the whole sample. The velocity dispersion of the bright sample is km/s higher than that of the total sample, while the velocity dispersion of the faint sample is km/s lower than that of the total sample, but at the level. The histograms (Fig. 15) show that the bimodality previously detected around 60000 km/s for the whole sample is still present for both the bright and faint subsamples. Faint galaxies appear to be slightly more numerous in the km/s peak.
Restricting the analysis to the inner 5 arcmin field (bottom row in Fig.15), we find that the estimates of location for the two luminosity classes are stable and consistent, with a value km/s higher than the estimate for the whole field but still consistent taking into account the large error bars. On the other hand, as in the case of the field, the velocity dispersion of the faint sample ( km/s) is smaller than that of the brightest ones ( km/s), but now the effect appears statistically significant (). This might indicate that the population of faint objects in the core is more relaxed. The peak at km/s becomes more dominant when analyzing the distribution of faint objects in the core. The comparison between the velocity distribution in the core and that in the whole field suggests that the velocity peak at km/s is mostly composed of faint and bright objects outside the inner 5 arcmin, while the one at km/s is dominated by the faint population within the core. The third peak at km/s is particularly apparent in the core (as it was apparent in the projected distribution of KMM3 objects shown in Fig. 14) and composed both of faint and bright galaxies. In the following sections we present a more detailed analysis of the relative projected density distribution of these objects.
4.4 Spatial variation of the velocity distribution
We have analyzed the velocity distribution in different cluster regions, addressing the variation of the global quantities, location and scale, as a function of the angular distance to the cluster center and of the position angle. As for the projected density profiles, we have chosen the position of the X-ray centroid as the cluster center. For our first purpose, we have measured the location and scale in increasing circular annuli. The differential and integrated profiles of these quantities are shown in Fig. 16. The velocity profile reaches a maximum km/s at an angular scale of arcmin, then declines to km/s. While a determination of the exact profile is difficult due to the large error bars, the mean velocity in the inner cluster region is significantly higher than in the outer region.
The velocity dispersion profile has very high values ( to km/s) in the inner region (up to arcmin), then drops to lower values (1100 km/s) at larger scales. Here again, the error bars are large, but when comparing the value in the 2-4 arcmin bin to that in the 8-10 and 10-12 arcmin bins, the effect is significant.
Given the complexity of the system, we analyzed the variations of the velocity distribution not only as a function of the distance to the center, but also in sectors at different position angles. We have estimated and in eight angular sectors, each one 45 degrees wide, centered on the X-ray centroid and rotating counterclockwise starting from West on the right ascension axis. These measurements are shown in Fig. 17. The mean velocity shows a systematic trend, reaching a maximum value ( km/s) in the 0-45 degrees sector, and a minimum nearly in the opposite direction, with values lower than the mean in the North-East quarter (90-180 degrees). The velocity dispersion is quite high in all sectors, with a particularly high value of km/s in sector 5 (180-225 degrees). Unfortunately our sampling is not sufficient to consider this high value as statistically significant.
We conclude that there are variations of the velocity distribution between different field regions; the velocity dispersion decreases with radius, and the value of the mean velocity is lower in the NE region than in the NW (and also lower with respect to the cluster mean).
In what follows we will investigate how the features of the velocity distribution are connected to the overdensities identified in the projected density distribution.
5 Combined velocity-density analysis of subclustering
5.1 Kinematical indicators of subclustering
We have applied three classical methods that quantify the amount of substructure in galaxy clusters using a combined analysis of the velocity and spatial distributions of confirmed cluster members, i.e. the , and tests by Dressler & Shectman (1988), West & Bothun (1990) and Bird (1994) respectively. The actual values of the , and parameters and their significance levels are summarised in Table 5. Significance levels were obtained using the bootstrap technique and normalizing with 1000 Monte Carlo simulations.
| Indicator | Value | Significance |
|---|---|---|
| 428.790 | 0.002 | |
| 0.478 Mpc | 0.012 | |
| 0.999 |
Assuming that these tests reject the null hypothesis for significance levels lower than 10%, both the and tests find strong evidences of subclustering, with significance levels 1%. Subclustering is not detected by the test, which was shown in Pinkney et al. (1996) to be less sensitive than the and tests.
In Fig. 18 we show the results of the Dressler & Shectman (1988) test. The projected position of each galaxy is represented by a circle whose radius is weighted by the corresponding parameter111The test by Dressler & Shectman (1988) associate a value to each galaxy, being the sum of all .. Large circles indicate local spatial and/or kinematic variations with respect to the whole cluster properties, i.e local velocity dispersion and/or mean velocity significantly different from the global cluster values. From this plot, we do not detect any strong concentration of large circles which would indicate the presence of a significant substructure. However, large circles appear to be more frequent in the northern region of A2163-A, and west of the main cluster. Given the highly significant value of the and tests and the local concentrations of circles, we have investigated in more detail the correlation of subclustering in velocity and density space.

5.2 Slicing the density distribution in velocity and luminosity space
As shown in sections 4.3 and 4.4, we have detected several signatures indicating that the velocity distribution depends on the luminosity and on the spatial location of galaxies. Here we investigate the relation between the substructures visible in the cluster projected density distribution and the partitions detected in the velocity distribution, testing the dependence of the projected density both on the velocity and on the luminosity range. For this purpose, we have built several sets of density maps for the galaxies with a measured redshift (spectroscopic sample).
In Fig. 19 we show the density maps for all the galaxies which are members of the cluster and for the galaxies associated to the KMM1 and KMM2 partitions (Sect. 4.2). We omit KMM3 as its number of objects is too small; these objects were shown to be located preferentially in the central region corresponding to A2163-A. We have furthermore selected galaxies in three magnitude ranges, applying the same criteria as in Sect. 4.3: the whole magnitude range (), and the bright () and faint () ranges. In each case, we overplot the isocontours of the projected density distribution for the photometric sample corresponding to the same magnitude limits, as it does not suffer of the sampling inhomogeneities of the spectroscopic sample. We stress that the spectroscopic sampling is homogeneous only in the central field and for the bright galaxies (): for this reason the density maps of fainter galaxies are biased and require a careful interpretation.
We have also built density maps for galaxies in different velocity ranges. In the case of the bright subsample (R, top row), the density map of all the confirmed velocity members of the cluster (top left) is in very good agreement with the projected density map of the photometric catalogue at the same magnitude limit. Both subclusters A2163-A and A2163-B are clearly visible on the map (and to some extent A2163-C, which is however in a region not very well sampled by spectroscopy). In the main cluster A2163-A, the NE/SW orientation is confirmed, and the deformations of the projected isocontours in its periphery are shown to be due to the presence of small groups belonging to the cluster. The density maps of galaxies in the KMM1 and KMM2 partitions (top middle and top right) reveal some differences. While KMM2 follows the projected high density structure with maxima A1 and A2, KMM1 is clearly located in the northern region of A2163-A. This is in good agreement with the previous analysis of the velocity distribution in sectors, which showed a lower mean velocity in the NE sectors (Fig. 17).

The density maps of faint galaxies (, middle line) in KMM1 (central panel) and KMM2 (middle row, right column) indicate clear differences. The same is observed when considering all galaxies with . Looking at A2163-A, there is an offset in the core along the NE/SW axis between the projected density maxima of KMM1 and KMM2, consistently with Fig. 14. In the density maps of the spectroscopic sample there are no clear peaks in correspondence to the A2, D and E components, while they are apparent in the density maps of the photometric catalogue: this is due to the low sampling rate in those regions.
For the whole velocity range within the cluster (left column), when varying the magnitude range from bright to faint galaxies (top left to middle left panels), there is a shift of the main peak within the core of A2163-A along the N-NE/S-SW axis. The positions of the density maxima both for KMM1 and KMM2 (middle and right columns) show also variations with luminosity. We conclude that the galaxies associated to different velocity partitions have different projected density distributions, and this is true whatever be their luminosity range. Moreover, the projected density distributions of all the velocity partitions vary systematically with the luminosity range.
In Fig. 20 we compare the density maps of the spectroscopic sample including the whole magnitude range () to the X-ray isocontours. The X-ray maximum of the main component A2163-A is located in between the density peaks corresponding to KMM1 and KMM2, indeed very close to the KMM2 peak. KMM1 is clearly offset to the NE with respect to the X-ray contours. More strikingly, the compressed X-ray contours in the SW region are roughly perpendicular to the axis joining KMM1 and KMM2.
5.3 The peripheral subclusters
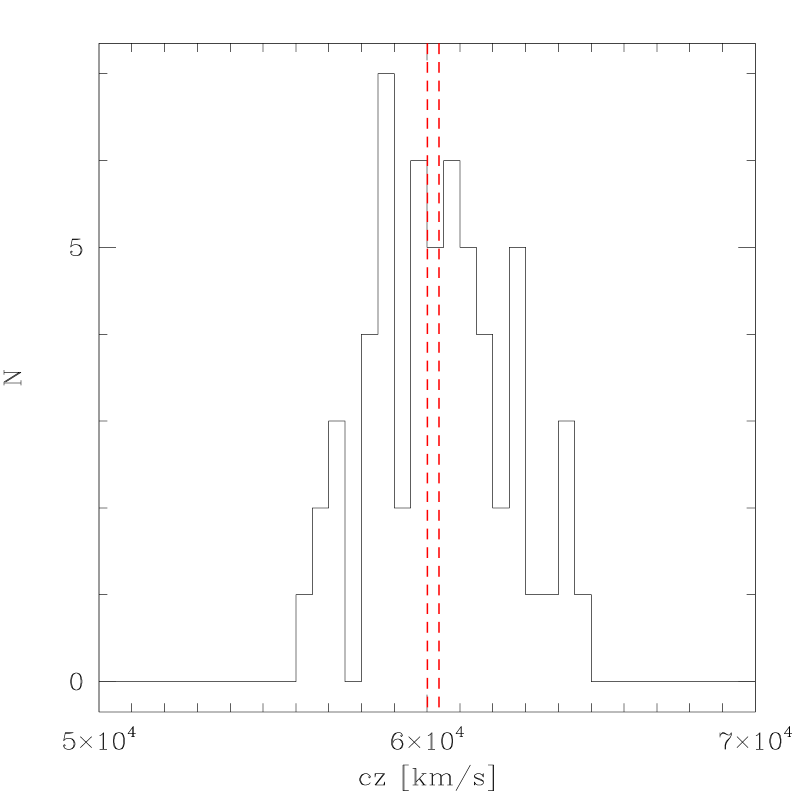
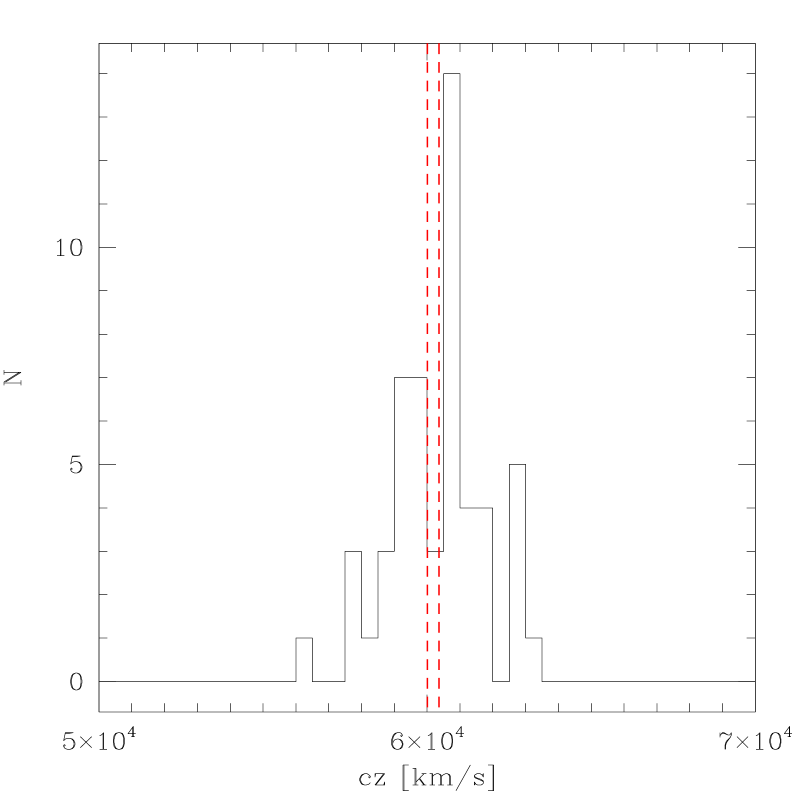
The projected galaxy density distribution (Fig. 5) has shown the presence of two particularly significant subclusters, North and East of the main component (A2163-B and A2163-C), and of smaller ones, West (A2163-D) and South (A2163-E) respectively. We have used our spectroscopic data to establish if these components belong to the A2163 complex. Unfortunately the regions of A2163-D and A2163-E are sparsely sampled. In the case of A2163-C, 15 redshifts are available within a radius of 2 arcmin from its center: the mean location is km/s, thus confirming its association to the A2163 complex.
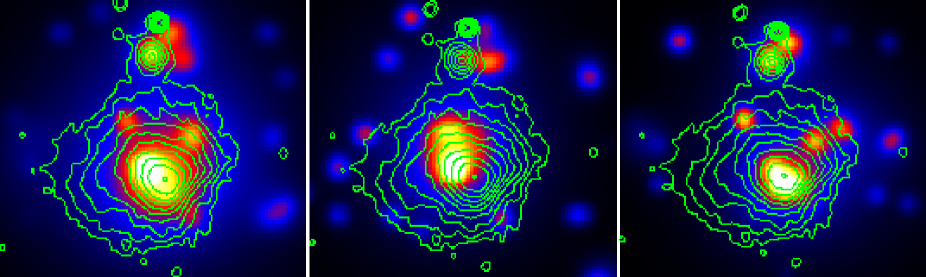
In Fig.21 we show the projected density distribution of galaxies in A2163-B (), which is centered on a dense group of bright objects with two galaxy pairs. Contours are roughly elliptical in the center and progressively elongated along a tail extending North-West. This tail becomes more prominent and extended when including fainter magnitudes (see Fig.19, left panel).
The right panel of Fig.21 shows the X-ray contours from XMM data. A secondary peak in the X-ray emission, North of A2163B, is due to a galaxy which is a cluster member: it is a type 1 AGN, and its spectrum is shown in Fig.1. The velocity histograms of galaxies within projected separation of 2 arcmin and 3 arcmin respectively from the position of the main density maximum of A2163-B are shown in Fig.22. Values of location and scale have been calculated with ROSTAT, leading to km/s and km/s (2 arcmin, 22 galaxies) and km/s and km/s (3 arcmin, 35 galaxies). The value of the mean velocity is in good agreement with the global one for the whole cluster (Table 4). However the velocity dispersion is high, typical of a rich cluster and not of a group.
The mean velocity of A2163-B confirms that it is member of the same complex as A2163-A, as already indicated by the density map of galaxies within the cluster redshift range displayed in Fig. 19 (bottom left). However, the velocity distribution is complex, with three peaks at different velocities. One difficulty, due to the small angular separation of the two components (7 arcmin), is to disentangle the contribution of A2163-B from that of the main underlying cluster A2163-A. In order to better understand the spatial location of the galaxies belonging to the different peaks in velocities, in Fig. 21 (left) we have marked them with different symbols according to the velocity range. A significant component of galaxies belonging to the intermediate velocity peak ( km/s) extends all over A2163-B, including the central elliptical galaxy on which the X-ray contours are centered (Fig. 21, right) . This suggests that A2163-A and A2163-B have approximately the same redshift. However, both low an high velocity components are present, and strongly contribute to the measured high velocity dispersion. There is no BCG in the center but a couple of galaxy pairs and a dumb-bell galaxy. The two galaxies of the northern pair lie at 61804 km/s (for the brightest) and 61920 km/s, revealing a “physical” pair at high velocity as compared to the main cluster. However, the two galaxies of the southern pair (a bright elliptical on which are centered the X-ray contours and a smaller object) show very different velocities (59914 km/s and 58192 km/s), implying that their pair-like aspect probably results from a projection effect. Unfortunately, the Eastern region of A2163-B is poorly sampled. In particular, there is a concentration of galaxies around a bright dumb-bell galaxy whose redshift is unknown. With the present incomplete velocity sampling of A2163-B, it is difficult to separate its velocity distribution from that of the main cluster. Present evidence might suggest a complex dynamical state for A2163-B with the presence of several components in velocity space, but the low spectroscopic sampling does not allow us to reach a definitive conclusion. The relation of A2163-B with the main complex will be further discussed in Sect.7.
6 The mass of A2163
It is well known that estimating the mass of a merging system is a difficult problem, as the general assumption on which mass calculation is based is that the system is at equilibrium (virial theorem for optical analysis, and hydrostatic equilibrium for X-ray). However, the simple presence of substructures in a system does not automatically imply that such an estimate is unreliable: the crucial point is how much the system is far from equilibrium.
In the case of A2163, we have shown that clear signs of merging are present; on the other hand, the general regularity of its density and velocity profiles suggests that the system is not too far for equilibrium. In fact, the projected galaxy distribution of the main cluster is reasonably regular when smoothed on a sufficiently large scale. Moreover the velocity distribution, in spite of the existing bimodality, is well fitted by a Gaussian distribution. Finally, there is an excellent agreement between the X–ray temperature of the cluster (T=12.4 keV, see Govoni et al. 2004 and Pratt et al. 2001) and its global velocity dispersion: using for example the relation (Lubin & Bahcall 1993) we obtain km/s, to be compared to our estimate of km/s. There are also mass estimates from weak lensing, which do not rely on hydrostatic equilibrium, virialization or the symmetry of the system. Unfortunately, the two weak lensing velocity dispersions presently available for A2163 are quite uncertain: for a singular isothermal model Squires et al. find km/s, but note that a value of km/s would still be consistent with observations; with the same model, Cypriano et al. (2004) find km/s. These values correspond to mass estimates systematically lower than that calculated from X-ray approaches. Squires et al. (1997) note that the mass estimate can be biased downwards if the cluster extends to the control annulus, and applying a tentative correction based on the X-ray derived mass profile they obtain consistent X-ray and weak lensing mass estimates. However, up to now weak lensing analysis have been restricted to relatively small and central fields (7’x7’), while the cluster extends at least to angular separations of 10’. A weak lensing analysis using our multi-band wide-field imaging of A2163 is under progress (Soucail et al. in prep.). Another alternative, when the merging clusters are well defined, is to estimate the mass for each clump separately and add the two components. This is not possible here, as there is too much spatial overlap between the two main velocity components identified as KMM1 and KMM2.
We have applied a standard approach to estimate the virial mass from spectroscopic and photometric data (see e.g. Ferrari et al. 2005); under the usual assumptions of spherical symmetry we have , where and are respectively the spatial and projected virial radii (see Limber & Mathews 1960), and , where is the spatial virial velocity dispersion and is the radial velocity dispersion of the system. The virial mass is then:
| (2) |
is given by:
| (3) |
where is the projected harmonic radius
| (4) |
is the projected separation between the th and th galaxies, and is the total number of objects in the system.
For the estimate of the harmonic radius we apply the ring-wise estimator (Carlberg et al. 1996). As in Ferrari et al. 2005, we have estimated the harmonic radius selecting from our photometric catalogue the galaxies belonging to the red sequence. Using the photometric catalog we are able to have an homogeneous field coverage, and the red sequence guarantees that we are selecting early–type cluster members, excluding interlopers and therefore optimizing the mass estimate (see Biviano et al. 2006).
From our photometric catalogue we have selected all galaxies with which belong to the red sequence, and are within 10 arcmin of the cluster center (corresponding to 2 Mpc –and to Abell radius– in our concordance cosmology).
We find a projected virial radius Mpc, and a virial mass .
However, we have to take into account that our observations cover a large part of the cluster, but not the whole cluster: the value of represents a good estimate of the mass only within our observational window, but not of the total mass. In a given cosmology, the total virialized mass of a cluster is expected to be correctly estimated if the ratio of the mean density within to the critical density is lower than a given value , which depends on the cosmological model and the cluster redshift. The value of can be derived in the spherical collapse model assuming that the cluster has just virialized: in the case of an Einstein - de Sitter model, , usually approximated with , while in our cosmology at (see e.g. Eke et al. 1996) and at (using the fitting formula in Bryan & Norman 1998); for sake of comparison we will give values both for and .
Given that and , can be related to the virial radius according to the relation:
| (5) |
Introducing the mean cluster redshift and the estimated value of the three-dimensional virial radius into the above equation, with , we find . As expected, this value is higher than . In order to measure the total mass, we have therefore to extrapolate to larger radii.
Assuming that at radii larger than the profile goes as , from equation (5) we find the radius within which the mean density is :
| (6) |
The mass goes as if , or if . For we obtain
| (7) |
Assuming , which corresponds to an Hernquist profile at large radii (Hernquist 1990) and gives a convergent mass, we find Mpc and Mpc, while and .
Until now we have ignored the surface pressure term (The & White 1986). This is an additional term to the standard virial theorem which must be taken into account when the volume used to estimate the virial mass does not include the whole system. Neglecting it, the virial mass is overestimated by a factor depending on the observed fraction of the cluster and its profile; this factor cannot be larger than 50%, which is the case of an isothermal sphere (see Carlberg et al. 1996, Girardi et al. 1998). In our case, the field is quite large and the expected surface pressure term should be small, but in order to quantitatively assess the effect of the field size we have used numerical simulations. We have generated 1000 mock clusters, each one following an Hernquist distribution, with a density profile truncated at 20 Mpc and Mpc. We have chosen this value as Lanzoni et al. (2004) have found that for cluster dark haloes the half–mass projected radius is in the range of 0.2 to 0.4 : the estimated value of Mpc for A2163 implies that should be between and Mpc. The total mass has been fixed to , a value slightly smaller than the estimated one and reproducing the observed velocity dispersion; the average number of simulated galaxies has been chosen to reproduce –on the average– the observed number of cluster members. We have estimated the virial radii and masses of the simulated clusters as a function of the field radius, applying the same analysis as for the real data. The dispersion of the mass values around the mean gives an estimate of the error due to the poissonian sampling, while the systematic offset of the measured mean mass with respect to the prediction for a theoretical Hernquist profile gives an estimate of the surface pressure term. The average measured virial mass of the simulations within 10 arcmin is , i.e. 79% of the total mass, with a error of 9%. According to the theoretical Hernquist profile with a cutoff at 20 Mpc, we would expect 71% of the total mass within 10 arcmin, i.e. on average we overestimate the mass of the simulated cluster by 8%.
Taking into account the pressure term, we finally have , while the extrapolated total masses are and . Our values are in good agreement with the X–ray estimate of Elbaz et al. which, rescaled to km/s/Mpc, corresponds to within Mpc, and confirm that A2163 is one of the most massive clusters known.
7 Discussion and conclusions
Multiple signatures of merging have been detected in A2163. Comparing this optical analysis to previous results at other wavelengths allows important clues about the merging history of this cluster to be derived.
A2163 appears to be composed of a main component (A2163-A), of a subcluster 7’ North of its center (A2163-B), both identified at optical and X-ray wavelengths, and of various clumps: A2163-C, A2163-D, and A2163-E, East, West and South of the main component respectively, detected only in the optical. A2163-A, A2163-B and A2163-C are spectroscopically confirmed. A large scale elongation along the E–W direction appears at faint magnitudes, embedding A2163-A, A2163-C and A2163-D and extending over 20 arcmin (4 Mpc). A bridge of faint galaxies seems to connect A2163-A to A2163-B along the North-South direction. A2163-E also lies on this N–S axis. The central cluster A2163-A shows a strong luminosity segregation in its projected density distribution. At bright magnitudes, there is a NE/SW structure, with a bright maximum in the NE part and a secondary maximum in the SW part. When including galaxies at fainter magnitudes, the orientation of the inner subclustering changes, showing two maxima aligned in the E-W direction. We find that there are relative offsets in the positions of: a) the BCGs; b) the peaks in the projected galaxy density maps; c) the X-ray density peak. Restricting the analysis to the members of the red-sequence shows the same properties, while enhancing the density contrast of the bimodal structure in the central part of A2163-A.
Another signature of merging is the presence of multi-modality in the velocity distribution of the whole cluster. With a KMM analysis we identify two partitions very close in velocity, centered at km/s (KMM1) and km/s (KMM2), respectively, corresponding to the two main peaks in the velocity histogram, and a third partition peaked at km/s (KMM3). The spatial distribution of the galaxies belonging to KMM1 and KMM2 partitions is different; in particular in the central region KMM1 galaxies are preferentially in the NE part while KMM2 galaxies rather populate the central region. Galaxies in the KMM3 partition do not show any particular concentration and are distributed along an elongated structure, following the main E–W axis of the cluster.
A comparison of the optical and X-ray density maps indicates a strong segregation between gas and galaxies, and interesting alignments effects. In A2163-A, the main NE/SW axis joining the two maxima in the isodensity map of bright galaxies is nearly aligned with the inner direction in the gas density contours, and perpendicular to the compression of the X-ray isophotes in the SW region. This can be expected in the case of merging between these two clumps along a NE/SW axis. On the other hand, at larger scales the gas density distribution is mostly oriented along an East-West axis, which is also the case for the large–scale over-density embedding A2163-A, A2163-C and A2163-D, and for the density distribution of faint galaxies of A2163-A.
Several facts argue that we are witnessing a post-merger event: for instance the relatively mixed velocity distribution (Schindler and Böhringer 1993), and the location of the density maximum in the gas distribution traced by X-ray observations, in between the two peaks of the galaxy density distribution. The most likely scenario for the main cluster is that a collision has already occurred within A2163-A, as suggested by Elbaz et al. (1995) and Squires et al. (1997). The two density clumps existing in the core of the galaxy distribution would be the fossils of the previously colliding subclusters. Another signature of a post-merger event is the luminosity segregation detected in A2163-A. A luminosity segregation in projected density has been observed in several observed clusters (Biviano et al. 1996, Barrena et al. 2007). The most luminous cluster galaxies are then supposed to trace the remnants of the pre-merging substructures, while the distribution of fainter objects, elongated in the same direction as the ICM distribution, traces the large-scale structure and morphology of the recently formed cluster. Moreover, in A2163-A the velocity distribution of bright objects () is more dispersed than that of fainter ones (), varying from km/s to km/s. The density distribution of those faint objects with measured redshift is also roughly coinciding with that of the gas shown by X-ray isocontours, but this result may be affected by incomplete spectroscopy sampling at faint magnitudes. These facts converge to the conclusion that the distribution of faint objects is quietly settling within the cluster potential, while that of bright ones is still substantially disturbed, as expected in the early period after a merger.
The comparison with the dark matter and gas density maps derived from numerical simulations is essential in order to constrain the merging scenario, in particular the epoch and the axis of the merger event. This is due to the difference in relaxation times between collisionless and collisional components of the cluster. Roettiger et al. (1997) have followed the evolution of gas density and dark matter density distributions during the merging process. While gas and dark matter contours are coincident before the merging, they become quite different after core passage, with the gas “sloshing” about within the gravitational potential. The observed relative distribution of gas towards galaxies in A2163-A, with a single peak in the gas contours located in between the two peaks of the galaxy distribution (supposed to trace the dark matter one) is quite similar to that observed in simulations immediately ( Gyr) after the merger (see Figure 23c of Roettiger et al. 1997). Chandra observations (Markevitch et al. 2001, Govoni et al. 2004) at higher spatial resolution indicate a possible double peak structure in the very center of A2163. However the separation of these peaks ( arcsec) is quite smaller than that shown by the galaxy distribution, and their positions are in between the galaxy peaks.
Subclustering tests can also bring information on the merging axis. From numerical simulations Pinkney et al. (1996) conclude that if the angle between the merger axis and the line of sight is greater than 30 degrees, little substructure will be detected in the 1D velocity distribution during the 2 Gyr after the merging occurred. We detect subclustering in A2163 with 2D or 3D tests, but also from the analysis of the radial velocity distribution (strong velocity gradient). This implies that the merging axis (whose projection on the plane of the sky follows the NE/SW direction) has also a component along the line of sight and that the angle of the merger axis with the line of sight should be less than 30 degrees. It is interesting to note that in correspondence to the SW clump A2 revealed at bright magnitudes, one can find the cold core detected by Govoni et al. (2004) in the Chandra temperature map, near the region of compressed inward X-ray contours.
Some facts still remain to be explained. A priori, one would have expected a correlation between the positions of the BCGs and the two density peaks A1 and A2 defined by bright galaxies. The Eastern one, BCG1, is located near the NE bright clump A1. However, the location of BCG2, completely offset to the West side of A2163-A, is quite puzzling. However, in case of a post-merger event, such apparent discrepancies can be expected. The velocities of the two BCGs are comparable to the cluster mean velocity and are within the range defined by the two central velocity peaks: they have respective offsets of +230 km/s and -125 km/s with respect to the cluster velocity derived from the high precision sample, which correspond to physical velocity differences of +192 km/s and -104 km/s in the reference system of the cluster.
Another issue is the geometry of the merging event. While the projected density distribution of bright galaxies () suggests a NE/SW axis, the two BCGs are aligned along a E–W axis, as well as the projected density distribution of the fainter galaxies. The analysis of the velocity distribution of bright galaxies seems to confirm the NE/SW orientation for the merger axis, and that of fainter galaxies appears to be consistent. However, one has to note that the velocity distribution of the fainter objects is very poorly sampled, especially in the western subcluster of A2163-A visible in the projected density map at R, and responsible of the twist of the isophotes from NE/SW to E–W. Important issues on the velocity distribution of faint galaxies may therefore be hidden by this inhomogeneous sampling. A detailed analysis of the density and temperature distribution of the gas from XMM observations, and of the further constraints on the merging scenario which can be derived from a comparison to numerical simulations will be presented in a forthcoming paper.
The northern component A2163-B is shown from our spectroscopy analysis to lie at a redshift comparable to that of the main cluster, so it is part of the same complex. This confirms the photometric redshift analysis of La Barbera et al. 2004. However, the velocity distribution is complex, with three velocity peaks and a high velocity dispersion, more typical of a rich cluster than of a group. Part of this high dispersion might be due to contamination from galaxies of the main cluster.
A possible scenario is that A2163-B is infalling towards A2163-A. This pre-merger hypothesis is consistent with the coincident and round shape of the gas and bright galaxies density distributions. However, two features are not easily explained: the fact that at fainter magnitudes the projected density distribution of A2163-B shows an important Western trail (confirmed by the redshift space density maps) which seems to extend towards A2163-A through a N–S bridge of galaxies, and that the velocity distribution looks highly dispersed. While the high velocity dispersion may be an artifact due to an insufficient spectroscopic sampling, the N–S bridge of galaxies is not explained in this scenario.
This bridge could in fact have a tidal origin. Another scenario is that A2163-B has already undergone a high impact parameter merging event with A2163-A. Crossing the very peripheral region of A2163-A, the gas core would have been preserved, but the tidal interaction would have left the N–S bridge of faint galaxies. Moreover, the velocity dispersion of A2163-B would have been strongly increased by the merging event. This scenario is however difficult to reconcile with present X-ray observations, since whatever the impact parameter, one should in principle detect a trailing emitting X-ray gas, which is not the case. Deeper study of the X-ray observations, in combination with the present data, should help to resolve the issue.
The Eastern and Western clumps, A2163-C, and A2163-D less dense than A2163-B and not visible in X-ray, are likely to be groups infalling on A2163-A along the E–W structure. The presence of a significant excess of emission line galaxies in the Western periphery of A2163-D could also be related to the merging process, which has been suggested to trigger a burst of star formation in the galaxy population (Bekki 1999), or to accretion on the E–W filament. The southern clump A2163-E is probably accreted on the N–S direction.
Although the central region of the cluster exhibits clear signatures of recent merging, the velocity distribution on the whole sampled region is not statistically deviant from a Gaussian distribution, and the averaged density profiles are reasonably regular. Therefore it appears reasonable to estimate the mass applying the virial theorem: the resulting value, , is among the largest measured for a cluster. This would remain true even taking into account the uncertainties which could cause an overestimate of the mass (by % if for example the true velocity dispersion were as low as as found for the subsample of the central, faint galaxies, i.e. km/s).
In conclusion, the observed properties of A2163 result from multiple merging and accretion processes. We should probably speak of an “A2163 complex”, a very massive structure composed of a main component having recently undergone a strong merger phase along the NE/SW or E–W axis with a velocity gradient km/s, and accreting a variety of groups aligned along a large scale filament spreading over 4Mpc in the E-W direction. The secondary northern subcluster A2163-B belongs to the same complex and according to optical observations alone has probably already crossed the periphery of A2163-A.
Acknowledgements.
The data published in this paper have been reduced using VIPGI, designed by the VIRMOS Consortium and developed by INAF Milano. We thank Bianca Garilli for her generous help, together with Marco Scodeggio, Paolo Franzetti and Luigi Paioro for numerous interactions in the VIPGI data reduction. We thank the Programme National de Cosmologie of CNRS for his constant support on this program, the Observatoire de la Côte d’Azur and the Laboratoire Cassiopée, CNRS, for funding this project. We are very grateful to Luigina Feretti for fruitful discussions. We also thank Eric Slezak and Albert Bijaoui for providing the density estimator based on the Multiscale Vision Model used in this paper. We thank Andrea Biviano, José de Freitas Pacheco and Heinz Handernach for their reading of the manuscript and for their comments. We thank the referee for his/her useful comments which helped to improve the quality of this paper. CF acknowledges financial support of Austrian Science Foundation (FWF) through grant number P18523, and Tiroler Wissenschaftsfonds (TWF) through grant number UNI-0404/156. GWP acknowledges support from DFG Transregio Programme TR33. H.B. acknowledges the financial support from contract ASI–INAF I/023/05/0.References
- Adami et al. (2001) Adami C., Mazure A., Ulmer M.P., Savine C., 2001, A&A 371, 11
- Arnaud et al. (1992) Arnaud M., Hughes J.P., Forman W., Jones C., Lachieze-Rey M., Yamashita K., Hatsukade I., 1992, ApJ 390, 345
- (3) Arnaud M., Maurogordato S., Slezak E., Rho J., 2000, A&A 355, 461
- Ashman et al. (1994) Ashman K.M., Bird C.M., Zepf S.E., 1994, AJ 108, 2348
- Barrena et al. (2007) Barrena R., Boschin W., Girardi M., Spolaor M., 2007, A&A 469, 861
- Bardelli et al. (2001) Bardelli S., Zucca E., Baldi A., 2001, MNRAS 320, 387
- (7) Beers T.C., Flynn K., Gebhardt K., 1990, AJ 100, 32
- (8) Beers T.C., Forman W., Huchra J.P., Jones C., Gebhardt K., 1991, AJ 102, 1581
- (9) Bekki K., 1999, ApJ 510, L15
- (10) Bertin E., Arnouts S., 1996, A&AS 117, 393
- (11) Bird C.M., Beers T.C., 1993, AJ 105, 1596
- Bird (1994) Bird C., 1994, ApJ422, 480
- (13) Biviano A., Murante G., Borgani S., Diaferio A., Dolag K., Girardi M., 2006, A&A 456, 23
- Boschin et al. (2004) Boschin W., Girardi M., Barrena R., Biviano A., Feretti L., Ramella M., 2004, A&A 416, 839
- Boschin et al. (2006) Boschin W., Girardi M., Spolaor M., Barrena R., 2006, A&A 449, 461
- (16) Bottini D., Garilli B., Maccagni D., Tresse L., Le Brun V. et al., 2005, PASP 117, 996
- (17) Bourdin H, Slezak E., Bijaoui A., Arnaud M., 2001, Proceedings of the XXXVIth Rencontres de Moriond , XXIst Moriond Astrophysics Meeting, March 10-17, 2001 Savoie, France. Edited by D.M. Neumann J. Tran Thanh Van (astro-ph/0106138)
- (18) Brunetti G., 2003, ASP Conf. Series 301, p.349 (astro-ph/0208074)
- (19) Bruzual G., Charlot S., 2003, MNRAS 344, 1000
- (20) Bryan G.L., Norman M.L., 1998, ApJ 495, 80
- (21) Carlberg R.G., Yee H.K.C., Ellington E., Abraham R., Gravel P., Morris S., Pritchet C.J., 1996, ApJ 462, 32
- (22) Coleman G., Wu C., Weedman D., 1980, ApJS 43, 393
- (23) Czoske O., Moore B., Kneib J.-P., Soucail G., 2002, A&A 386, 31
- (24) Cypriano E.S., Sodré L.Jr., Kneib J.P., Campusano L.E., 2004, ApJ 613, 108
- (25) den Hartog R., Katgert P., 1996, MNRAS 279, 349
- (26) Dressler A., Shectman S., 1988, AJ 95, 985
- (27) Elbaz D., Arnaud M., Böhringer H., 1995, A&A 293, 337
- (28) Eke V.R., Cole S., Frenk C.S., 1996, MNRAS 282, 263
- (29) Everitt B.S., Hand D.J., 1981, Finite mixture distributions, Chapman & Hall
- (30) Fadda D., Slezak E. Bijaoui A. 1998, A&AS 127, 335
- (31) Ferrari C., Maurogordato S., Cappi A., Benoist C., 2003, A&A 399, 813
- (32) Ferrari C., Benoist C., Maurogordato S., Cappi A., Slezak E., 2005, A&A 430, 19
- (33) Ferrari, C., Govoni, F., Schindler, S., Bykov, A.M., Rephaeli, Y., 2008, SSR, in press
- (34) Feretti L., Fusco-Femiano R., Giovannini G., Govoni F., 2001, A&A 373, 106
- (35) Feretti L., Orru E., Brunetti G., Giovannini G., Kassim N., Setti G., 2004, A&A 423, 11
- (36) Feretti L., 2006, proceeding of XLIst Rencontres de Moriond, XXVIth Astrophysics Moriond Meeting: ”From dark halos to light”, L.Tresse, S. Maurogordato and J. Tran Thanh Van, Eds, astro-ph/0612185
- (37) Flores R. A., Quintana H., Way M. J., 2000, ApJ 532, 206
- (38) Hernquist L., 1990, ApJ 356, 359
- (39) Girardi M., Giuricin G., Mardirossian F., Mezzetti M., Boschin W., 1998, ApJ 505, 74
- Girardi et al. (2005) Girardi M., Demarco R., Rosati P., Borgani S., 2005, A&A 442, 29
- Girardi et al. (2006) Girardi M., Boschin W., Barrena R., 2006, A&A 455, 45
- (42) Giovannini G. Feretti L., 2002, Merging Processes in Galaxy Clusters. Edited by L. Feretti, I.M. Gioia, G. Giovannini. Astrophysics and Space Science Library, Vol. 272. Kluwer Academic Publishers, Dordrecht, 2002, p.197-227
- Gonzalez-Casado et al. (1994) Gonzalez-Casado G., Mamon G.A., Salvador-Sole E., 1994, ApJ 433, L61
- (44) Govoni F., Markevitch M., Vikhlinin A., VanSpeybroeck L., Feretti L., Giovannini G., 2004, ApJ 605, 695
- Henriksen et al. (2000) Henriksen M., Donnelly R.H., Davis D.S., 2000, ApJ 529, 692
- Hernquist (1990) Hernquist L., 1990, ApJ 356, 359
- (47) La Barbera, F., Merluzzi, P., Busarello, G., Massarotti, M., Mercurio, A., 2004, A&A, 425, 797
- (48) Lanzoni B., Ciotti L., Cappi A., Tormen G., Zamorani G., 2004, ApJ 600, 640
- Ledlow et al. (2005) Ledlow M.J., Owen F.N., Miller N.A., 2005, AJ 130, 47
- (50) Le Fèvre O. et al., 2000, SPIE Proc. 4008, 546
- López-Cruz et al. (2004) López-Cruz O., Barkhouse W.A., Yee H.K.C., 2004, ApJ 614, 679
- (52) Lubin L.M., Bahcall N.A., 1993, ApJ 415, L17
- (53) Markevitch M., and Vikhlinin A., 2001, ApJ 563, 95
- (54) Maurogordato S., Proust D., Beers T. C., Arnaud M., Pelló R., Cappi A., Slezak E., Kriessler J. R., 2000, A&A, 355, 848
- (55) McLachlan G. J., Basford K. E., 1988, Mixture Models (Marcel Dekker, New York)
- (56) Miller N. A., Owen F. N., Hill J. M., Keel W. C., Ledlow M. J., Oegerle W. R., 2004, ApJ 613, 841
- (57) Miller N. A., Oegerle W., Hill J. M., 2006, ApJ 131, 2426
- (58) Pinkney J., Roettiger K., Burns J.O., 1996, ApJSS 104, 1
- (59) Popesso P., Bohringer H., Romaniello M. et al., 2005, A&A 433, 415
- (60) Pratt G., Arnaud M., Aghanim N., 2001, astro-ph/0105431
- (61) Quintana H., Ramirez A., and Way M.J., 1996, AJ 112, 36
- (62) Ricker P.M., Sarazin C.L., 2001, ApJ 561, 621R
- (63) Roettiger K., Loken C., Burns J.O., 1997, ApJ 109, 307
- (64) Schindler S., Böhringer H., 1993, A&A 269, 83
- Schlegel et al. (1998) Schlegel D.J., Finkbeiner D.P., Davis M., 1998, ApJ 500, 525
- (66) Scodeggio M., Franzetti P., Garilli B., Zanichelli A., Paltani S. et al., 2005, PASP 117, 1284
- (67) Slezak et al. 2007, in preparation
- (68) Squires G., Neumann D., Arnaud M., Babul A., Bohringer H., Fahlman G., Woods D., 1997, ApJ 482, 648
- (69) Tonry J., Davis M., 1981, ApJ 246, 666
- (70) Vandame B., 2002, SPIE Proc. 4847, 123 (astro-ph/0208230)
- (71) Yahil A., Vidal N.V., 1977, ApJ 214, 347
- (72) Yasuda N. et al. 2001, AJ, 122, 1104
- (73) West M.J., Bothun G.D., 1990, ApJ 350, 36